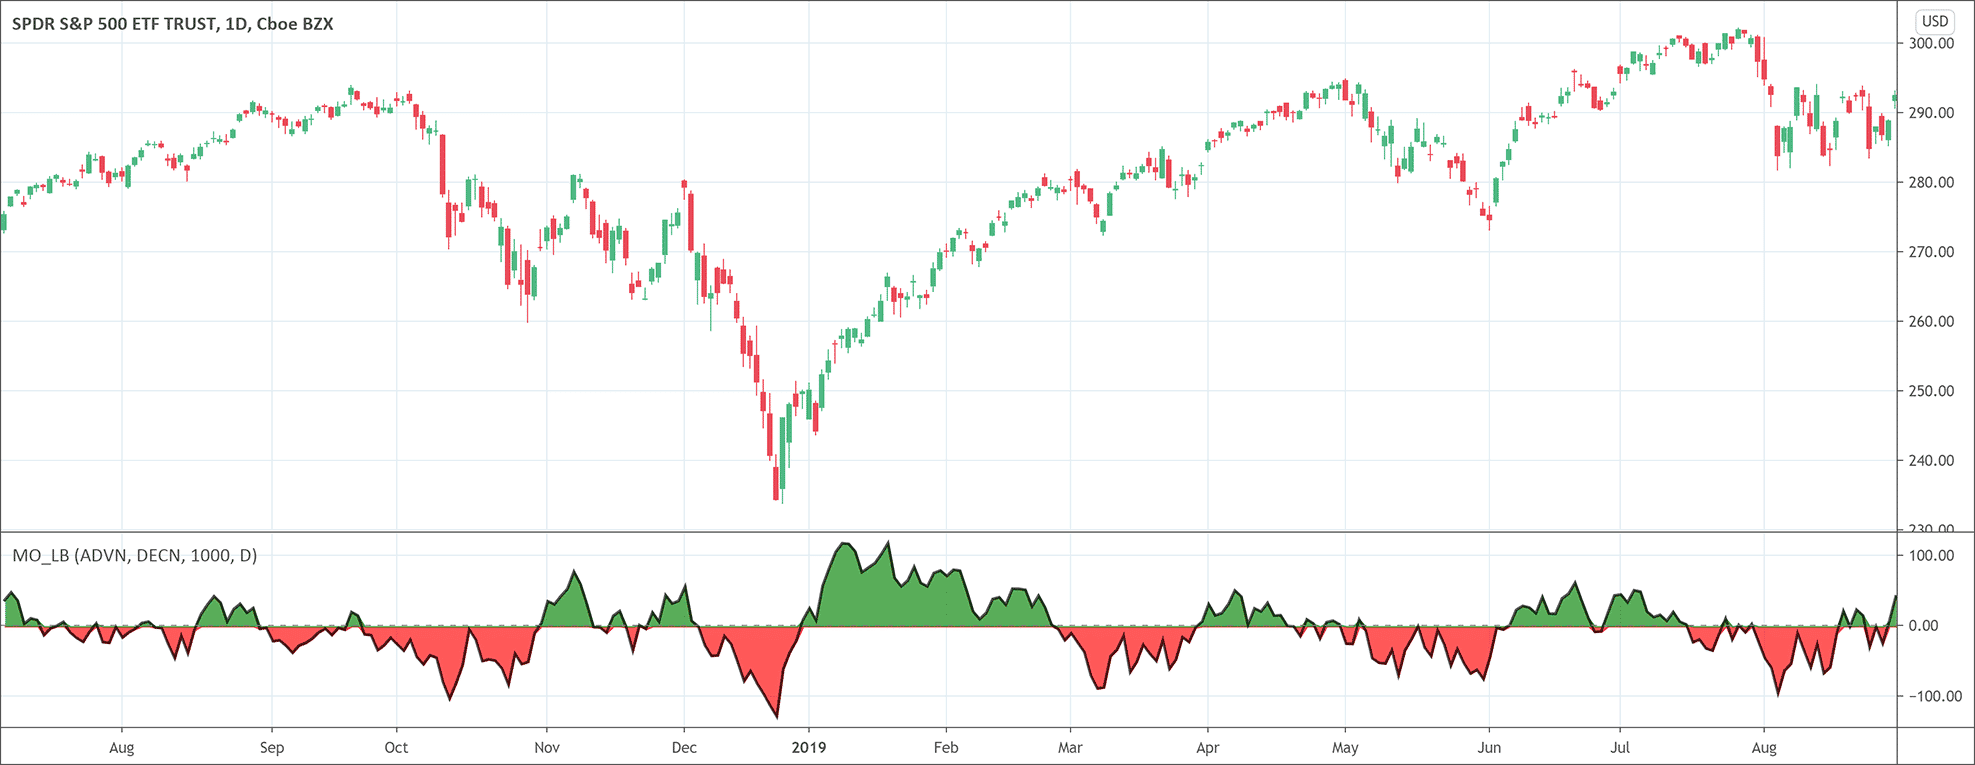
- The McClellan Oscillator is a market breadth indicator.
- The interpretation is similar to the MACD indicator.
What is the McClellan Oscillator?
The McClellan Oscillator is a technical analysis indicator. It quantifies the difference between the advancing and declining issues on a stock exchange. It is also a market breadth indicator that depicts breath thrusts (strong shifts in sentiments in the indexes). Traders often use the McClellan Oscillator for short-term and intermediate-term trading.
Sherman and Marian McClellan developed the McClellan Oscillator in 1969. The goal was to track the relationship between the groups of advancing and declining stocks. They initially applied it to the daily New York Stock Exchange data for a fast exponential moving average (EMA) of 19 periods and for a slow EMA of 39 periods. Although the McClellan Oscillator was originally applied to NYSE, traders can apply it on different stock exchanges or groups of stocks.
The formula for the Oscillator
The formula for the calculations of the McClellan Oscillator is the following.
McClellan Oscillator = (19-period EMA of Advances-Declines) – (39-period EMA of Advancing-Decline)
Where 19-period EMA is
(Today’s Advances – Declines) × 0.10 + Previous day’s EMA
And 39-period EMA is
(Today’s Advances – Declines) × 0.05 + Previous day’s EMA
Traders can also adjust this formula for a better comparison of values over longer periods of time.
How to interpret the McClellan Oscillator
The interpretation of the McClellan Oscillator is just like the MACD‘s. The plotted line crosses the zero line whenever the short-term moving average crosses the longer-term moving average. It issues a bullish market signal when the McClellan Oscillator crosses above zero and the advance/decline trend issue is positive. Conversely, the crossing of the McClellan Oscillator below zero tells a negative trend of advance/decline issues and indicates a bearish trend in the market. As a general rule, the market is considered overbought/oversold when the McClellan Oscillator is above +70 and -70 respectively.
Moreover, positive and rising values of the McClellan Oscillator suggest the accumulation of the stocks while negative and declining values suggest the selloff of stocks. When the indicator registers a long move from negative to positive and jumps 100 or more points, it is a breadth thrust. After the bottom of indexes is in, the scenario indicates prices will soon head higher.
When the McClellan Oscillator indicator and the index prices begin to move in different directions, it suggests a weak index trend. When the McClellan Oscillator rises but the index fails to rise, it is an indication of bullish divergence and also indicates that the index may rise soon as more stocks will advance. On the other hand, when the McClellan Oscillator falls but the index rises, it is an indication of bearish divergence.
The importance of the McClellan Oscillator indicator
The McClellan Oscillator is one of the most useful breadth indicators. It is important because of the following reasons.
- It shows a correlation to the movements of the stock market.
- This indicator gives us an alternative way to measure the market movements rather than just looking at the prices of the indices.

 Good Trading requires the Best Charting Tool!

 We loved Marwood Research’s course “Candlestick Analysis For Professional Traders“. Do you want to follow a great video course and deep dive into 26 candlestick patterns (and compare their success rates)? Then make sure to check this course!