
 Good Trading requires the Best Charting Tool!
- The upside gap three methods candlestick pattern is a 3-bar bearish continuation pattern.
- It has 2 green candles and a red one.
- The second candle gaps above the first one.
Statistics to prove if the Upside Gap Three Methods pattern really works
Are the odds of the Upside Gap Three Methods and Downside Gap Three Methods pattern in your favor?
How does the Upside Gap Three Methods and Downside Gap Three Methods behave with a 2:1 target R/R ratio?
From our research the Upside Gap Three Methods and Downside Gap Three Methods pattern confirms 38.5% of the time on average overall all the 4120 markets we analysed. Historically, this patterns confirmed within 7 candles or got invalidated within 5 candles. If confirmed, it reached the 2:1 R/R target 37.8% of the time and it retested it's entry price level 94.9% of the time.
Not accounting for fees, it has an expected outcome of 0.133 $/$.
It means for every $100 you risk on a trade with the Upside Gap Three Methods and Downside Gap Three Methods pattern you make $13.3 on average.
Want to account for your trading fees? Have the detailled stats for your favorite markets / timeframes? Or get the stats for another R/R than 2:1?
🚀 Join us now and get fine-tuned stats you care about!
How to handle risk with the Upside Gap Three Methods and Downside Gap Three Methods pattern?
We analysed 4120 markets for the last 59 years and we found 36 932 occurrences of the Upside Gap Three Methods and Downside Gap Three Methods pattern.
On average markets printed 1 Upside Gap Three Methods and Downside Gap Three Methods pattern every 422 candles.
For 2:1 R/R trades, the longest winning streak observed was 11 and the longest losing streak was 17. A trading strategy relying solely on this pattern is not advised. Anyway, make sure to use proper risk management.
Keep in mind all these informations are for educational purposes only and are NOT financial advice.
If you want to learn more and deep dive into candlestick patterns performance statistics, I strongly recommend you follow the best available course about it. Joe Marwood (who's a famous trader with more than 45 000 Twitter followers) created an online course called "Candlestick Analysis For Professional Traders" in his Marwood Research University. There he will take you through the extensive backtesting of the 26 main candlestick patterns. He then summarizes which one is THE best pattern. Do you know which one it is?
Remember, don't trade if you don't know your stats. Click here to signup to the course now!
What is the Upside Gap Three Methods candlestick pattern?
The upside gap three methods candlestick pattern is a bearish continuation pattern that only occurs during an uptrend. It consists of three candles. The first two candles are long and white in the direction of the prevailing trend. The second black candle creates an upside gap. The third candle fills the gap between the first and the second candle. The upside gap three methods candlestick pattern belongs to the family of the bullish upside Tasuki gap formation. The only difference between the two patterns is that the gap between the two candles of the Tasuki pattern is not filled by the third candle. Technical analysts and experts consider both of these patterns with medium reliability and confirmation must be acquired from any other source.
How to identify this candlestick pattern?
The upside gap three methods candlestick pattern appears only during an uptrend because it is a bullish continuation pattern. It is a three-bar pattern that is very rare and it is a tricky task to identify it. The upside gap three methods pattern has the following characteristics that are helpful to identify it.
- The prevalent trend in the market must be an uptrend.
- The first candle must be white, long, and bullish.
- The second candle must also be white, long, and bullish creating an upside gap between itself and the first candle.
- The third candle must be a bearish one covering the gap between the first and the third candle.
What does the pattern tell traders?
The upside gap three methods candlestick pattern is an important pattern even though it has medium reliability. It is a continuation pattern, therefore, it indicates that the bullish trend will continue after a pause. It also shed light on the psychology of the masses involved in trading during the period of its formation.
The upside gap three methods pattern is characterized by a gap that occurs when the market is moving upward. The third candle must fill the gap. The fact that the gap is filled immediately leads traders to believe that the stalemate was temporary and resulting pullback is a profit-taking opportunity.
Moreover, the appearance of the first bullish candle indicates that the uptrend is continuing with close well above the open creating a long-range real body. This boosts the confidence of the bulls and raises concerns for the bears. The appearance of the second candle justifies the confidence of the bulls at the expense of some serious concerns of the bears. The second candle creates a gap up and resulting buying pressure pushes the prices to new highs. Eventually, profit-taking activities let the third candle fill the gap. Again, after the completion of the upside gap three methods candlestick pattern, the bulls assume that the bullish trend will continue.
Like all the rest of the candlestick patterns, the upside gap three methods candlestick pattern is also highly useful for extracting valuable information about the market. However, it is imperative to learn about the patterns and identify them correctly to maximize the odds of successful trading.
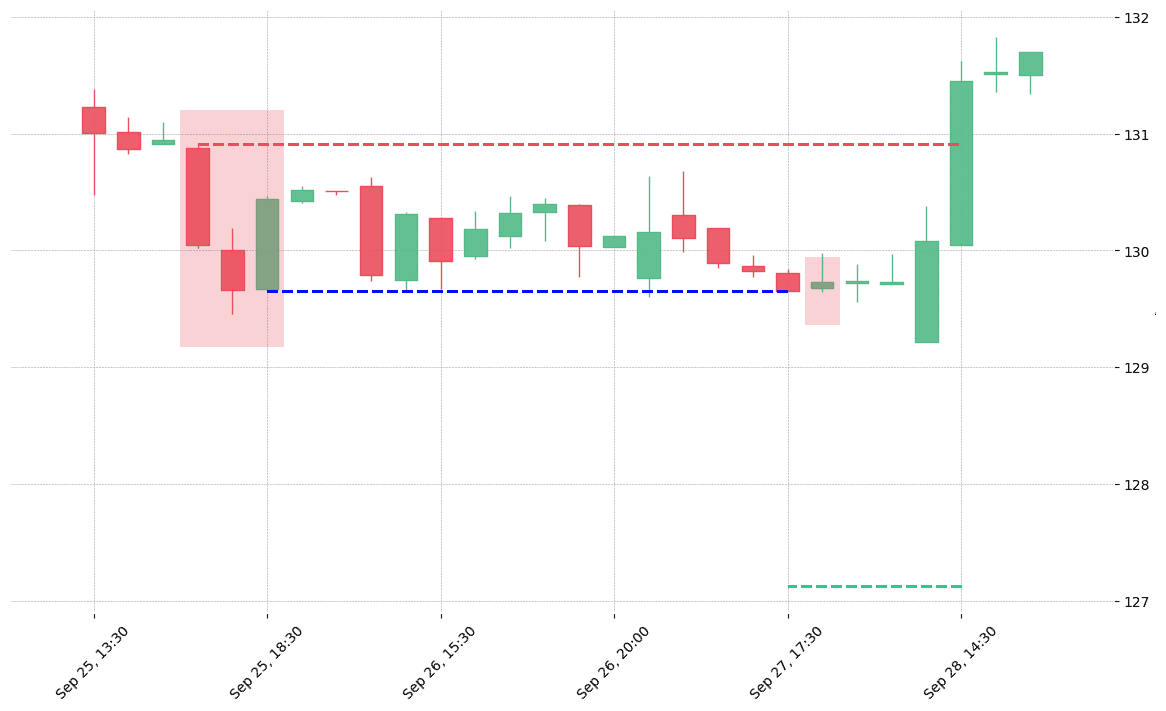
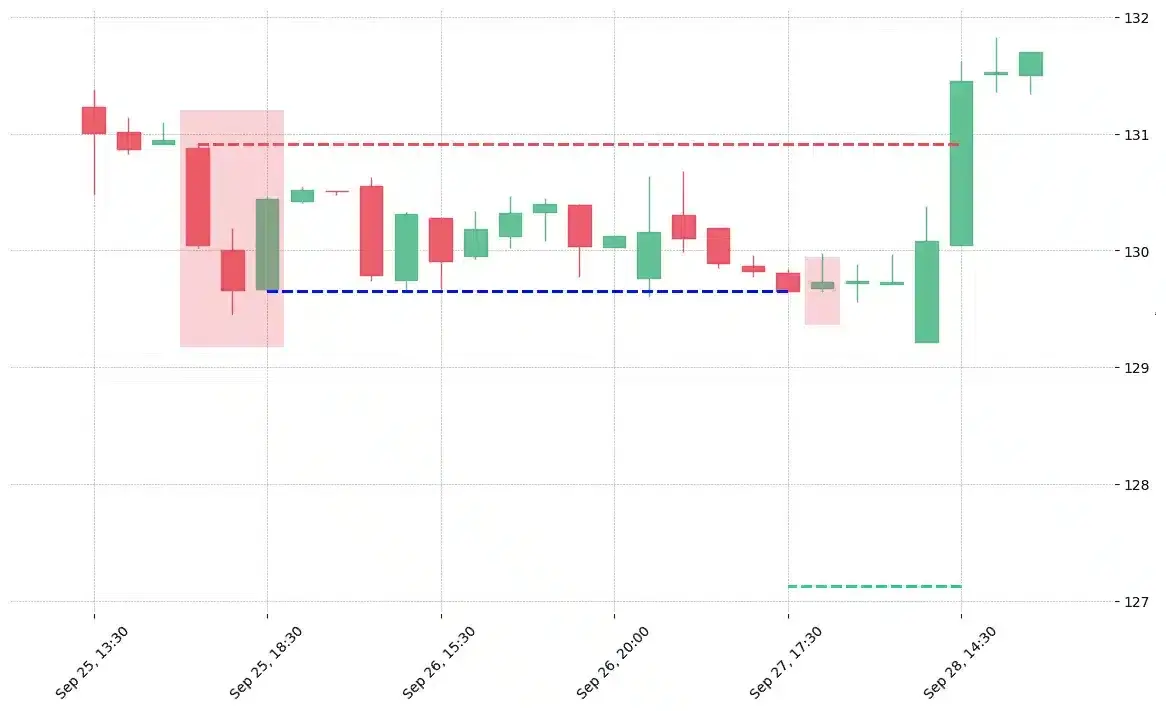
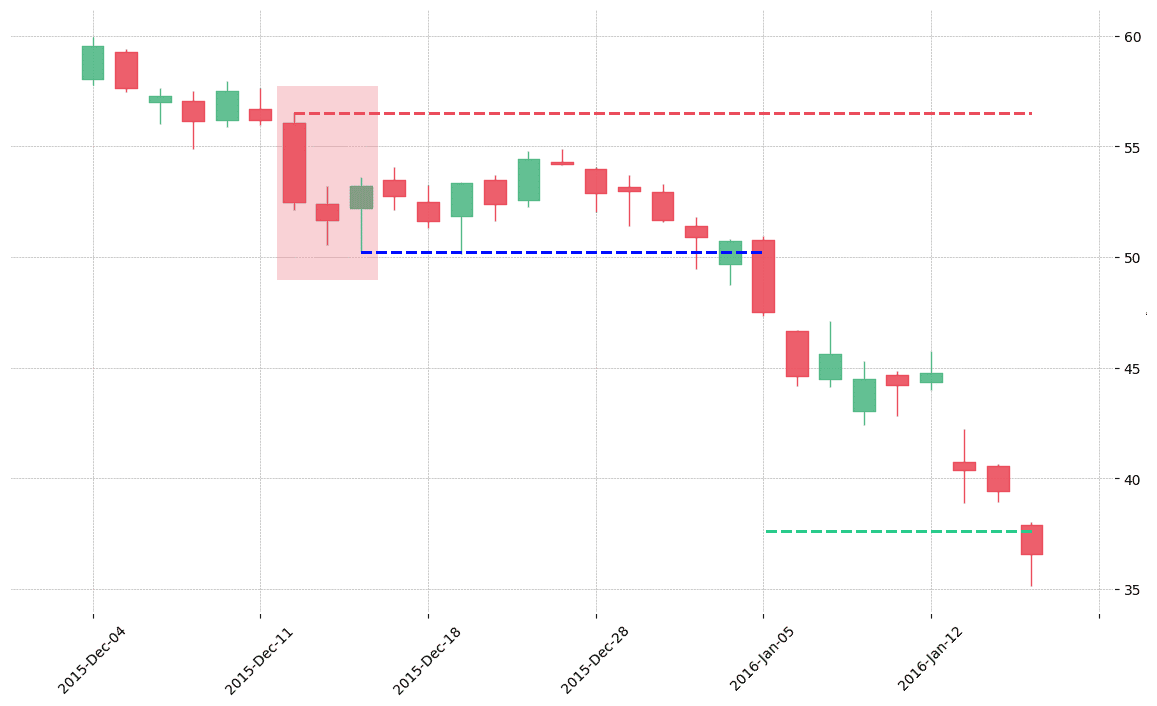
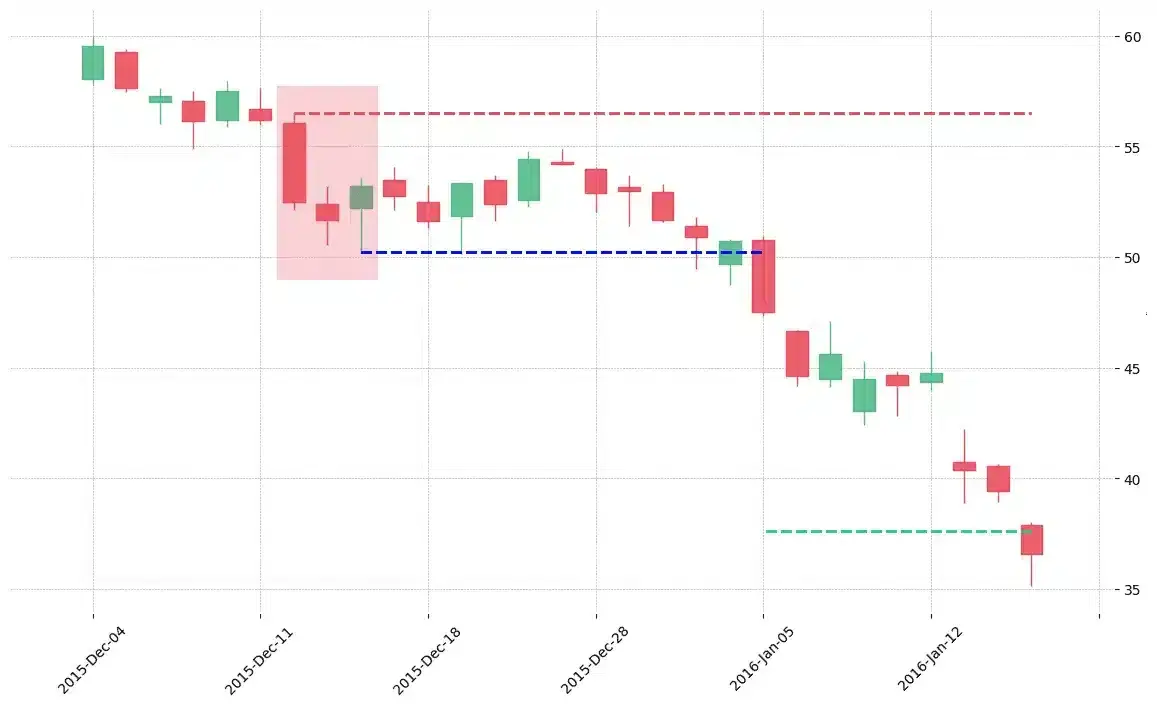
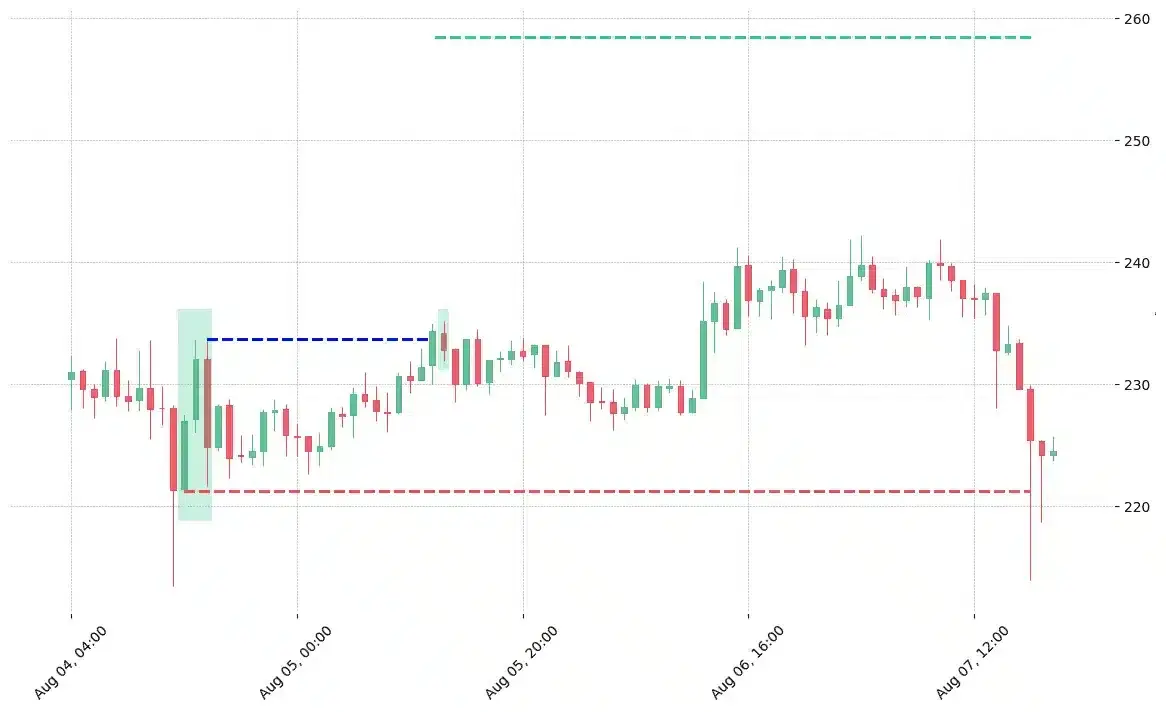
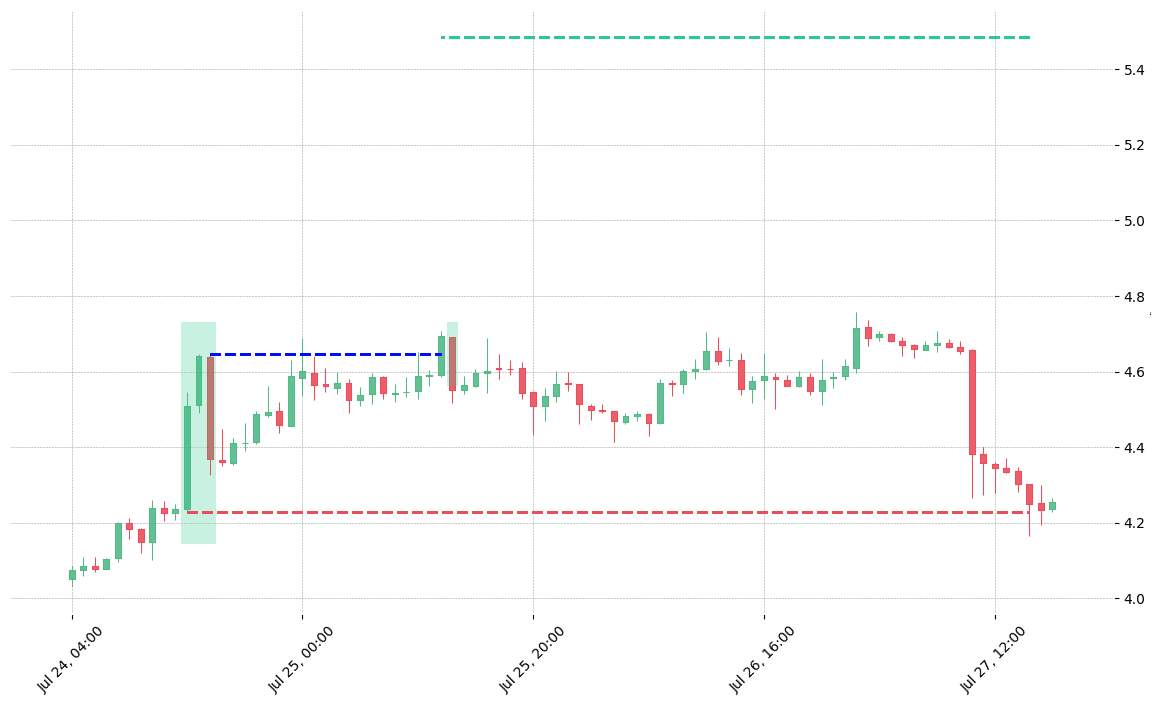
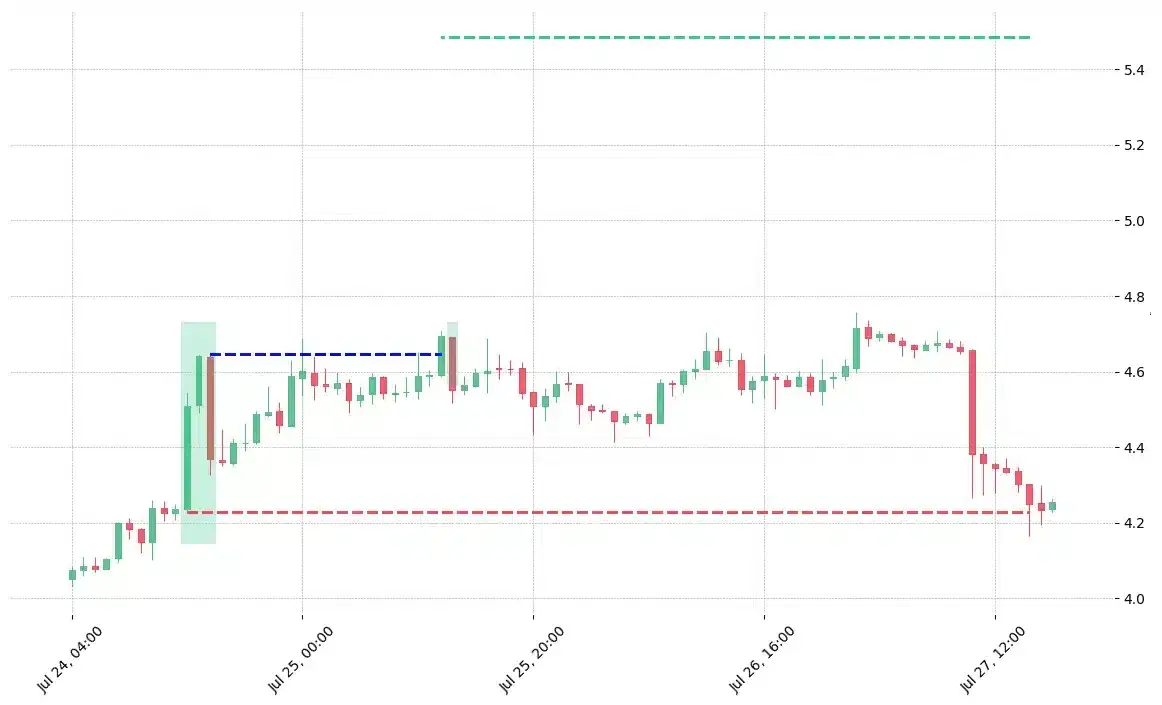
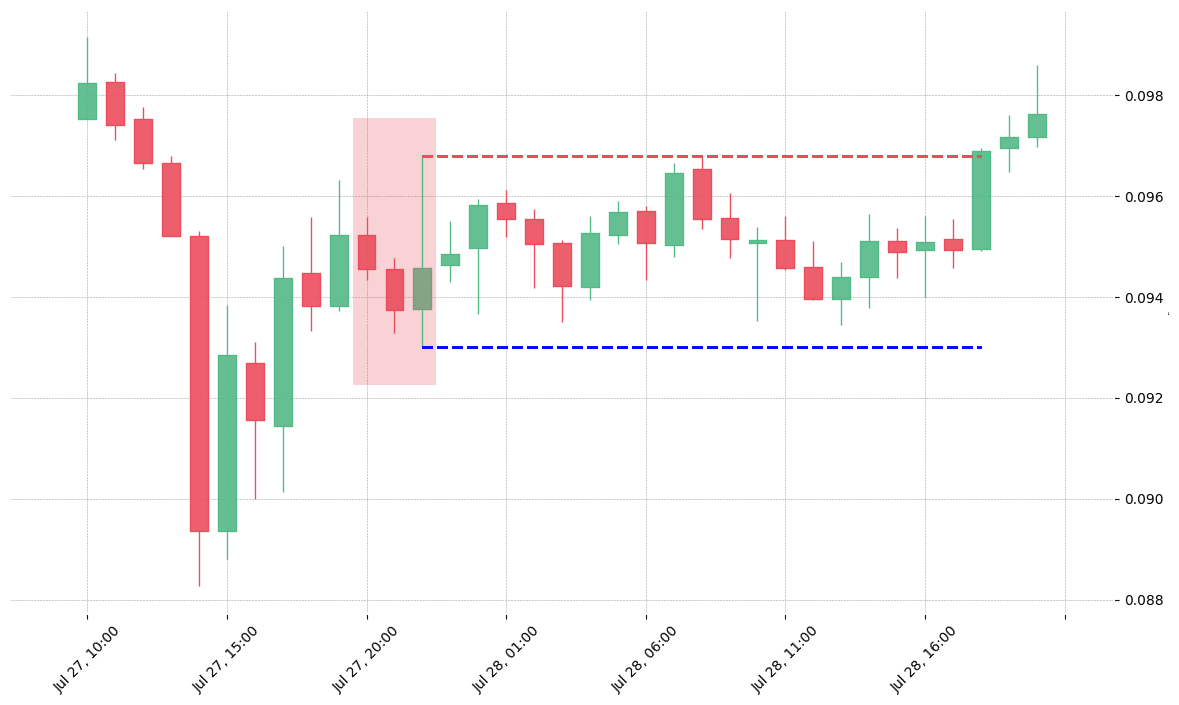
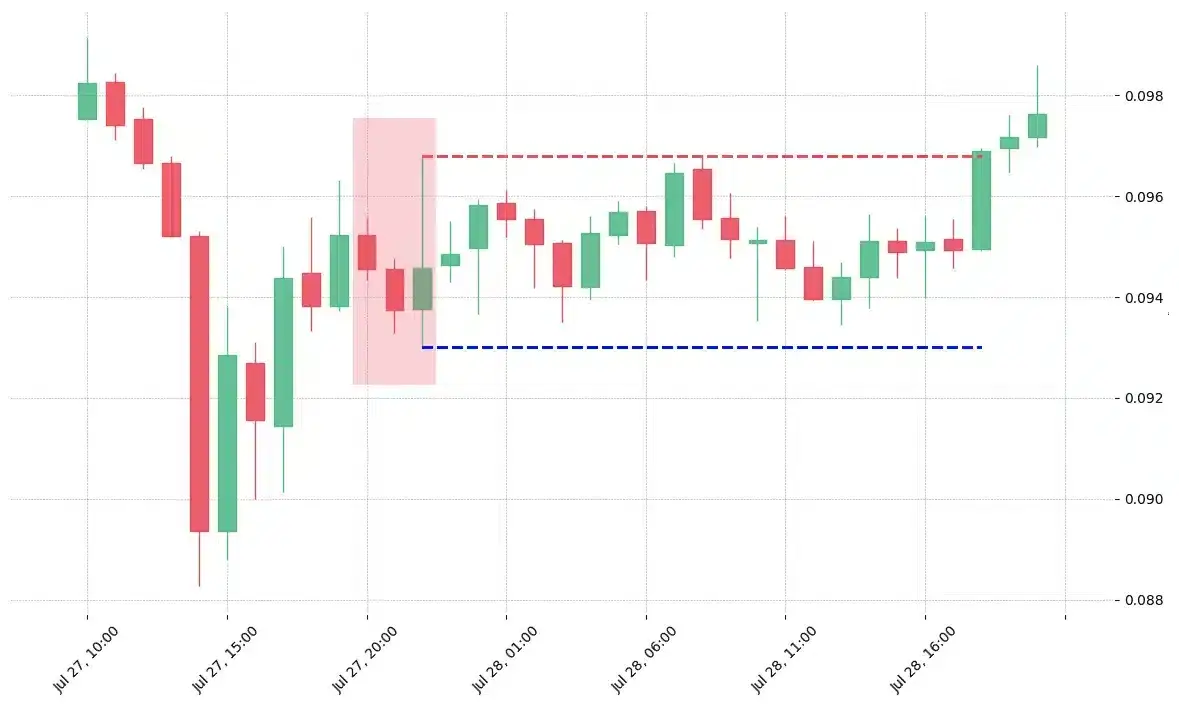
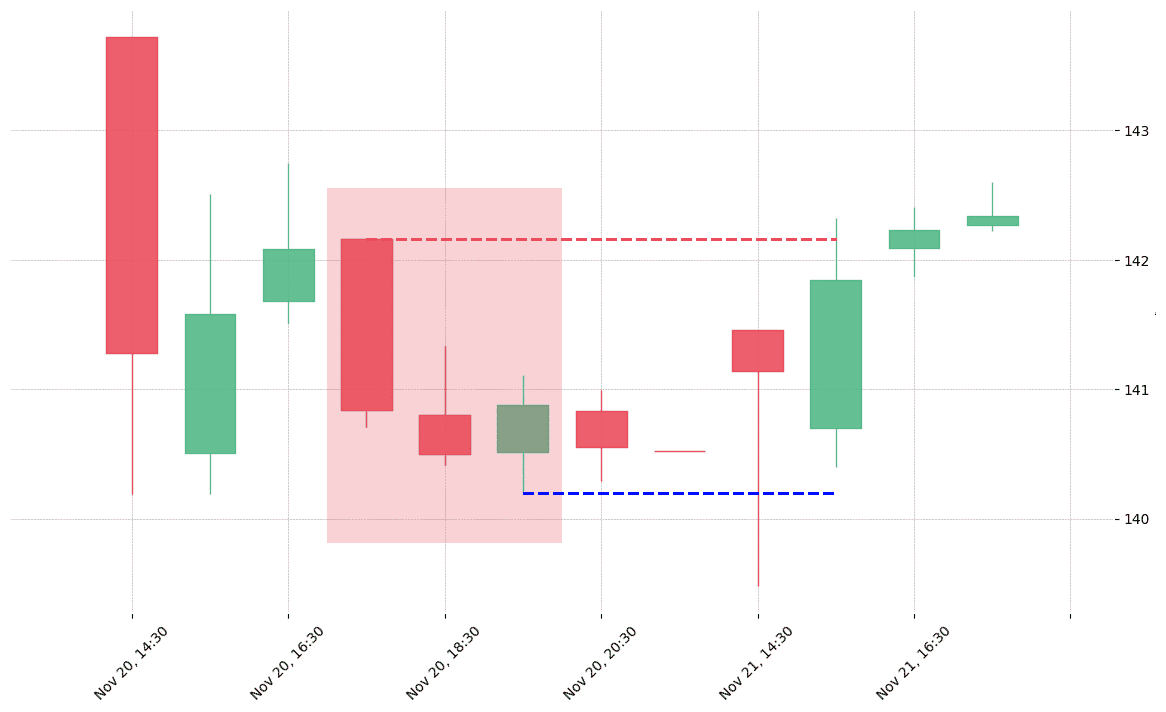
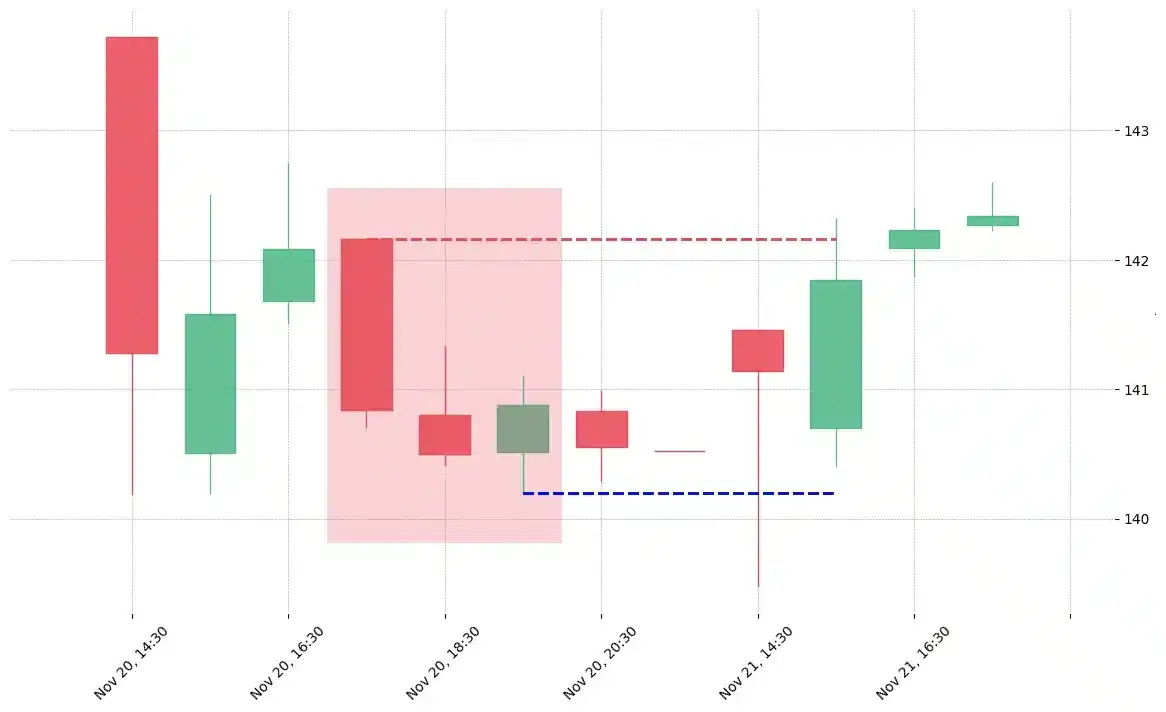
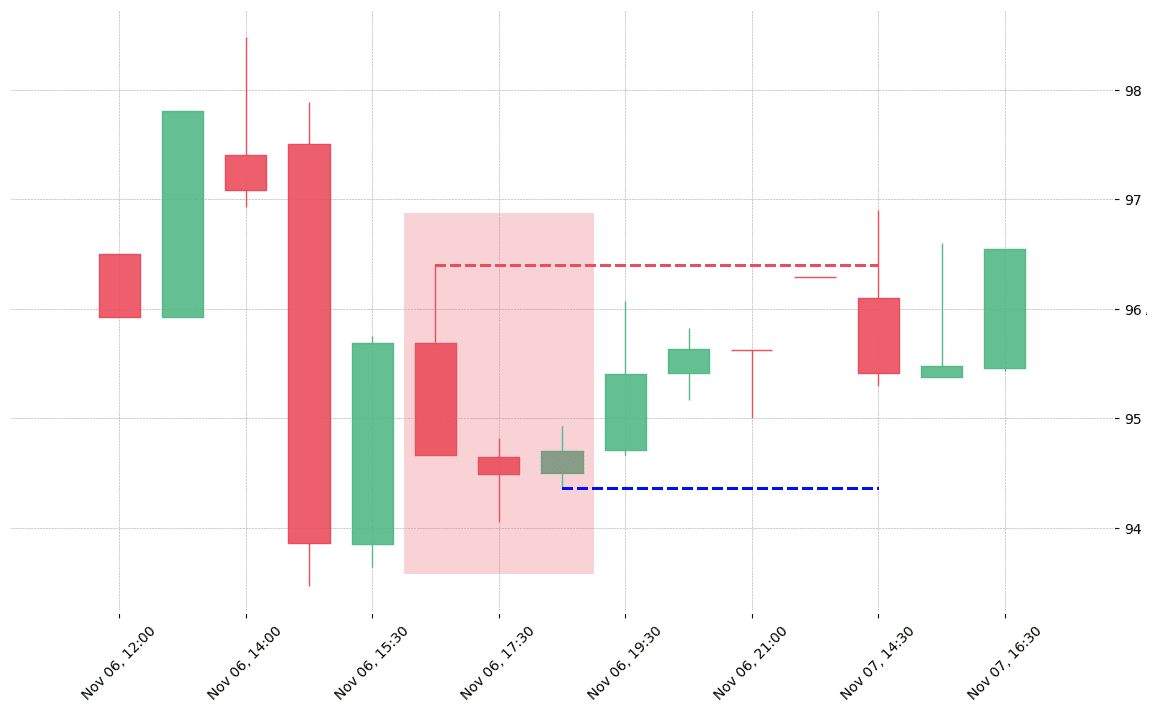
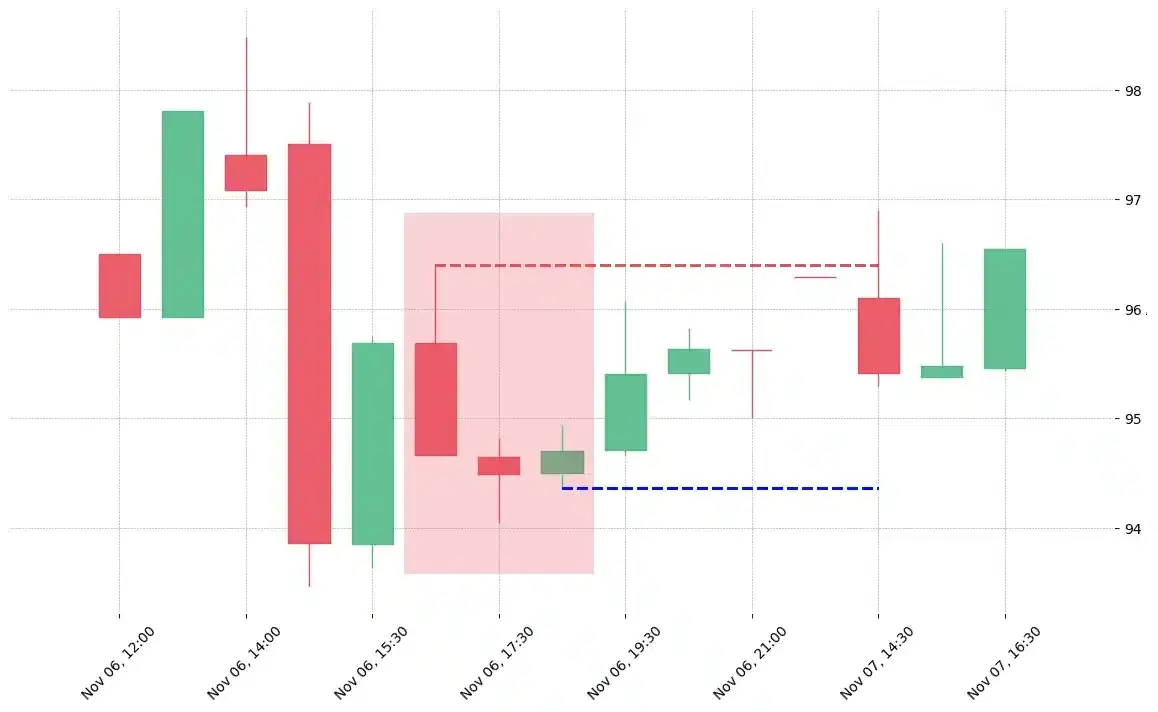
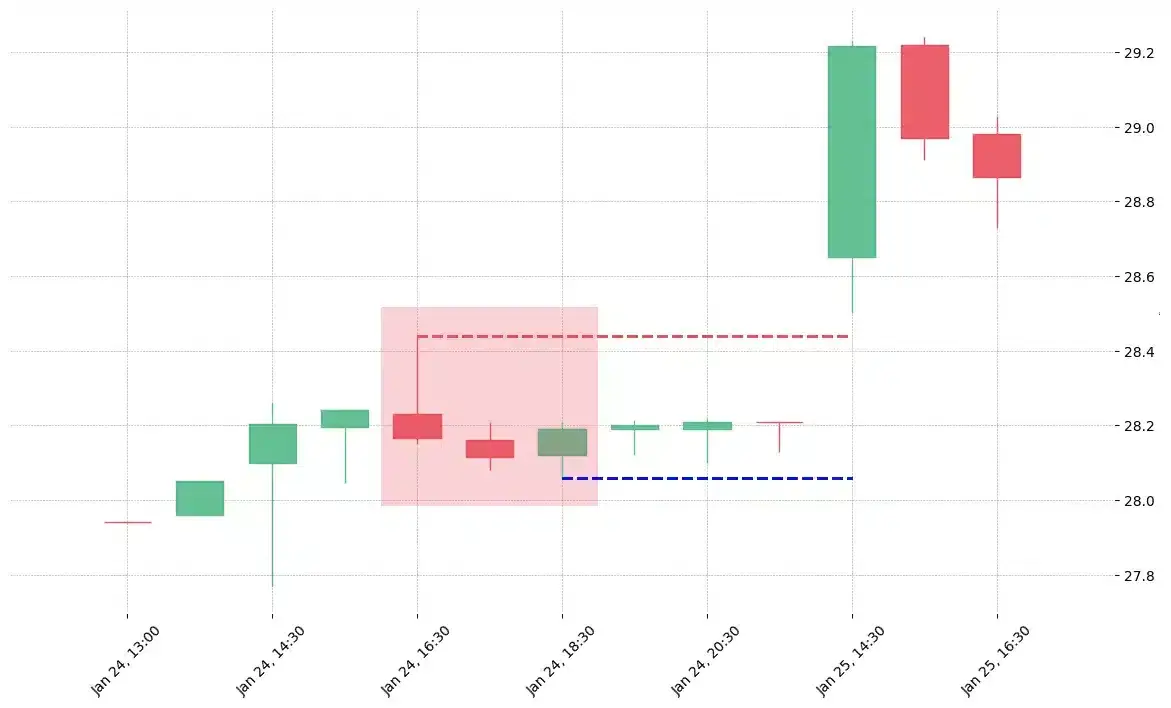
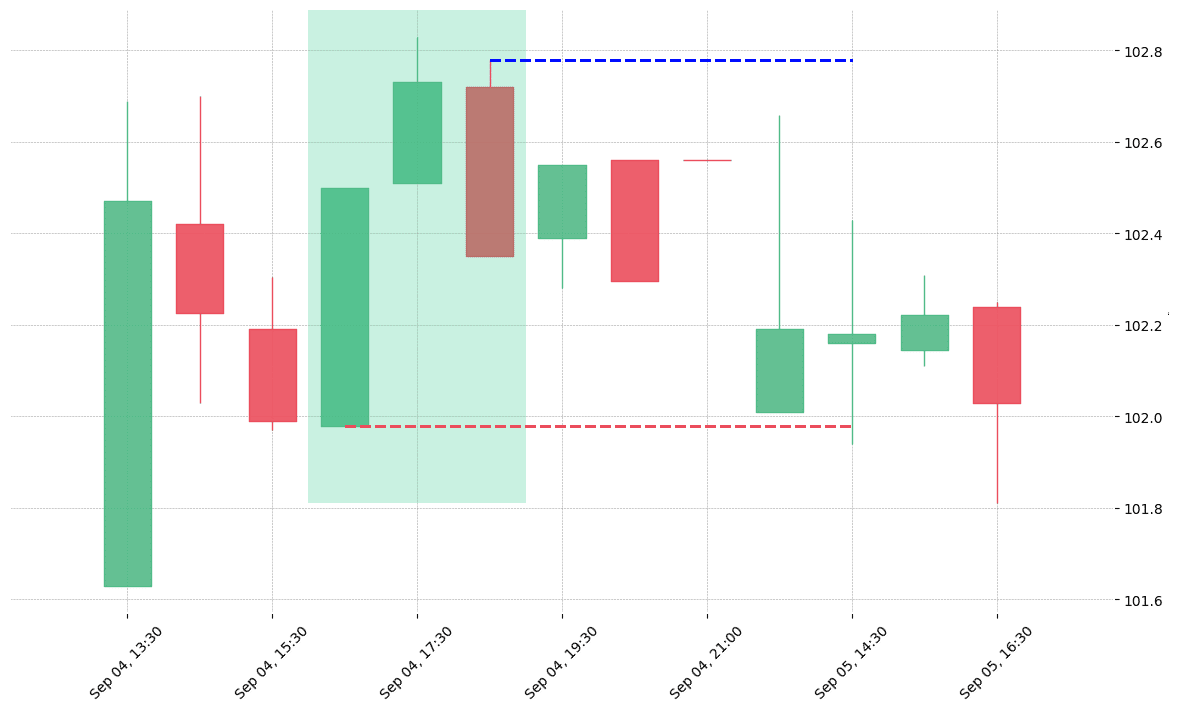
How does the Upside Gap Three Methods pattern look in real life?


Looking to learn more about this pattern?
You should take a look at Joe Marwood's online course. In his course, he backtested the 26 main candlestick patterns before to summarize which one is THE best pattern. I really liked his course and you shouldn't miss it!
Click here to signup to his "Candlestick Analysis For Professional Traders" course now!


 We loved Marwood Research’s course “Candlestick Analysis For Professional Traders“. Do you want to follow a great video course and deep dive into 26 candlestick patterns (and compare their success rates)? Then make sure to check this course!