Two Crows candlestick pattern: What is it?

Candlestick patterns

Two Crows pattern
  • The Two Crows candlestick pattern is a three-line bearish reversal pattern.
  • How to identify the pattern:
    • The market must be in an uptrend. 
    • The first candle must be a long white candle. 
    • The second candle is a short black candle that starts with an upwards gap.
    • The third candle must close the gap between the first two candles and it opens inside the body of the previous candle and closes inside the first candle.

Statistics to prove if the Two Crows pattern really works

Are the odds of the Two Crows pattern in your favor?


How does the Two Crows behave with a 2:1 target R/R ratio?

Success rate

From our research the Two Crows pattern confirms 63.7% of the time on average overall all the 4120 markets we analysed. Historically, this patterns confirmed within 2.8 candles or got invalidated within 4.1 candles. If confirmed, it reached the 2:1 R/R target 35.2% of the time and it retested it's entry price level 97.5% of the time.
Not accounting for fees, it has an expected outcome of 0.057 $/$. It means for every $100 you risk on a trade with the Two Crows pattern you make $5.7 on average.
Want to account for your trading fees? Have the detailled stats for your favorite markets / timeframes? Or get the stats for another R/R than 2:1?
🚀 Join us now and get fine-tuned stats you care about!

How to handle risk with the Two Crows pattern?


We analysed 4120 markets for the last 59 years and we found 1 910 occurrences of the Two Crows pattern.
On average markets printed 1 Two Crows pattern every 8 169 candles.

For 2:1 R/R trades, the longest winning streak observed was 4 and the longest losing streak was 16. A trading strategy relying solely on this pattern is not advised. Anyway, make sure to use proper risk management.

Stack the odds in my favor NOW!

Keep in mind all these informations are for educational purposes only and are NOT financial advice.

If you want to learn more and deep dive into candlestick patterns performance statistics, I strongly recommend you follow the best available course about it. Joe Marwood (who's a famous trader with more than 45 000 Twitter followers) created an online course called "Candlestick Analysis For Professional Traders" in his Marwood Research University. There he will take you through the extensive backtesting of the 26 main candlestick patterns. He then summarizes which one is THE best pattern. Do you know which one it is?
Remember, don't trade if you don't know your stats. Click here to signup to the course now!

What is the Two Crows pattern?

The two crows candlestick pattern is a bearish reversal pattern that forms during an uptrend. In the two crows pattern, the market closes lower after an opening gap up during an uptrend. It a popular pattern that gives an early signal of uptrend deterioration and a potential reversal of the trend. 

The two crows candlestick pattern has three candles. The first candle is a long white candle that closes nears its high. The second candle is a small black candle which tends to create a gap by moving away from the previous day’s candle and closes near its low. However, its closing point is still above the high of the first candle. The third candle fills the gap between the first two candles and opens inside the body of the second candle. 

How to identify this candlestick pattern? 

The successful execution of the trading strategy depends on the correct identification of the chart patterns. It is not always an easy task to identify the pattern correctly. Similarly, to identify the two crows’ candlestick pattern, it is imperative to look for the following characteristics that are prerequisites for a two crows pattern formation. 

  • The market must be in an uptrend. 
  • The first candle must be a long white candle. 
  • The second candle is a short black candle that starts with an upwards gap.
  • The third candle must close the gap between the first two candles and it opens inside the body of the previous candle and closes inside the first candle.

What does the Two Crows candlestick pattern tell traders?

The two crows candlestick pattern is a 3-days pattern that is only a bearish reversal pattern. The first white candle increases the bullishness of the already present uptrend. The gap is up on the next day. Prices begin to fall and the small black candle forms. However, the prices fail to close below the close of the previous day. The third candle opens above or at the close level of the second day’s close but it continues to decline and closes well inside the body of the second candle. The third candle fills the gap and signals the deterioration of the bullish trend. 

The appearance of a relatively small black candle signals a loss of upward momentum. Then a large black candle follows the small candle of the previous day that confirms the change in momentum. It indicates that bulls are losing control and buying pressure has begun to fade. Being a bearish trend reversal pattern, the two crows pattern is also popular for generating reliable sell signals. However, it is important to note that the two crows bearish pattern requires confirmation. The confirmation is provided by the following candle breaking a trend line or the closest support area that the first line generally creates. If the confirmation is not confirmed, it is nothing more than a pause during an uptrend. The two crows candlestick pattern is a “trade with the trend” pattern that makes it perform well for the technical analysts and traders. 

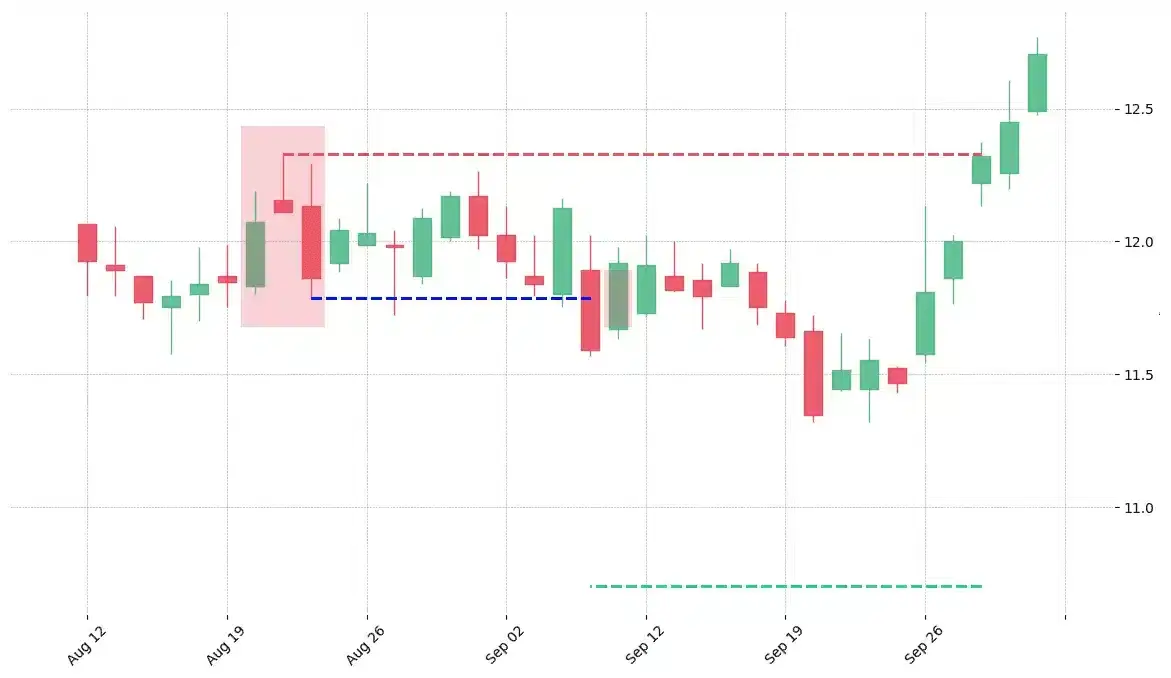
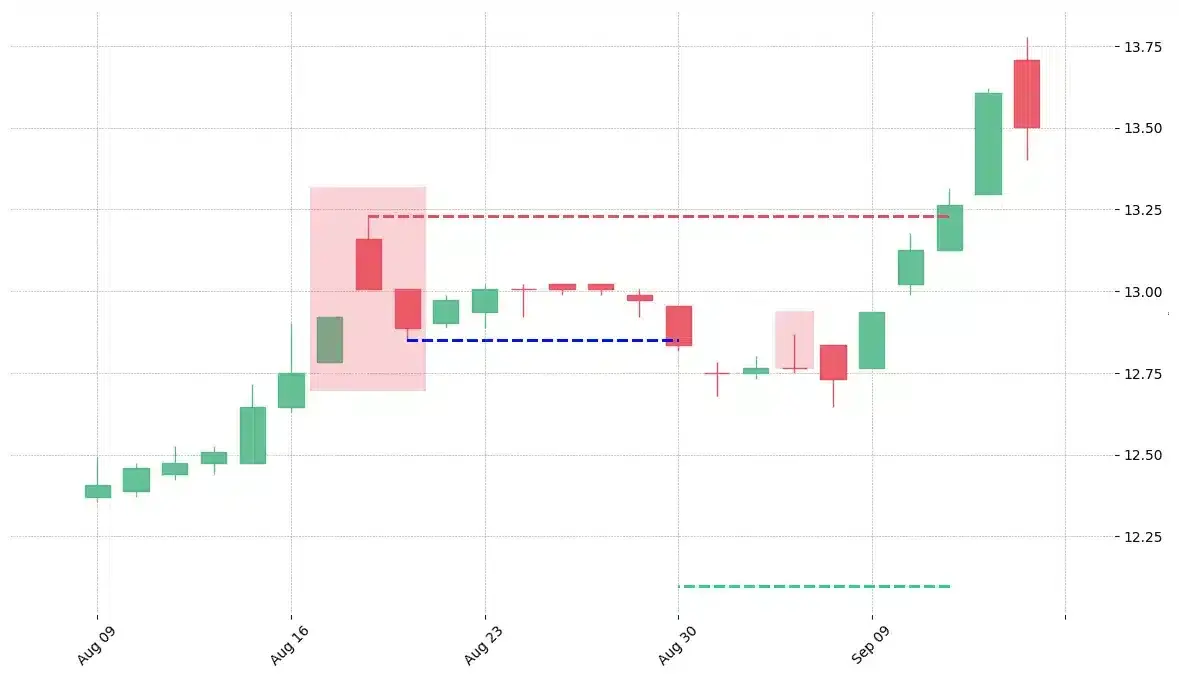
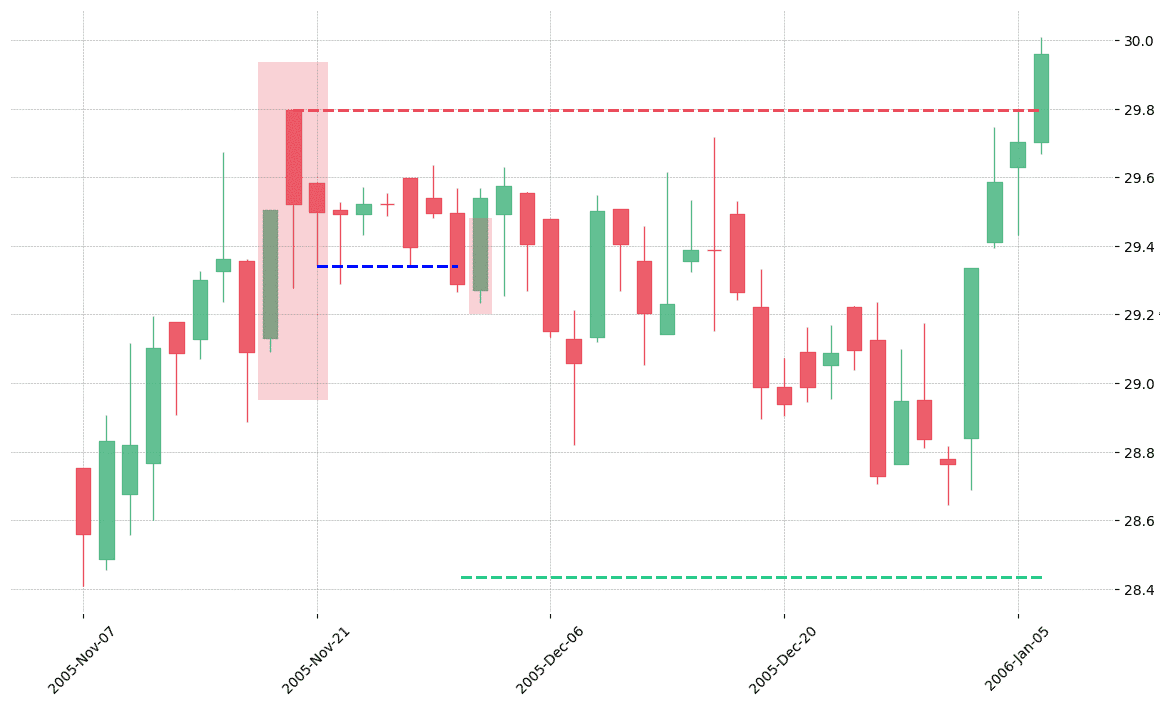
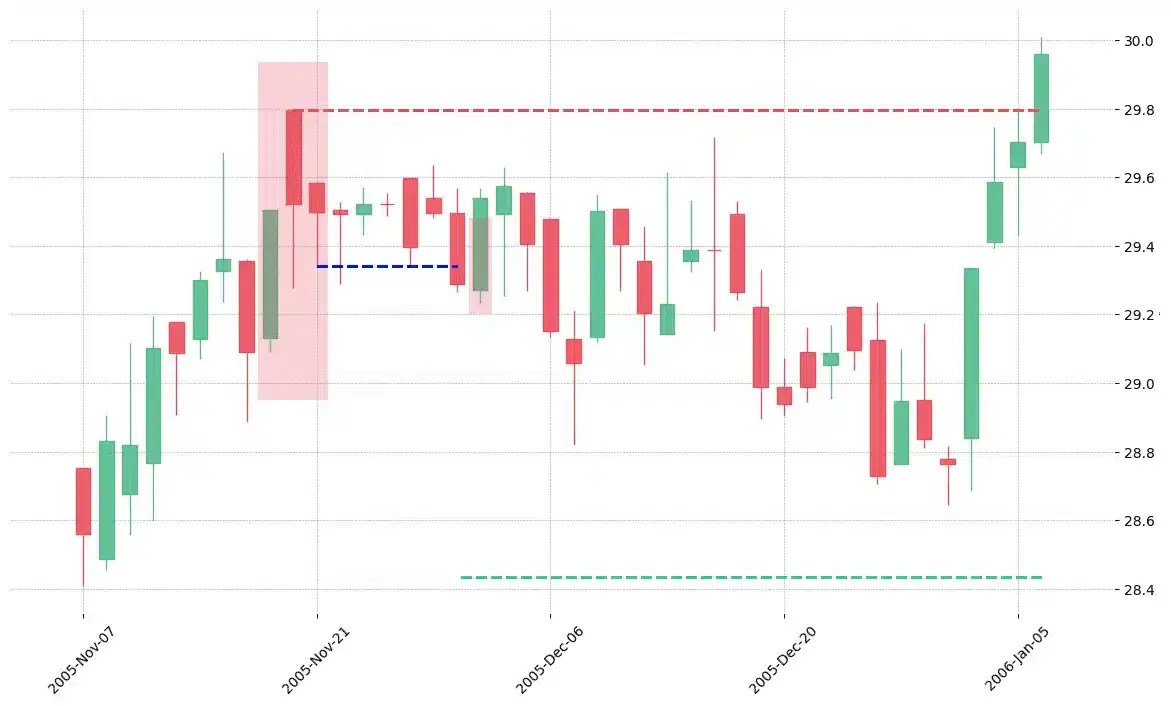
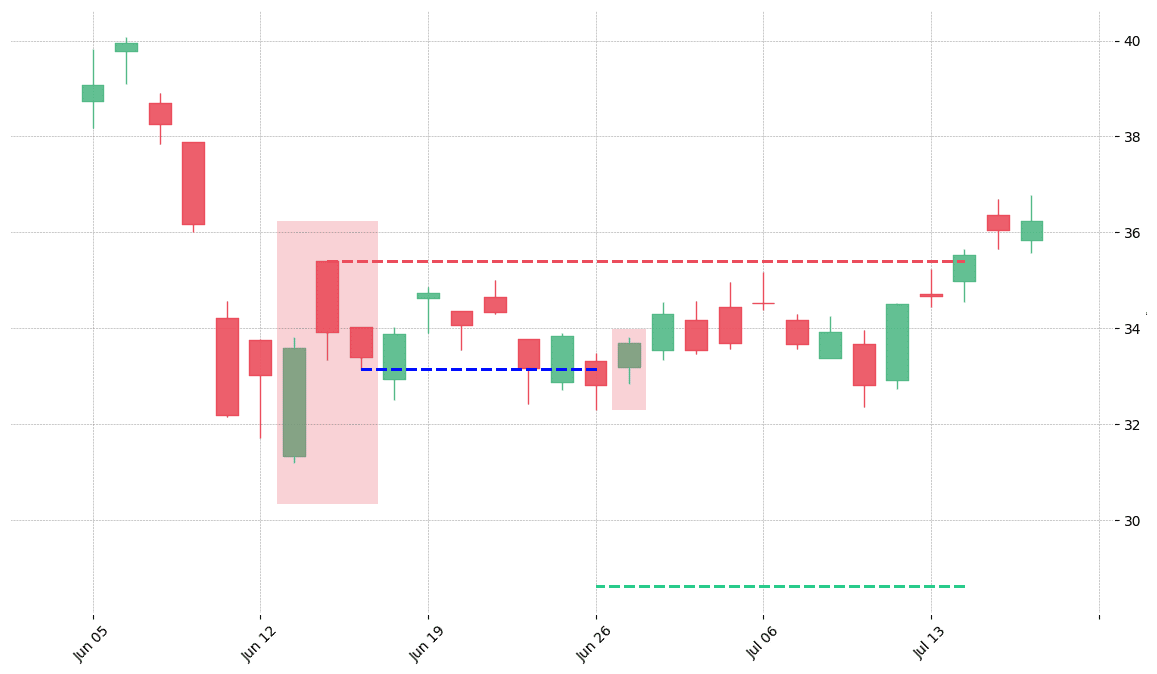
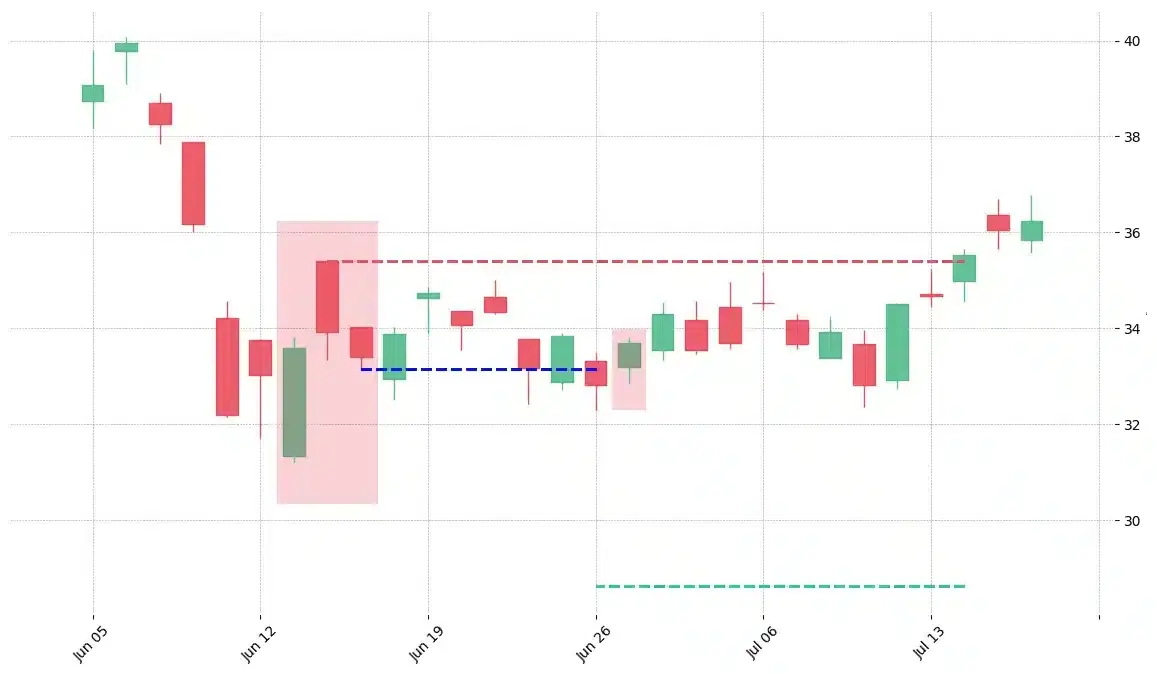
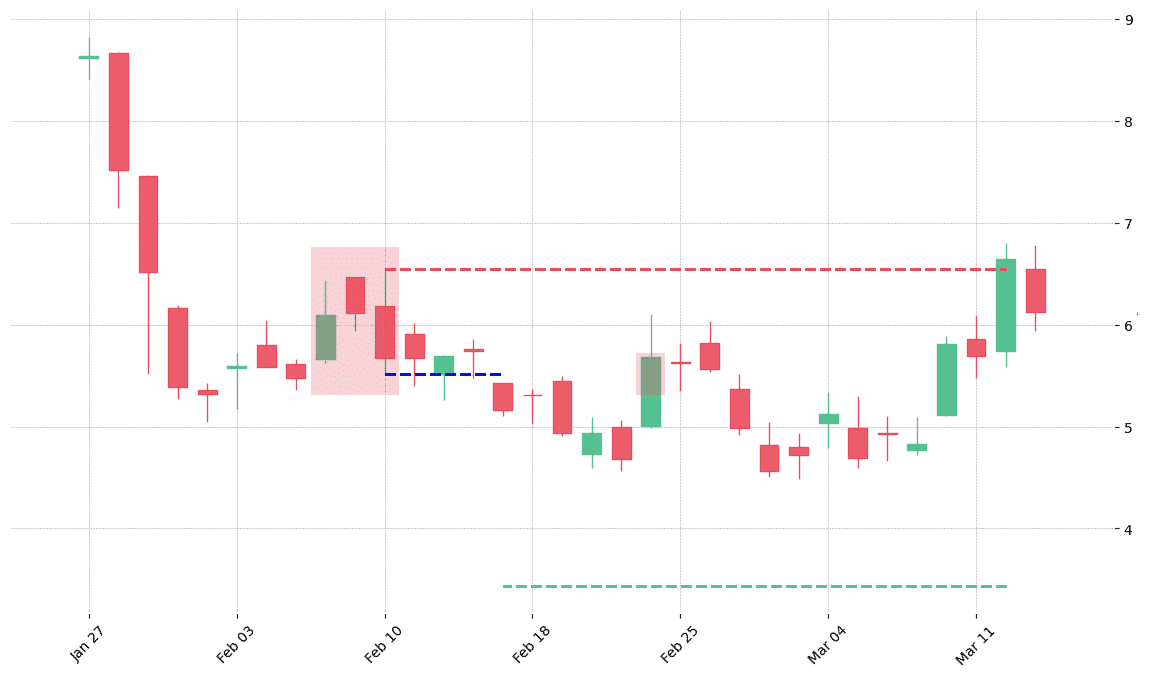
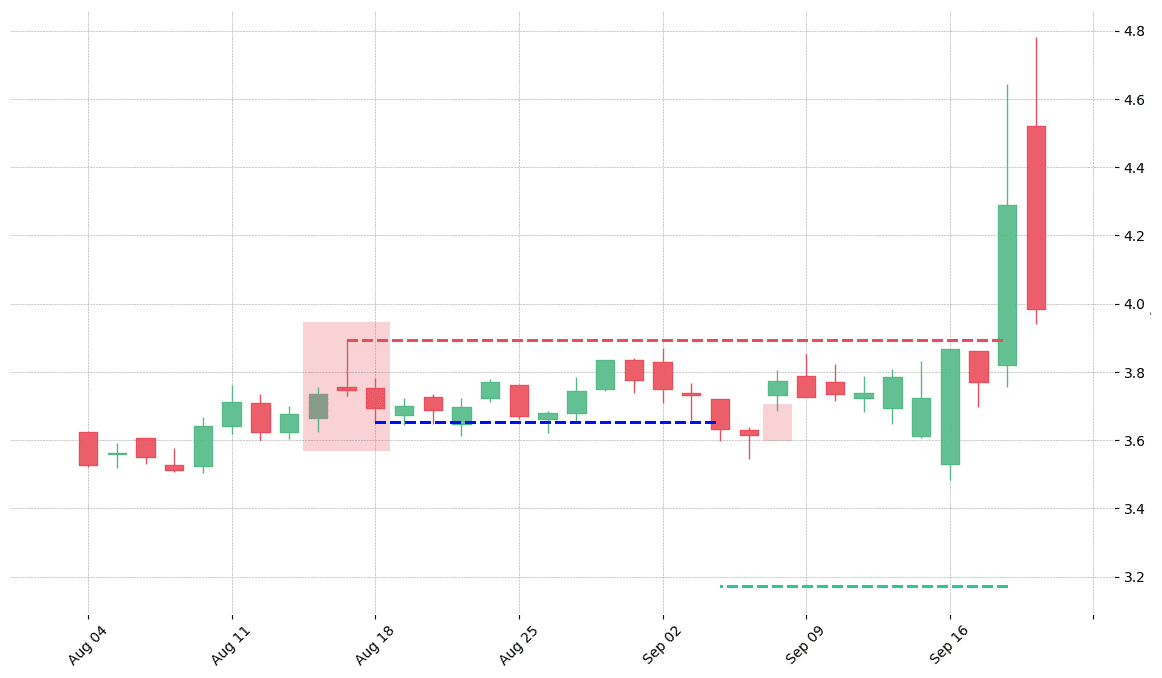
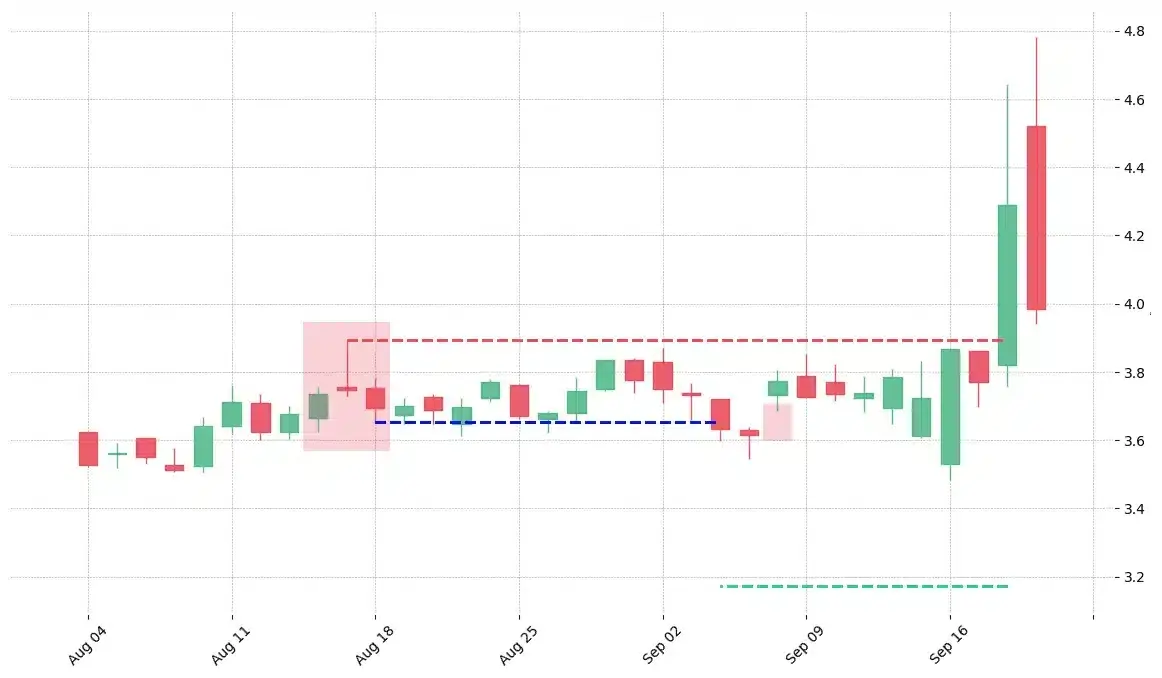
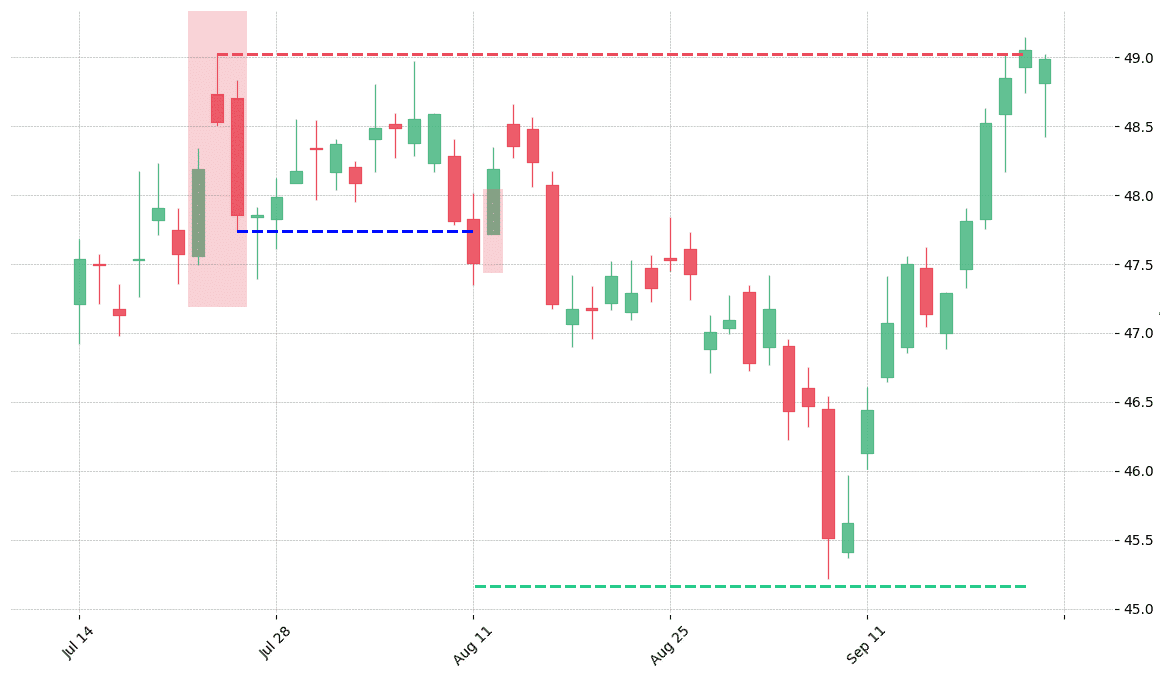
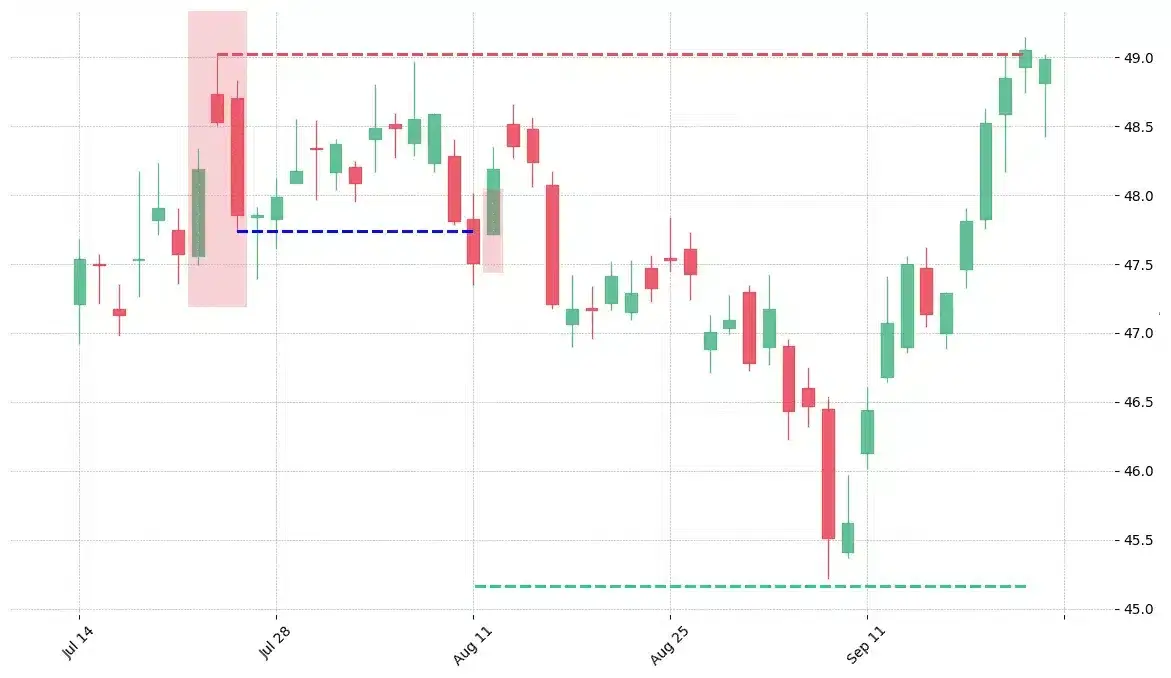
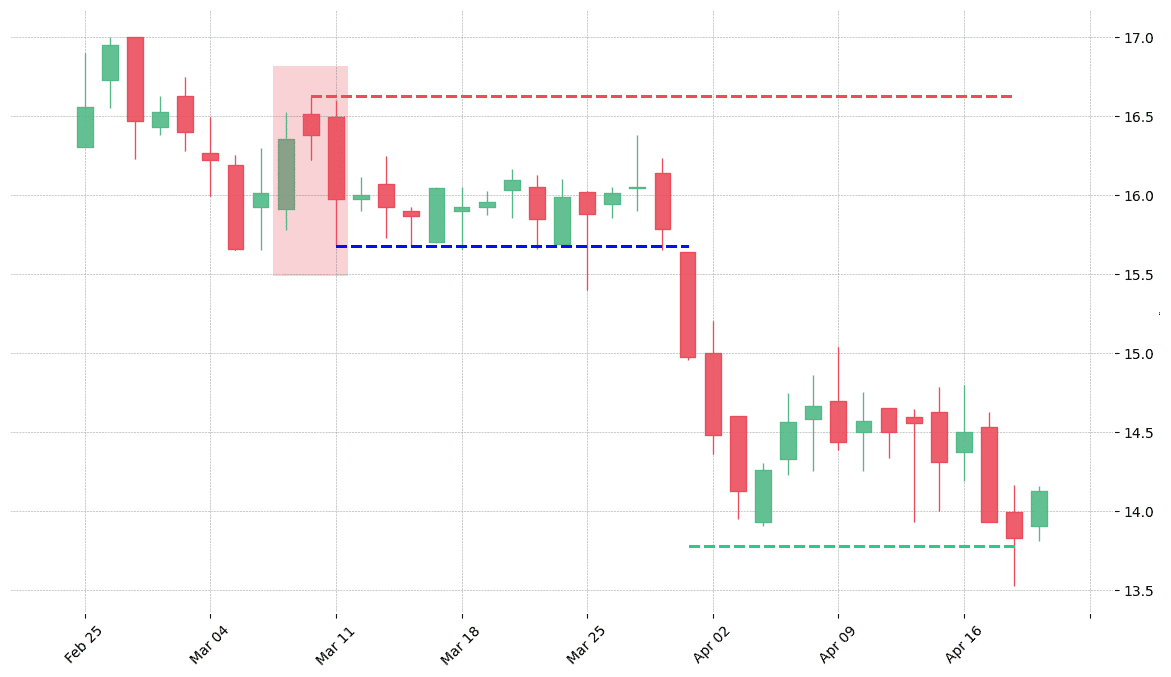
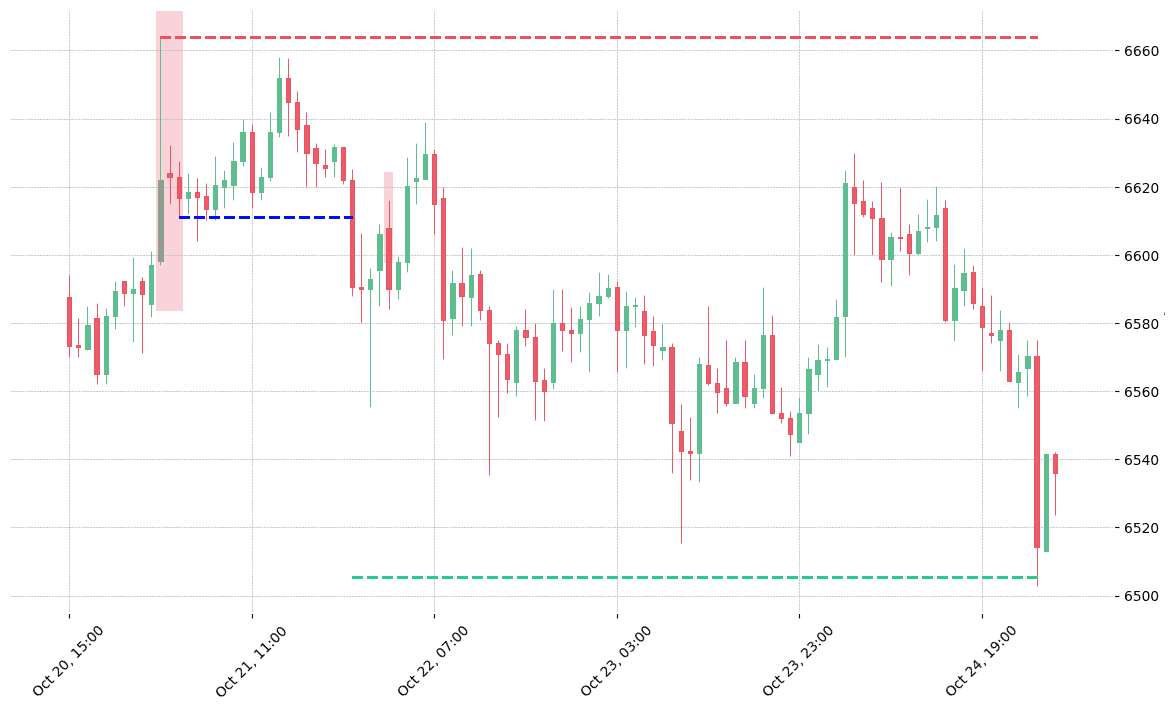
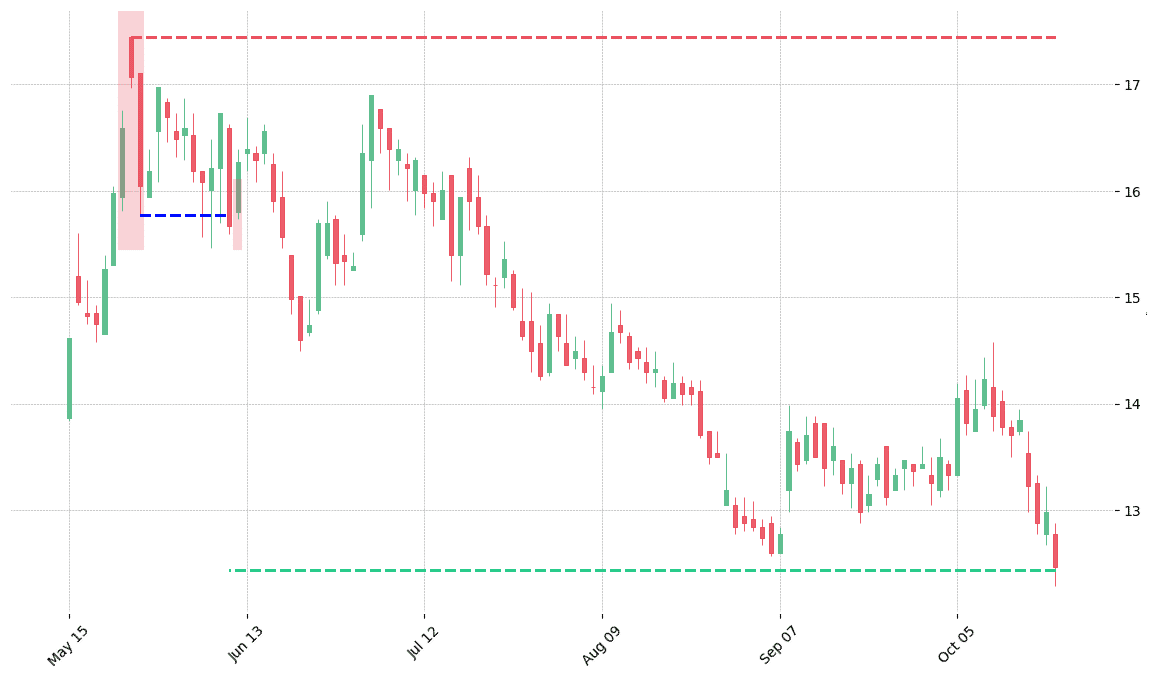
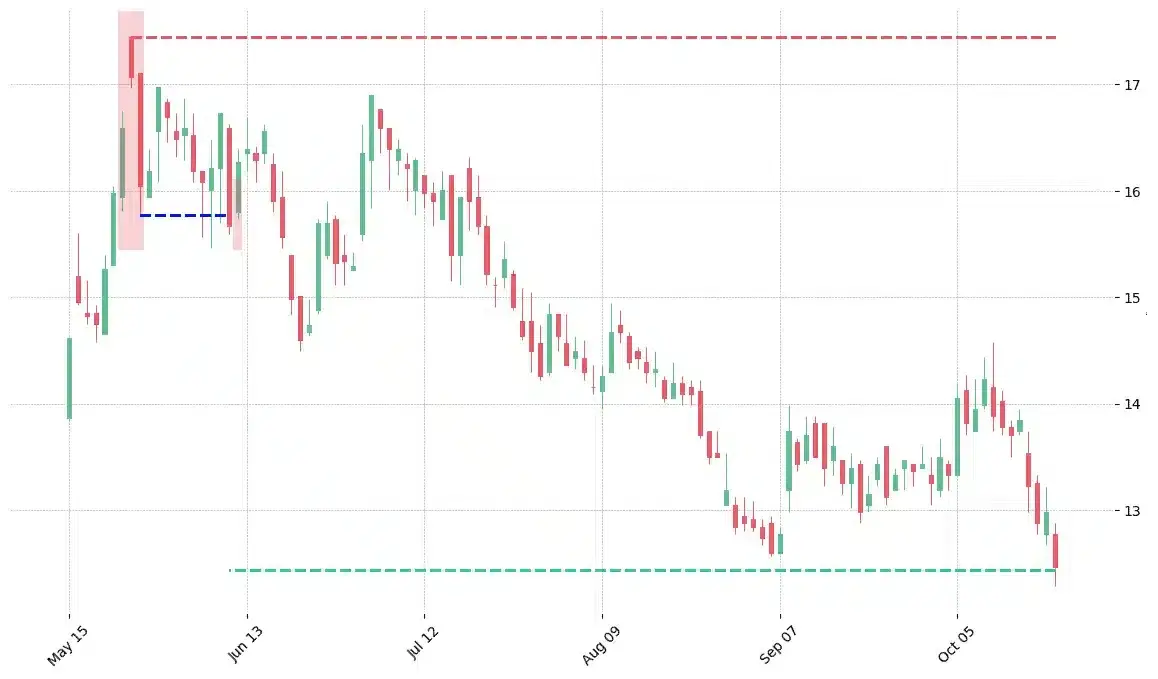
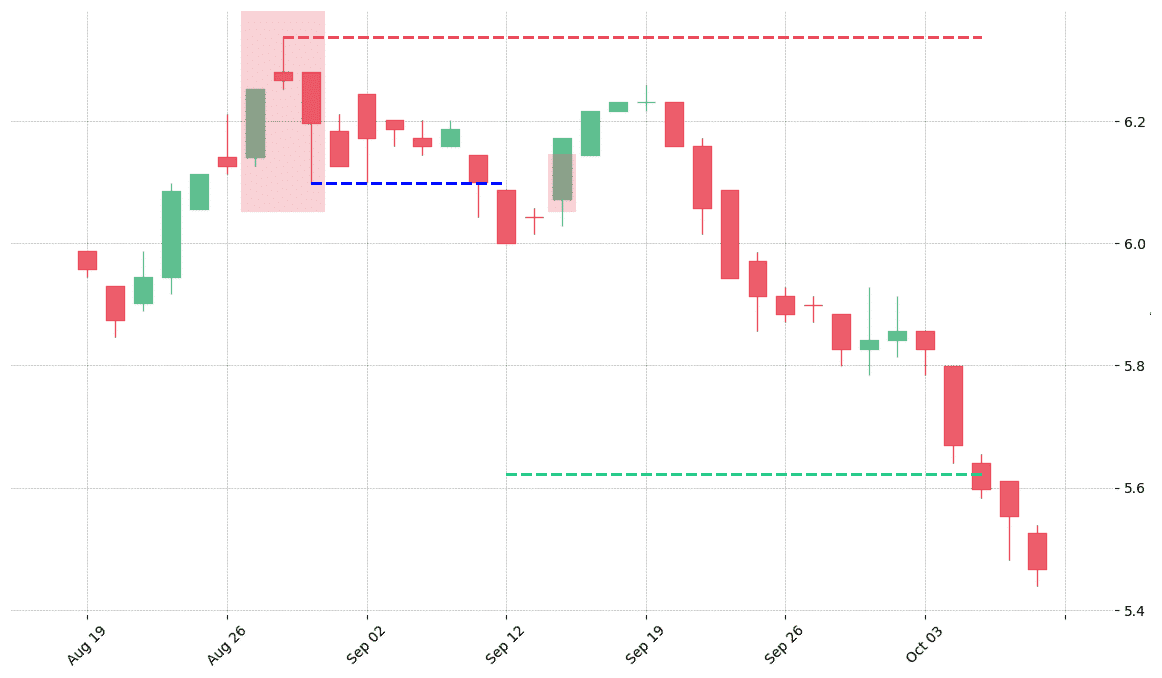
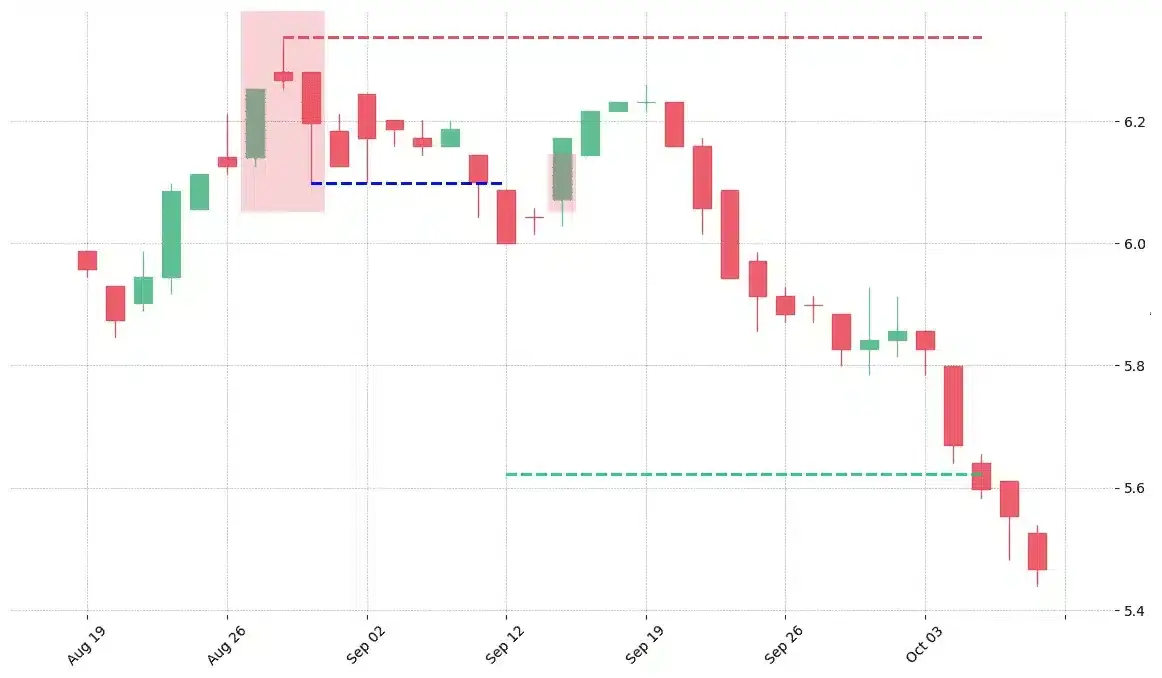
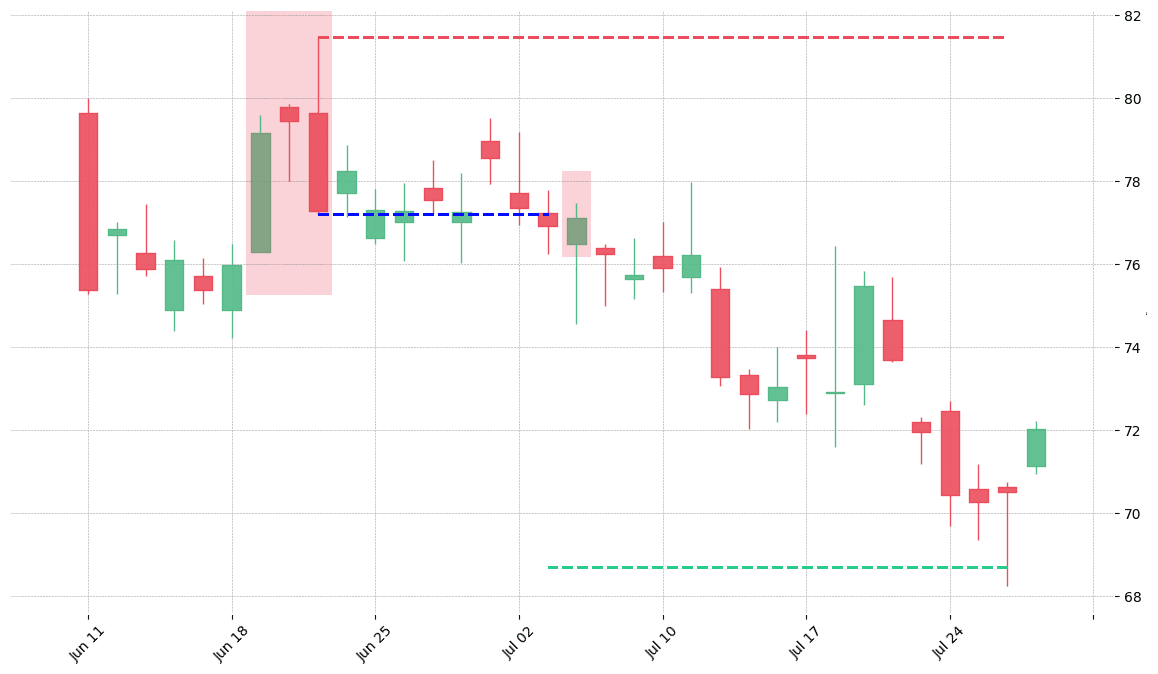
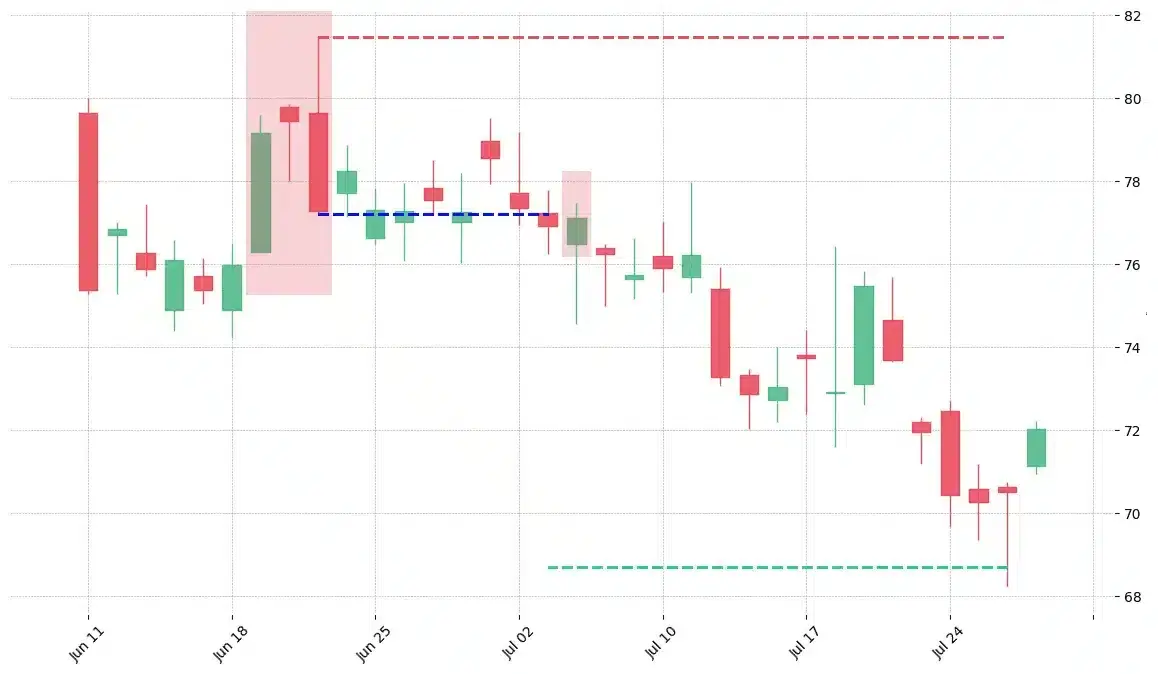
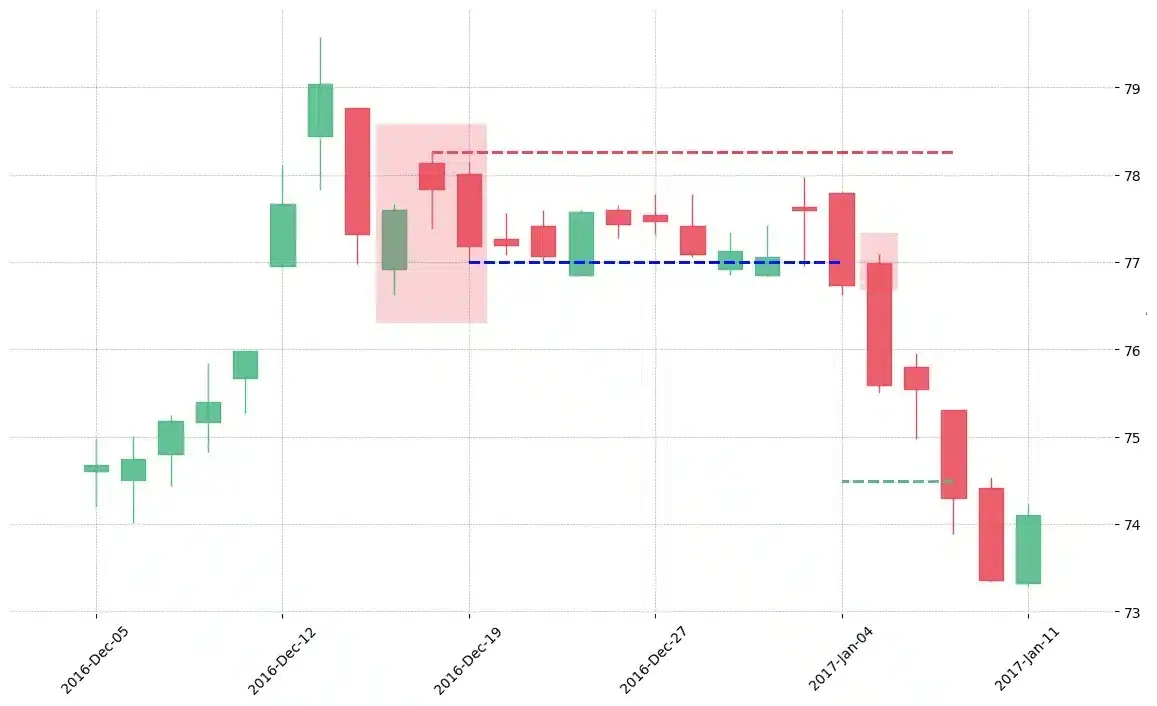
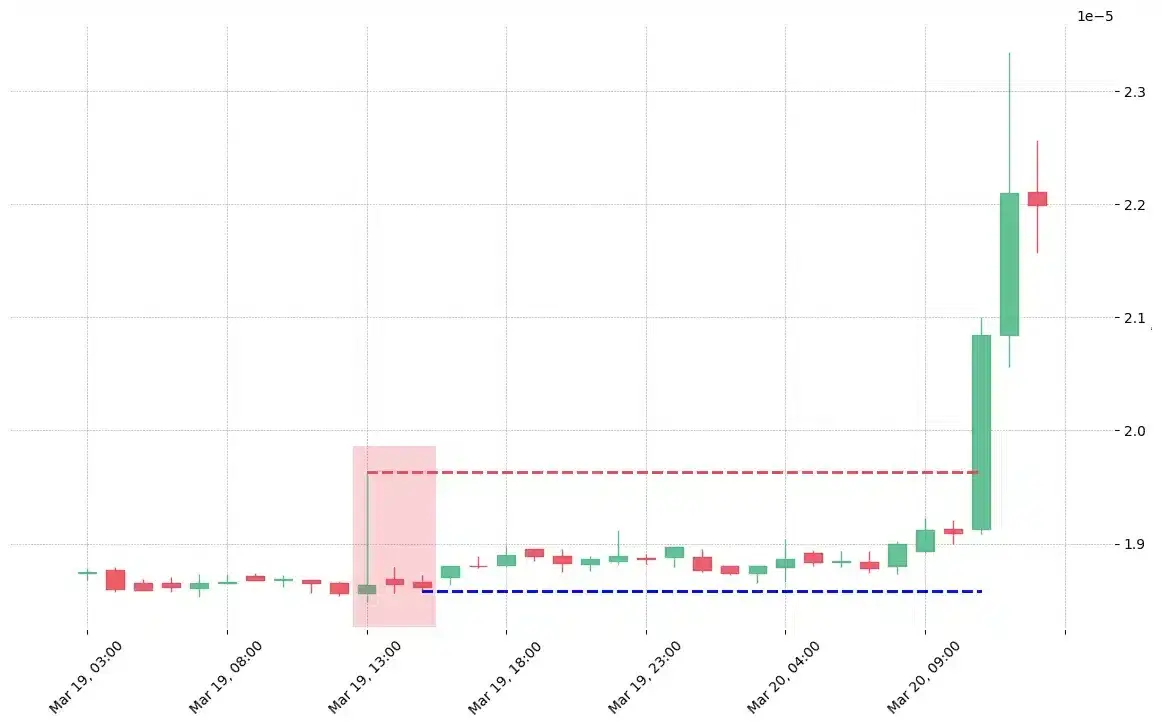
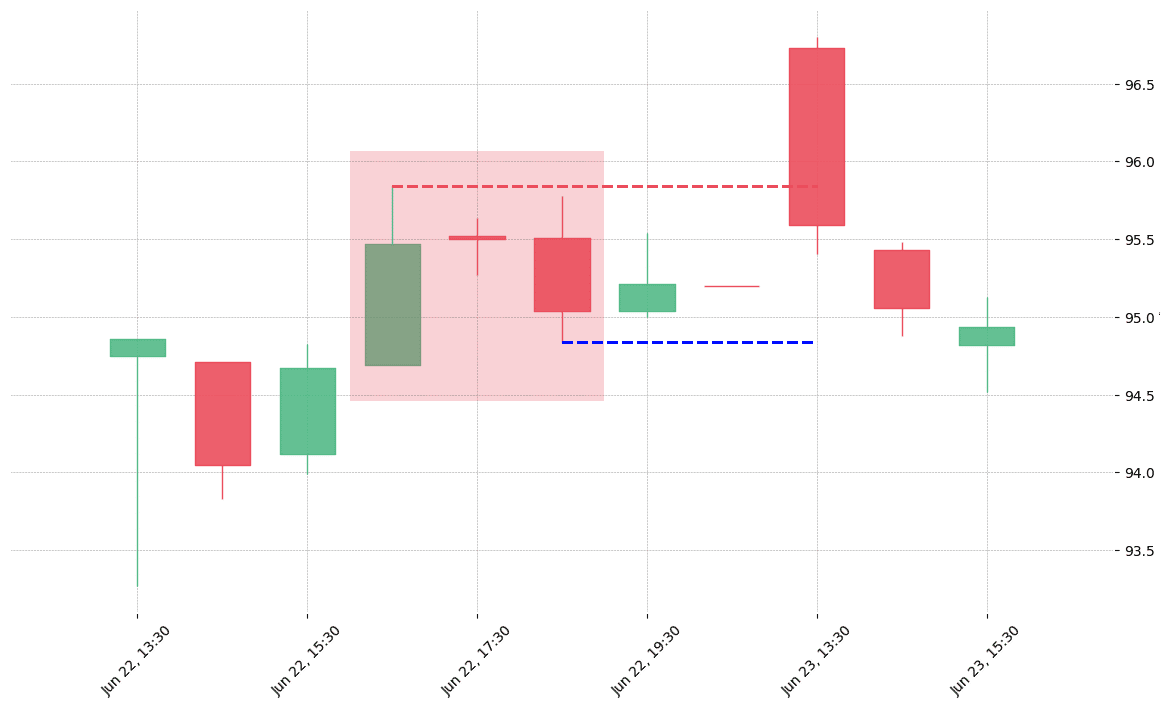
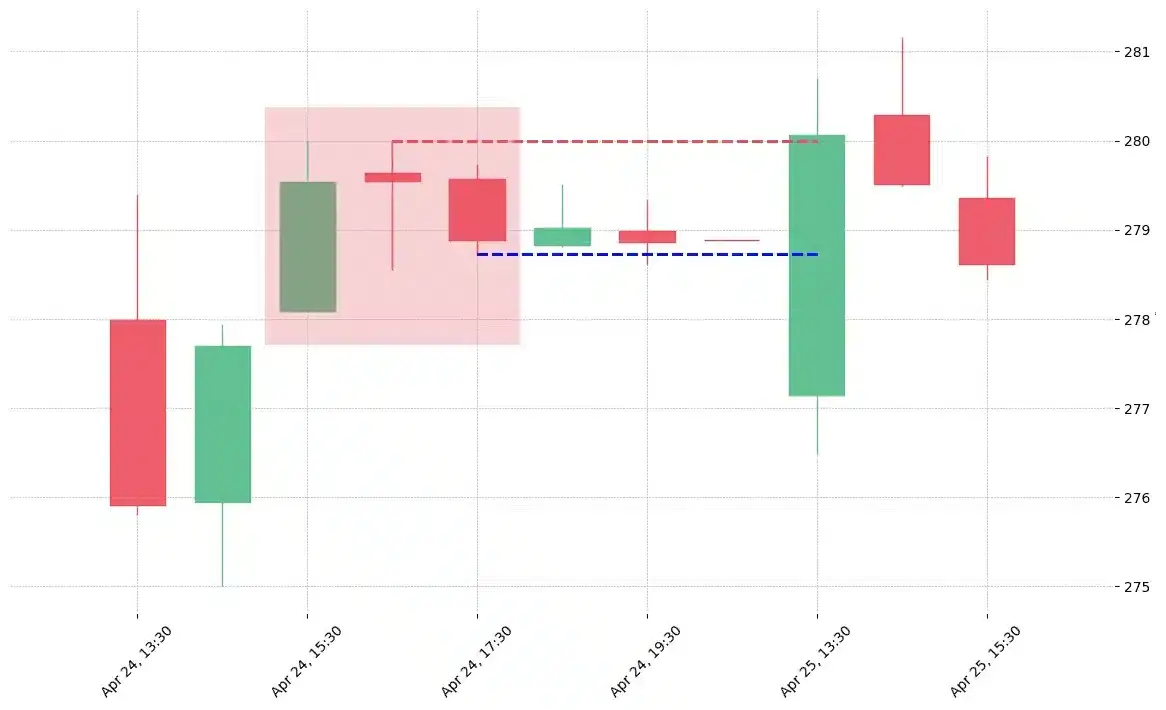
How does the Two Crows pattern look in real life?

The stock AES printed a bearish Two Crows on 2005-08-22. It confirmed on 2005-09-08 (meaning price closed below entry level). It retested the trade entry level on 2005-09-09. Then it failed to reach the 2:1 R/R target and got stopped on 2005-09-28.
The stock CLX printed a bearish Two Crows on 1996-08-19. It confirmed on 1996-08-30 (meaning price closed below entry level). It retested the trade entry level on 1996-09-05. Then it failed to reach the 2:1 R/R target and got stopped on 1996-09-11.
The stock L printed a bearish Two Crows on 2005-11-17. It confirmed on 2005-11-30 (meaning price closed below entry level). It retested the trade entry level on 2005-12-01. Then it failed to reach the 2:1 R/R target and got stopped on 2006-01-06.
The stock L printed a bearish Two Crows on 2020-06-15. It confirmed on 2020-06-26 (meaning price closed below entry level). It retested the trade entry level on 2020-06-29. Then it failed to reach the 2:1 R/R target and got stopped on 2020-07-14.
The stock RCL printed a bearish Two Crows on 2009-02-06. It confirmed on 2009-02-17 (meaning price closed below entry level). It retested the trade entry level on 2009-02-24. Then it failed to reach the 2:1 R/R target and got stopped on 2009-03-12.
The stock ROL printed a bearish Two Crows on 2008-08-14. It confirmed on 2008-09-04 (meaning price closed below entry level). It retested the trade entry level on 2008-09-08. Then it failed to reach the 2:1 R/R target and got stopped on 2008-09-18.
The stock USB printed a bearish Two Crows on 2017-07-24. It confirmed on 2017-08-11 (meaning price closed below entry level). It retested the trade entry level on 2017-08-14. Then it failed to reach the 2:1 R/R target and got stopped on 2017-09-21.
The stock ORLY printed a bearish Two Crows on 2002-03-07. It confirmed on 2002-04-01 (meaning price closed below entry level). It retested the trade entry level on 2002-04-25. Then it successfully reached the 2:1 R/R target.
The cryptocurrency pair BTC/USDT printed a bearish Two Crows on 2018-10-21 01:00:00. It confirmed on 2018-10-21 22:00:00 (meaning price closed below entry level). It retested the trade entry level on 2018-10-22 02:00:00. Then it successfully reached the 2:1 R/R target.
The stock K printed a bearish Two Crows on 2000-05-23. It confirmed on 2000-06-09 (meaning price closed below entry level). It retested the trade entry level on 2000-06-12. Then it successfully reached the 2:1 R/R target.
The stock TXT printed a bearish Two Crows on 1994-08-29. It confirmed on 1994-09-12 (meaning price closed below entry level). It retested the trade entry level on 1994-09-14. Then it successfully reached the 2:1 R/R target.
The stock WYNN printed a bearish Two Crows on 2012-06-19. It confirmed on 2012-07-03 (meaning price closed below entry level). It retested the trade entry level on 2012-07-05. Then it successfully reached the 2:1 R/R target.
The stock XOM printed a bearish Two Crows on 2016-12-15. It confirmed on 2017-01-04 (meaning price closed below entry level). It retested the trade entry level on 2017-01-05. Then it successfully reached the 2:1 R/R target.
The cryptocurrency pair GNT/BTC printed a bearish Two Crows on 2019-03-19 13:00:00. Unfortunately it invalidated on 2019-03-20 11:00:00 before the trade could trigger (it triggered the stop before entering).
The stock DOV printed a bearish Two Crows on 2020-06-22 16:30:00. Unfortunately it invalidated on 2020-06-23 13:30:00 before the trade could trigger (it triggered the stop before entering).
The stock TFX printed a bearish Two Crows on 2019-04-24 15:30:00. Unfortunately it invalidated on 2019-04-25 13:30:00 before the trade could trigger (it triggered the stop before entering).

Looking to learn more about this pattern?
You should take a look at Joe Marwood's online course. In his course, he backtested the 26 main candlestick patterns before to summarize which one is THE best pattern. I really liked his course and you shouldn't miss it!
Click here to signup to his "Candlestick Analysis For Professional Traders" course now!

Russell Crane

Russell Crane

Russell is an Algorithmic & Technical Analyst Trader @ PatternsWizard.
His passion is to share his knowledge about TA, patterns & more. Why hope for your trading to work when you can precisely know the performance stat of every pattern?

Are Candlestick Patterns Reliable

candlesticksWe loved Marwood Research’s course “Candlestick Analysis For Professional Traders“. Do you want to follow a great video course and deep dive into 26 candlestick patterns (and compare their success rates)? Then make sure to check this course!

Want to know which markets just printed a pattern?

Market Timeframe Printed on

Get “Every Candlestick Patterns Statistics”, The Last Trading Book You’ll Ever Need! 📖

PatternsWizard book - Every Candlestick Patterns Statistics

"Every Candlestick Patterns Statistics", the last trading book you'll ever need!

Pre-register now and receive the candlestick patterns statistics ultimate ebook for free before anyone else!

"All you need is one pattern to make a living."
- Linda Raschke

Awesome move! We are giving the last touch to the "Every Candlestick Patterns Statistics" book. We are very excited to send it to you right when it's ready. In the meantime, we'd like to gift you our trading roadmap and its best 55 resources. You'll shortly receive an email with the link. Don't miss it ;) Stay tuned 📈