Tri-star Candlestick Pattern: Complete Guide

Candlestick patterns

Tri-Star candlestick pattern
  • The tri-star candlestick pattern is a 3-bar trend reversal pattern.
  • There must be a clear and defined trend in the market. 
  • Three consecutive Doji candles must appear. 
  • The second Doji candle must create a gap below the first and third Doji candles creating a shape that resembles the letter “V” (or the opposite for the bearish variation).

Statistics to prove if the Tri-star pattern really works

Are the odds of the Tri Star pattern in your favor?


How does the Tri Star behave with a 2:1 target R/R ratio?

Success rate

From our research the Tri Star pattern confirms 83.2% of the time on average overall all the 4120 markets we analysed. Historically, this patterns confirmed within 1 candles or got invalidated within 4.7 candles. If confirmed, it reached the 2:1 R/R target 34.4% of the time and it retested it's entry price level 98% of the time.
Not accounting for fees, it has an expected outcome of 0.032 $/$. It means for every $100 you risk on a trade with the Tri Star pattern you make $3.2 on average.
Want to account for your trading fees? Have the detailled stats for your favorite markets / timeframes? Or get the stats for another R/R than 2:1?
🚀 Join us now and get fine-tuned stats you care about!

How to handle risk with the Tri Star pattern?


We analysed 4120 markets for the last 59 years and we found 28 504 occurrences of the Tri Star pattern.
On average markets printed 1 Tri Star pattern every 547 candles.

For 2:1 R/R trades, the longest winning streak observed was 9 and the longest losing streak was 36. A trading strategy relying solely on this pattern is not advised. Anyway, make sure to use proper risk management.

Stack the odds in my favor NOW!

Keep in mind all these informations are for educational purposes only and are NOT financial advice.

If you want to learn more and deep dive into candlestick patterns performance statistics, I strongly recommend you follow the best available course about it. Joe Marwood (who's a famous trader with more than 45 000 Twitter followers) created an online course called "Candlestick Analysis For Professional Traders" in his Marwood Research University. There he will take you through the extensive backtesting of the 26 main candlestick patterns. He then summarizes which one is THE best pattern. Do you know which one it is?
Remember, don't trade if you don't know your stats. Click here to signup to the course now!

The tri-star candlestick pattern is a three-bar trend reversal pattern. The tri-star pattern appears at the end of a very prolonged trend and is marked by three consecutive Doji candles. It is a very rare pattern to identify for successful trading especially when it appears near a support or resistance level. A horizontal price level or a key moving average may convey about the possible support or resistance level. 

There are two variants of the tri-star pattern, bullish tri-star and bearish tri-star.

Bullish tri-star candlestick pattern

The bullish tri-star candlestick pattern appears during a downtrend in the market and it predicts the upcoming reversal of the current downtrend in the market.

Bullish Tri-Star

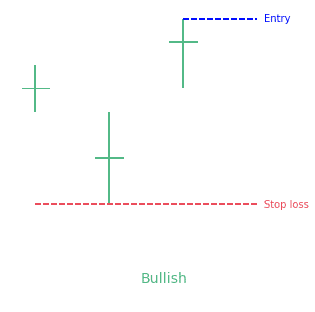
How to identify the bullish tri-star candlestick?

The bullish tri-star candlestick pattern consists of three Doji candlesticks. The Doji is a very simple candle that resembles a plus sign or a cross without a real body. The appearance of a single Doji candle is very infrequent and it indicates indecisiveness in the market. 

A pattern needs to meet the following conditions to be a bullish tri-star pattern. 

  • There must be a clear and defined downtrend in the market. 
  • Three consecutive Doji candles must appear. 
  • The second Doji candle must create a gap below the first and third Doji candles creating a shape that resembles the letter “V.”

What does the bullish pattern tell traders?

The bullish tri-star pattern predicts that the current downtrend will change soon into a bullish trend. The appearance of the first Doji during a strong downtrend indicates the indecisiveness of the market participants. That means that the power of bears is deteriorating. The appearance of the second Doji shows that bears have totally lost the downward momentum. Finally, the appearance of the last Doji blows the whistle to inform that the trend reversal is imminent because of the extreme indecisiveness of the bears.

The bearish tri-star candlestick pattern

The bearish tri-star candlestick pattern is a bearish reversal pattern that predicts the upcoming reversal of the current uptrend in the market. It is a rare pattern that traders should not ignore. 

Bearish Tri-Star

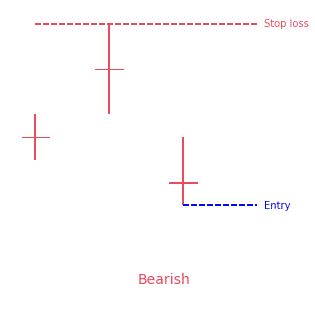
How to identify the bearish tri-star candlestick?

The bearish tri-star candlestick pattern consists of three Doji candles. It has the following characteristics that can help to identify the pattern. 

  • There must be an uptrend in the market for the bearish tri-star to appear. 
  • Three consecutive Doji candles must appear. 
  • The second Doji candle must create a gap above the first and the second candle. 

What does the bearish pattern tell traders?

The bearish tri-star candlestick pattern predicts that the bearish reversal of the current uptrend in the market is imminent. The appearance of the first Doji indicates the indecisiveness of the bulls in the market. Its appearance is a concern for the bulls. The formation of the second Doji further confirms the situation that bulls are losing momentum. Finally, the third Doji appears to illustrate that the uptrend will reverse because of the extreme indecisiveness of the bulls in the market. 

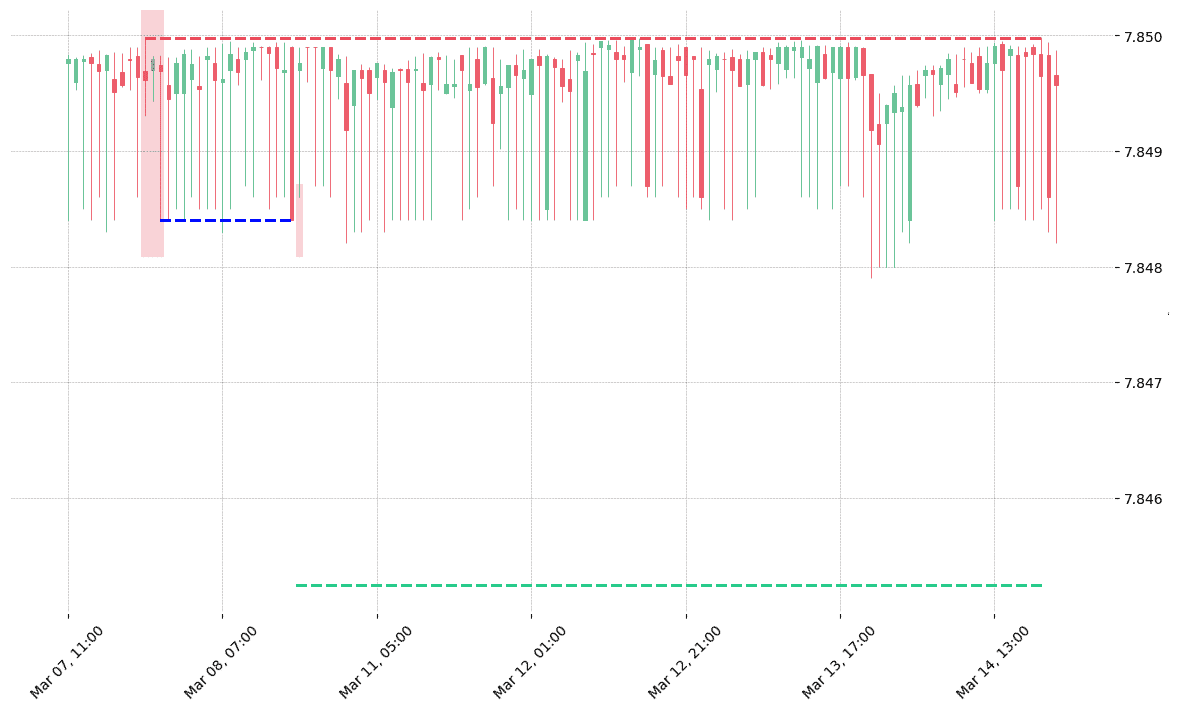
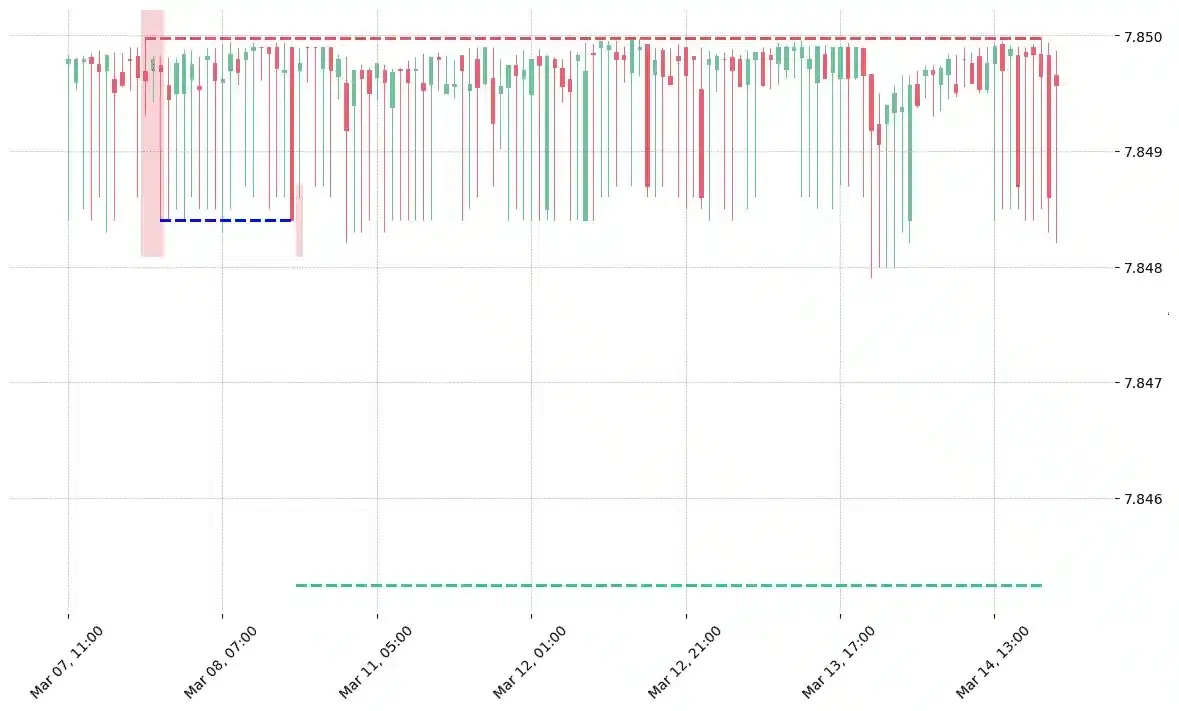
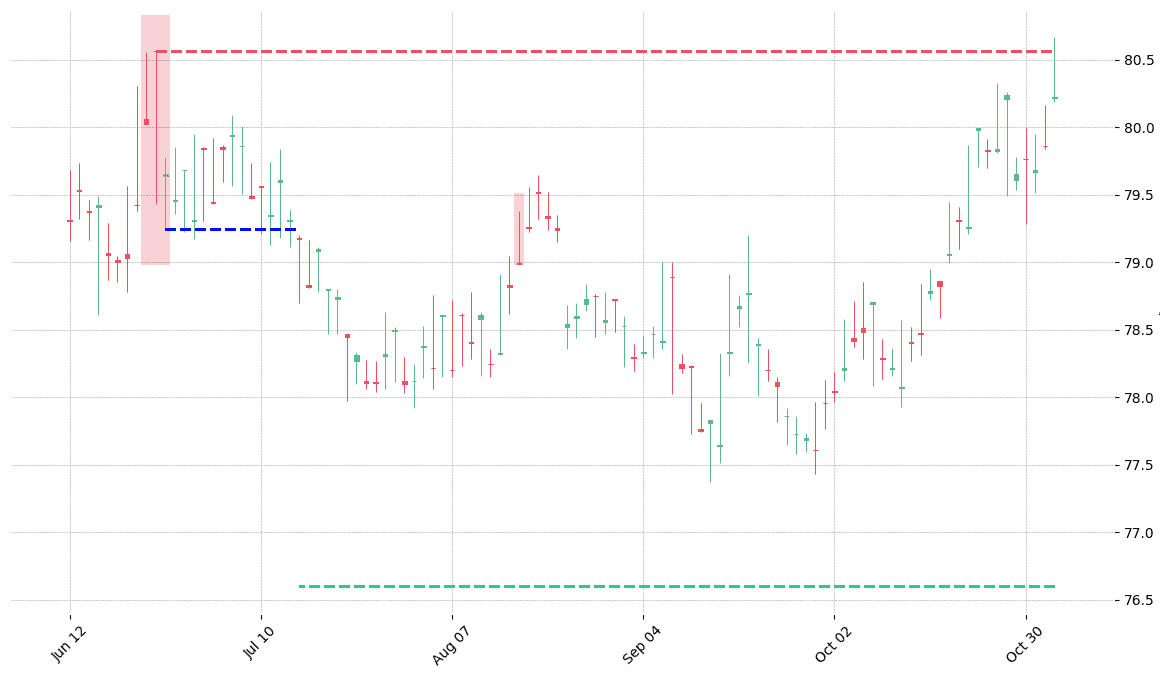
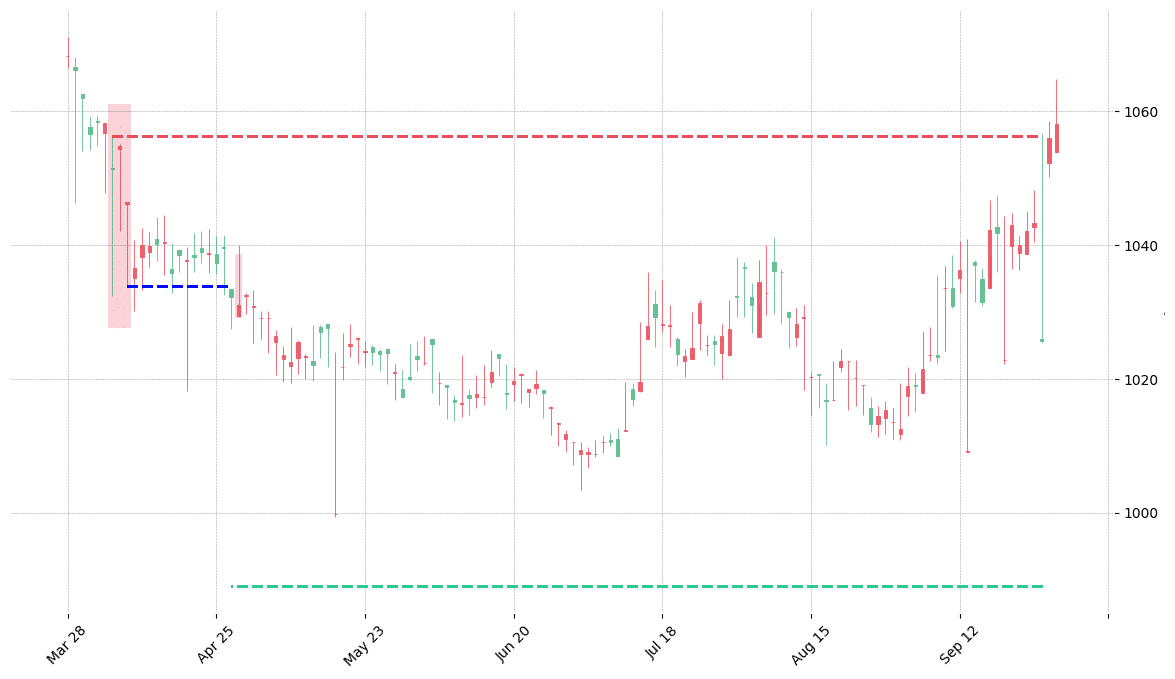
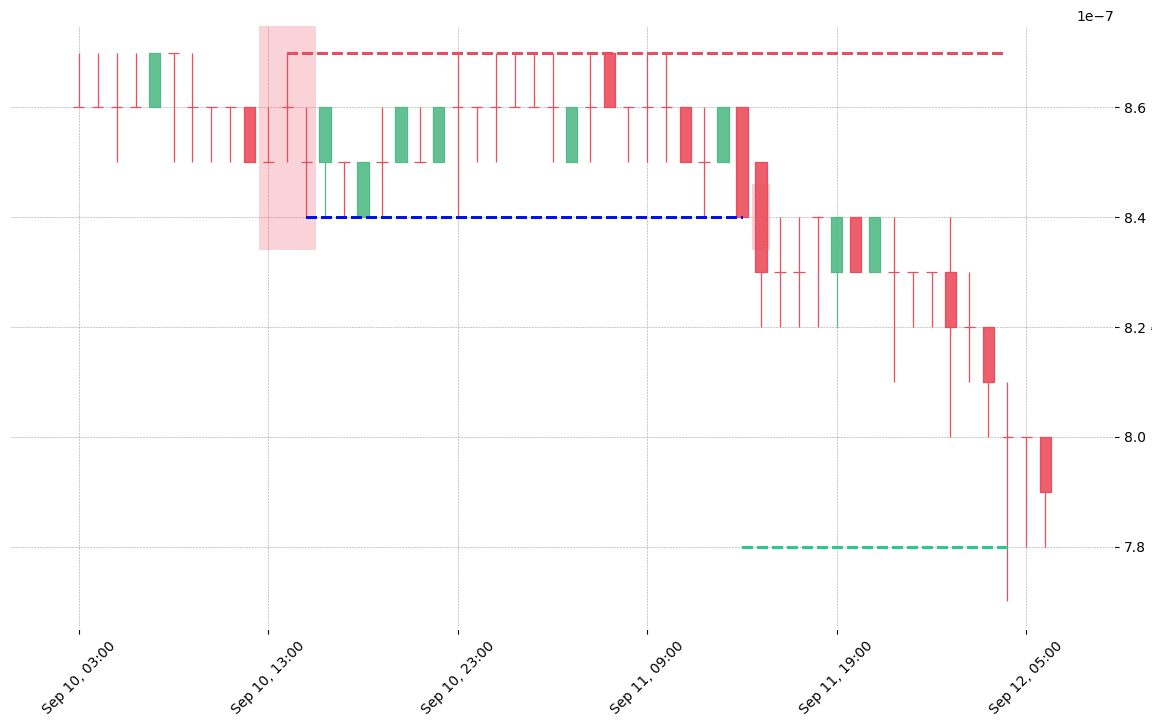
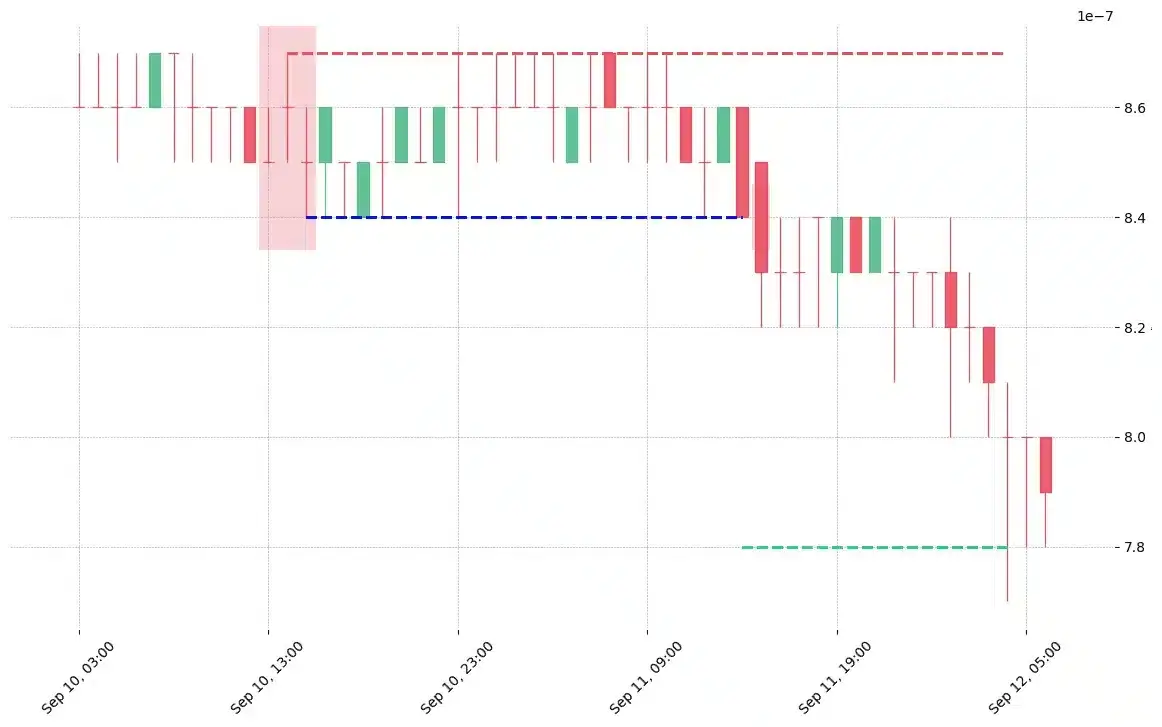
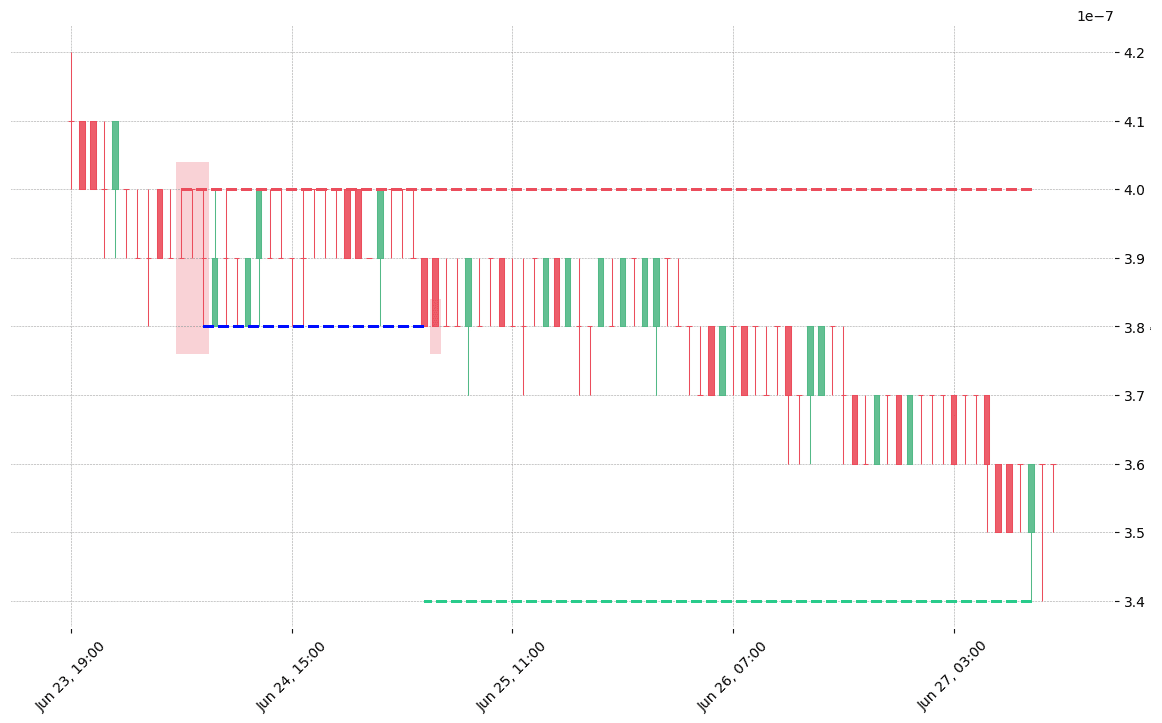
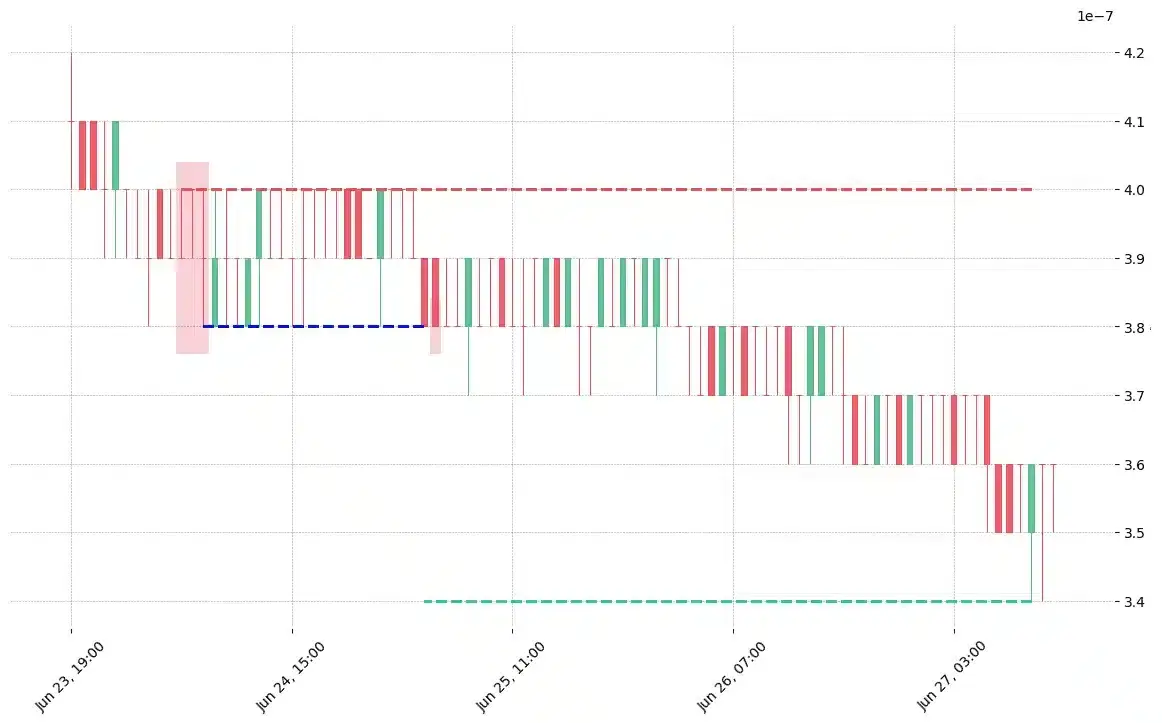
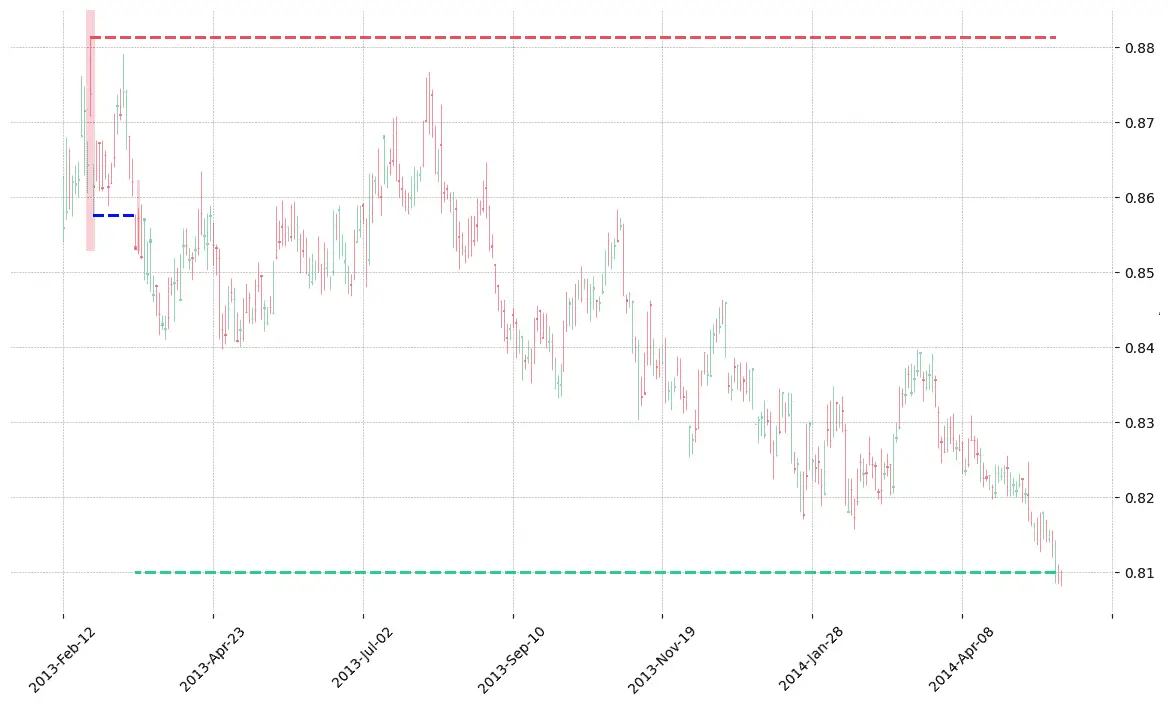
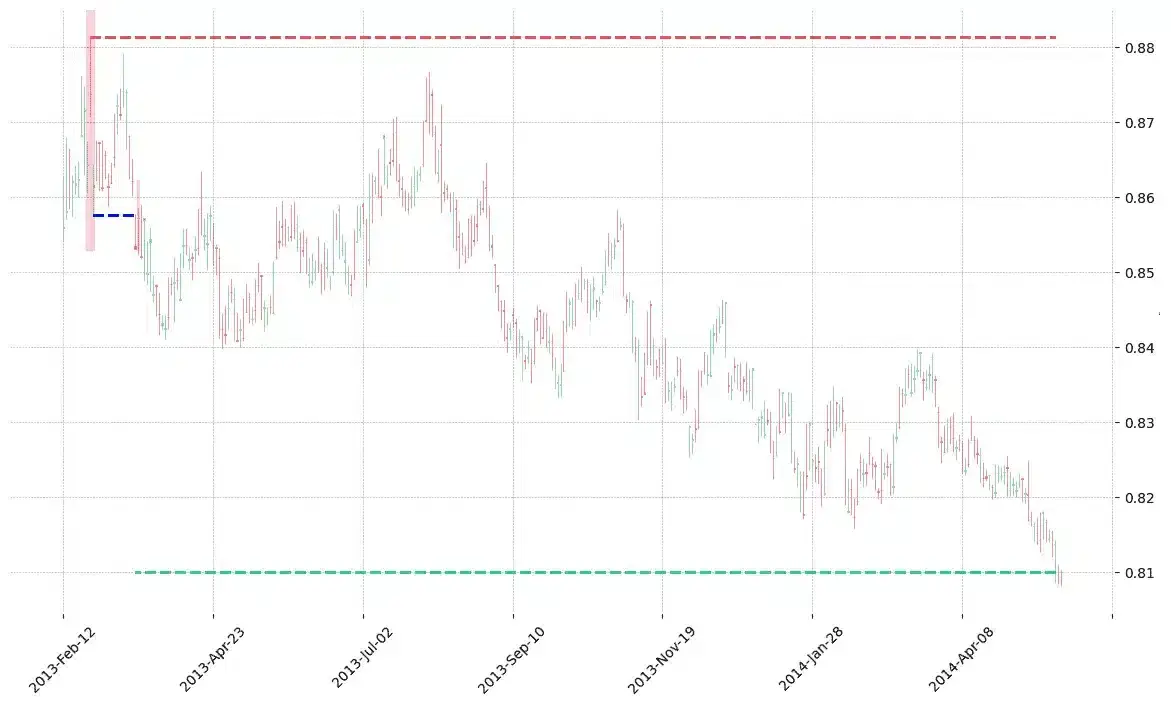
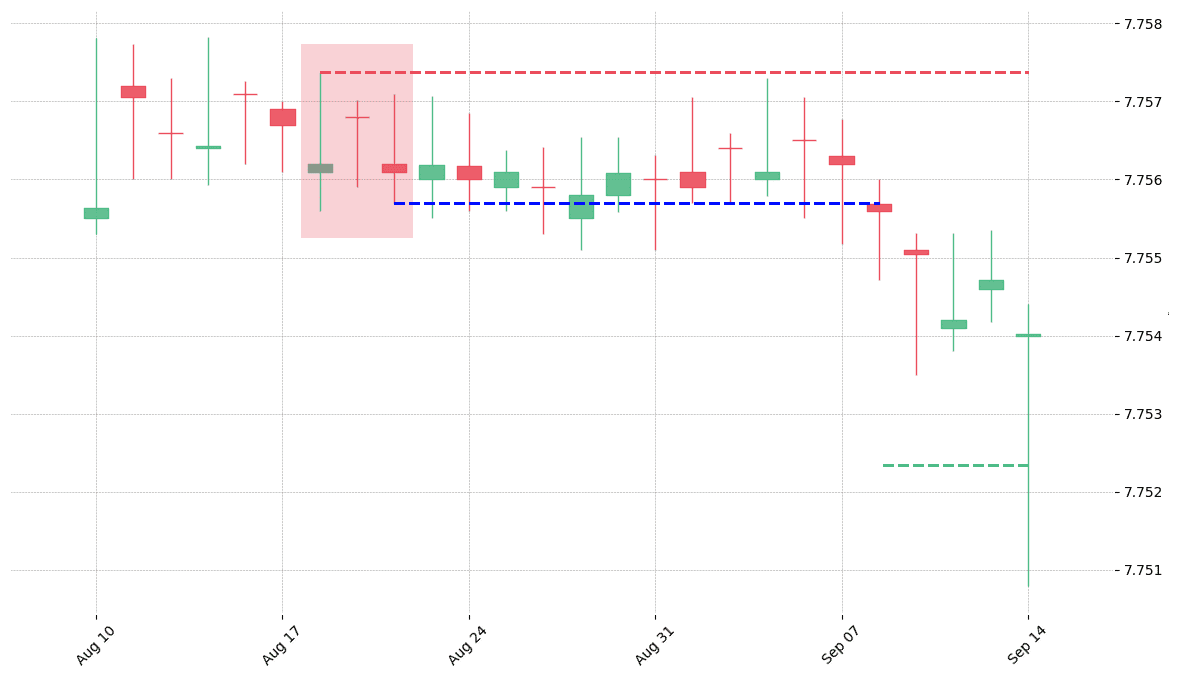
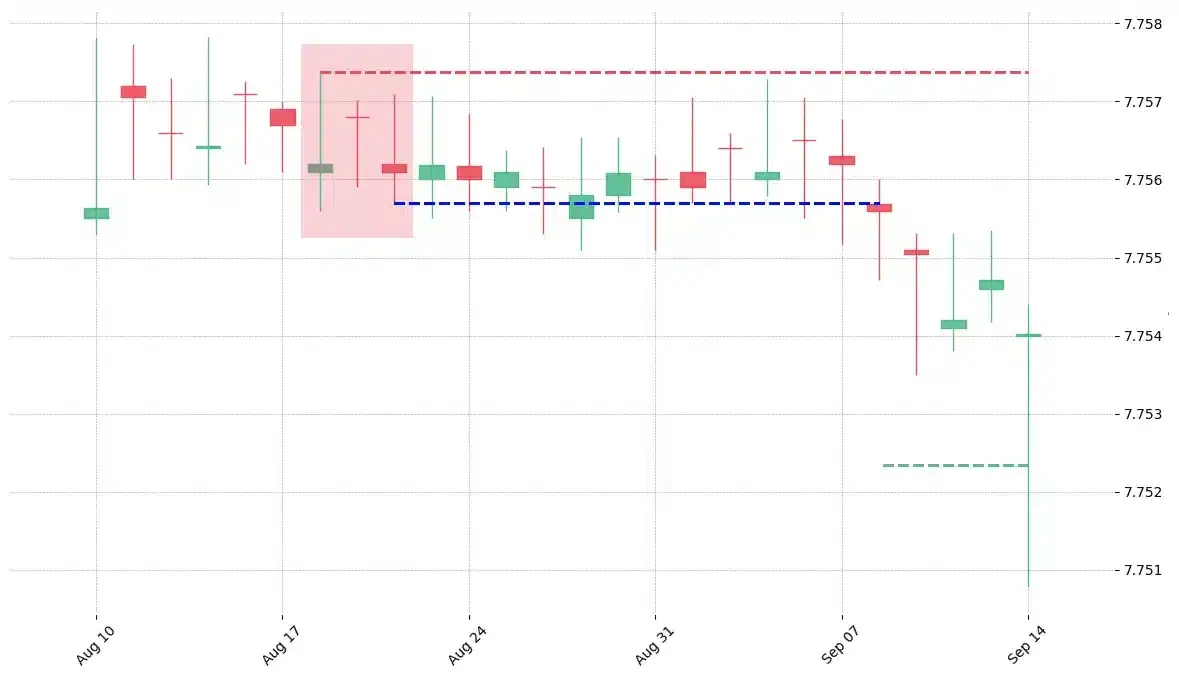
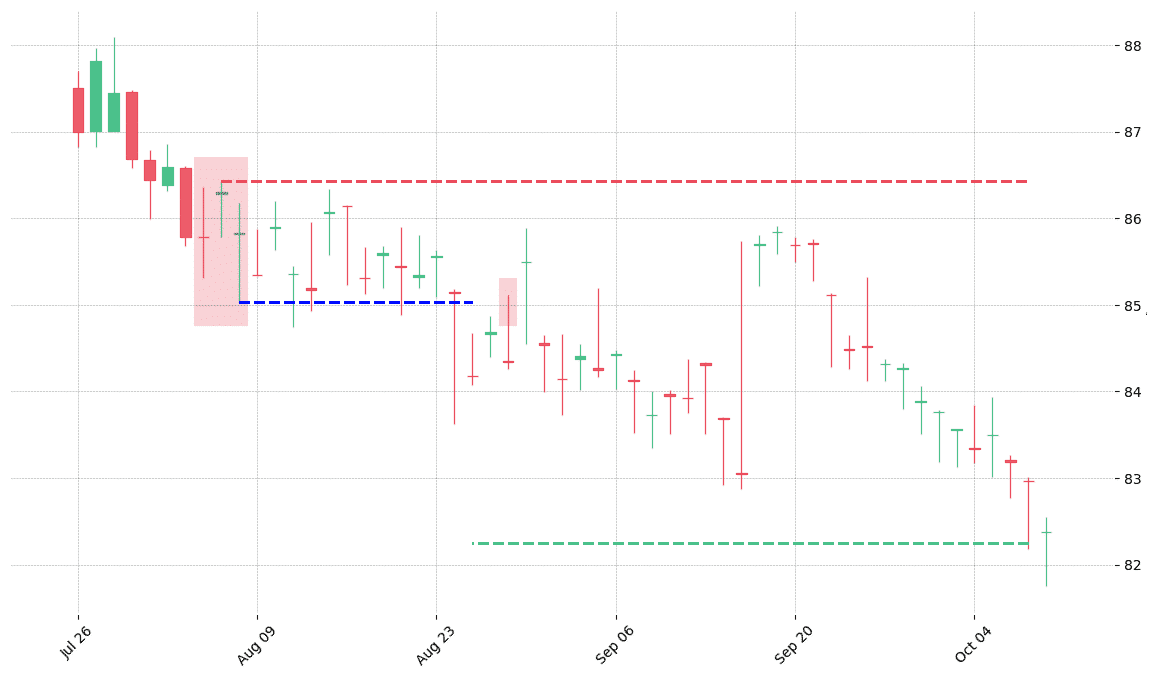
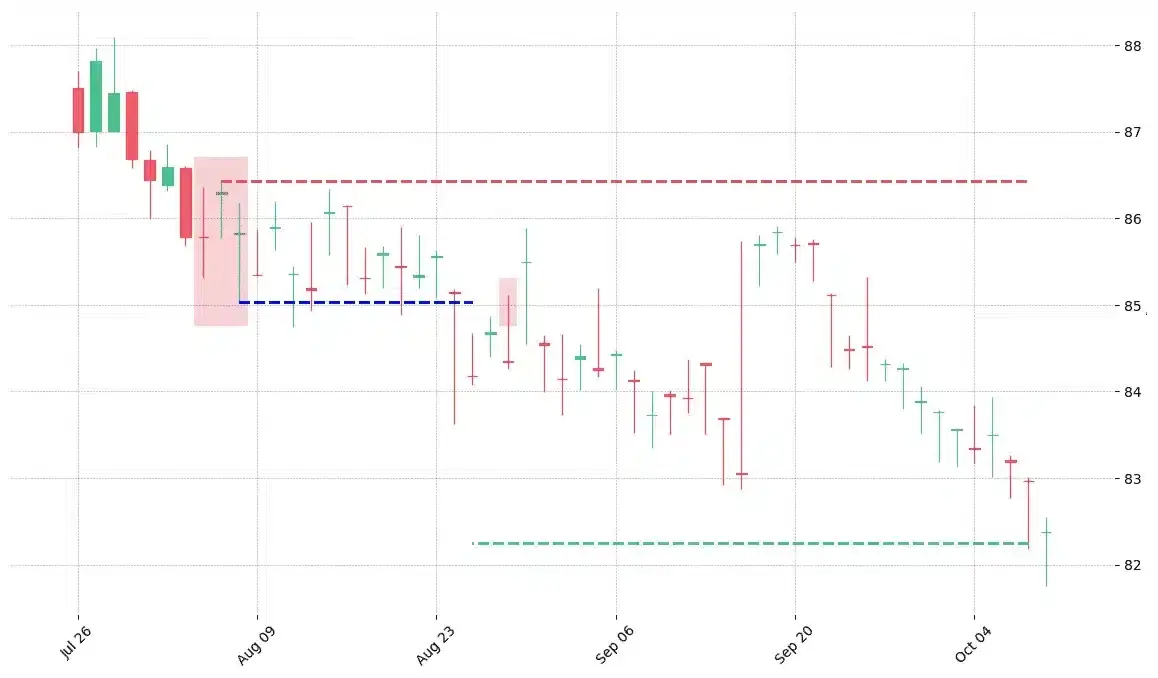
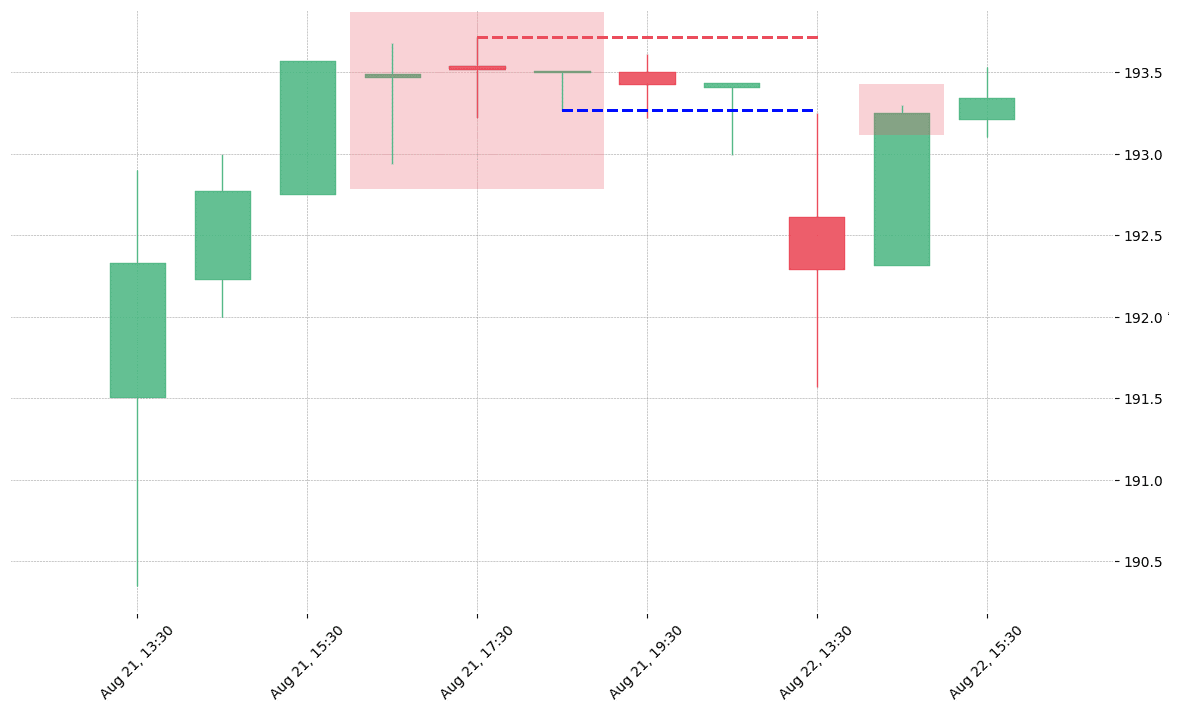
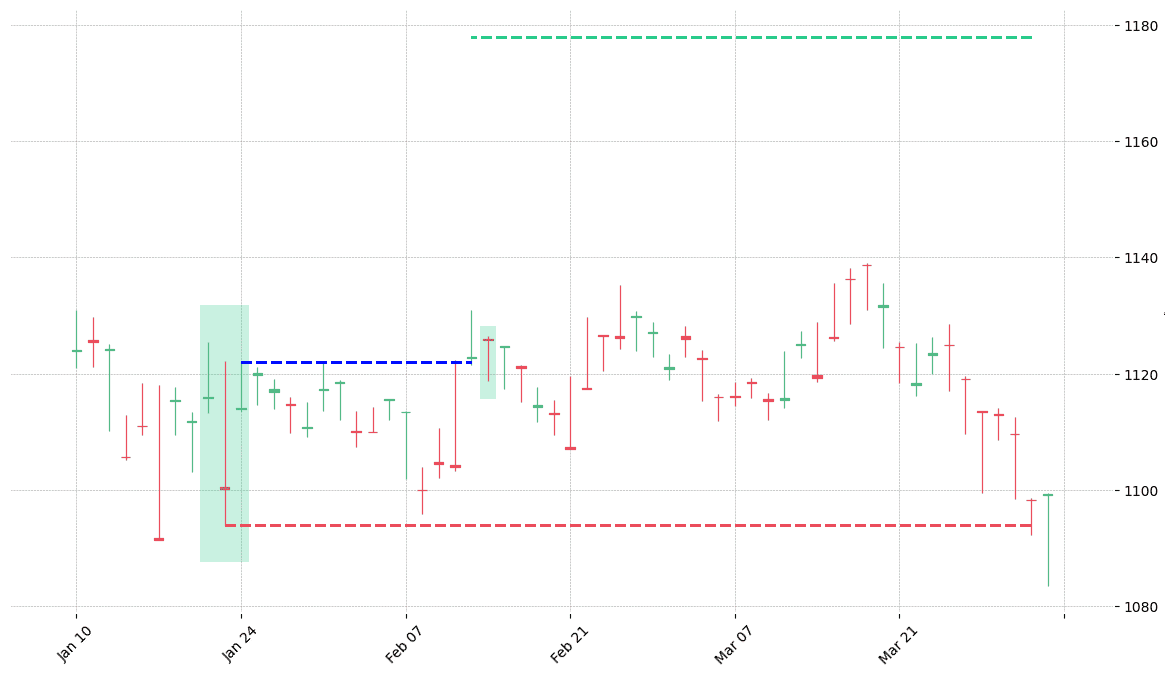
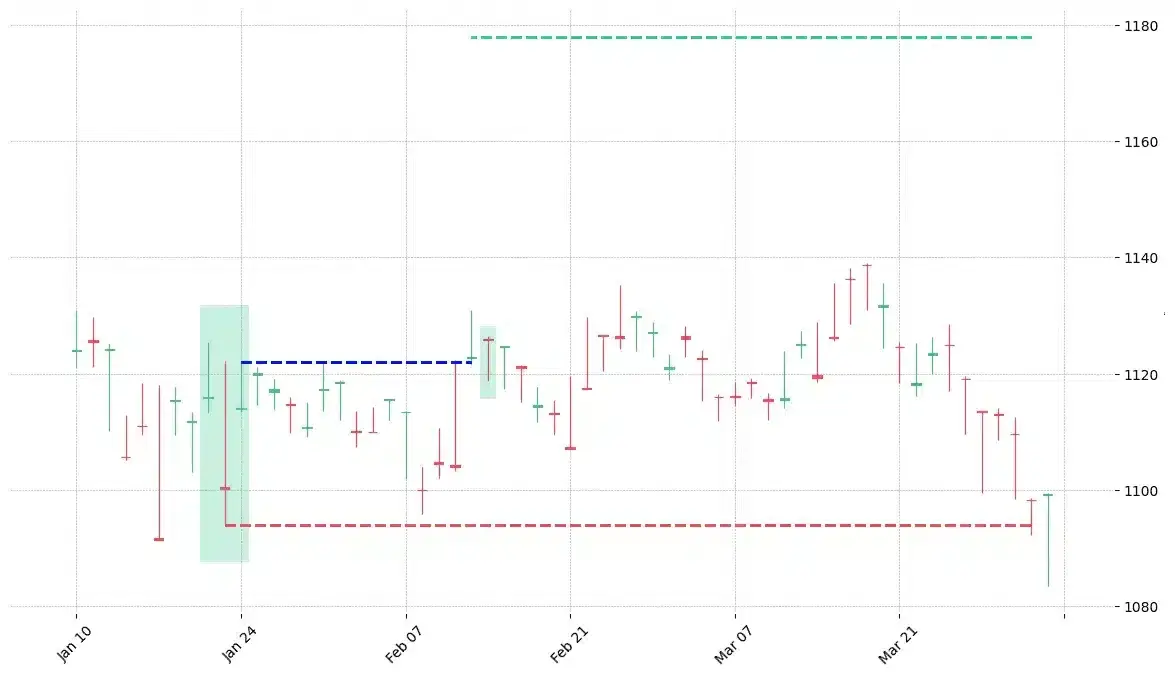
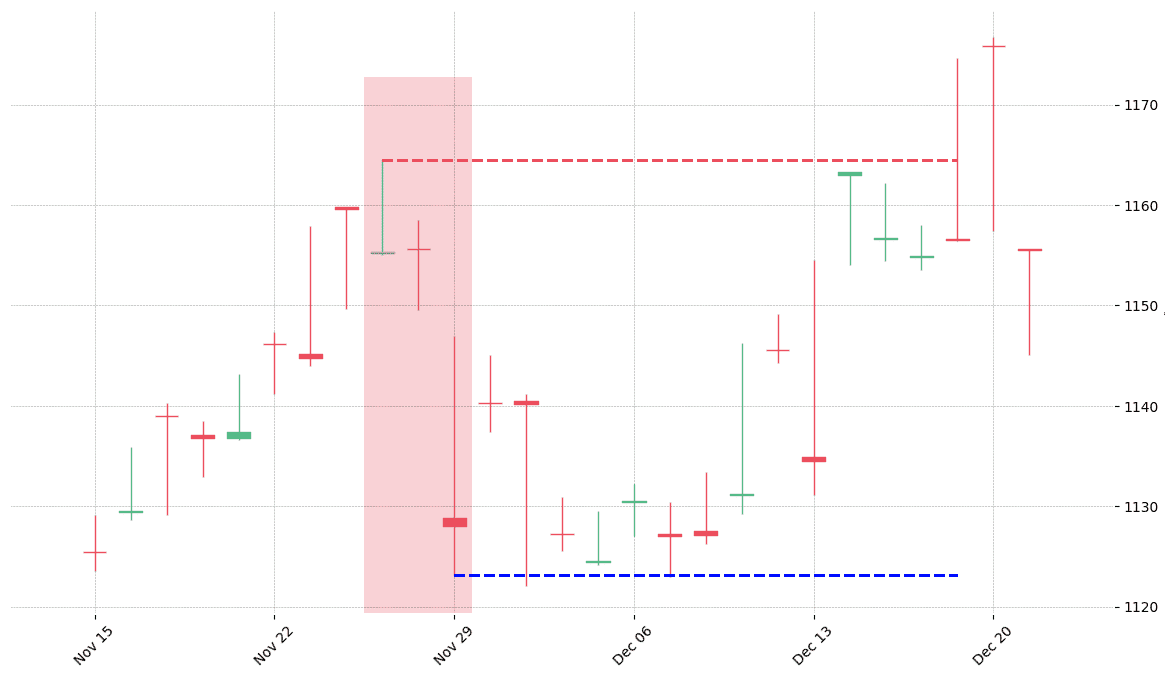
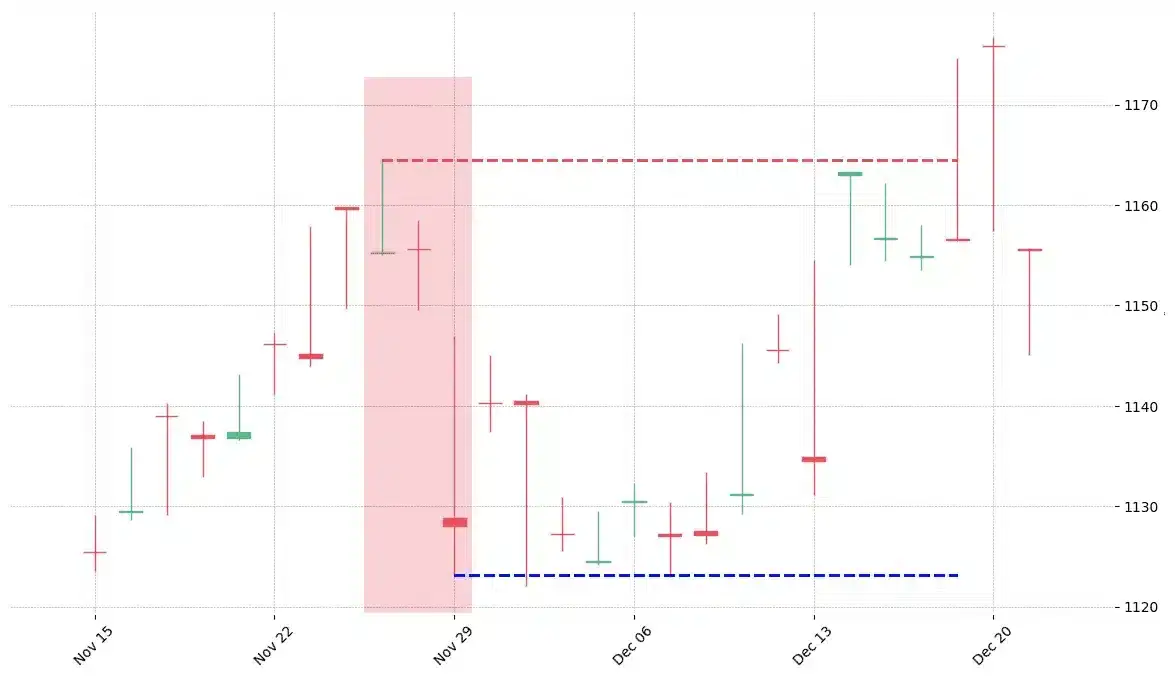
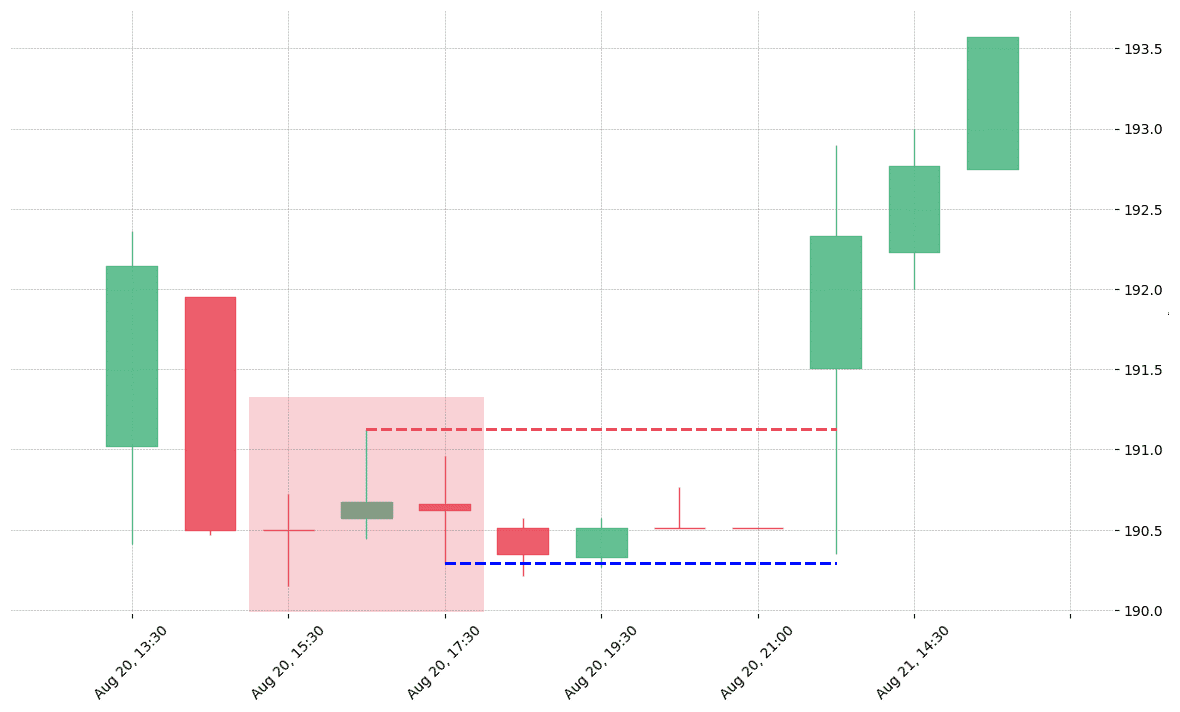
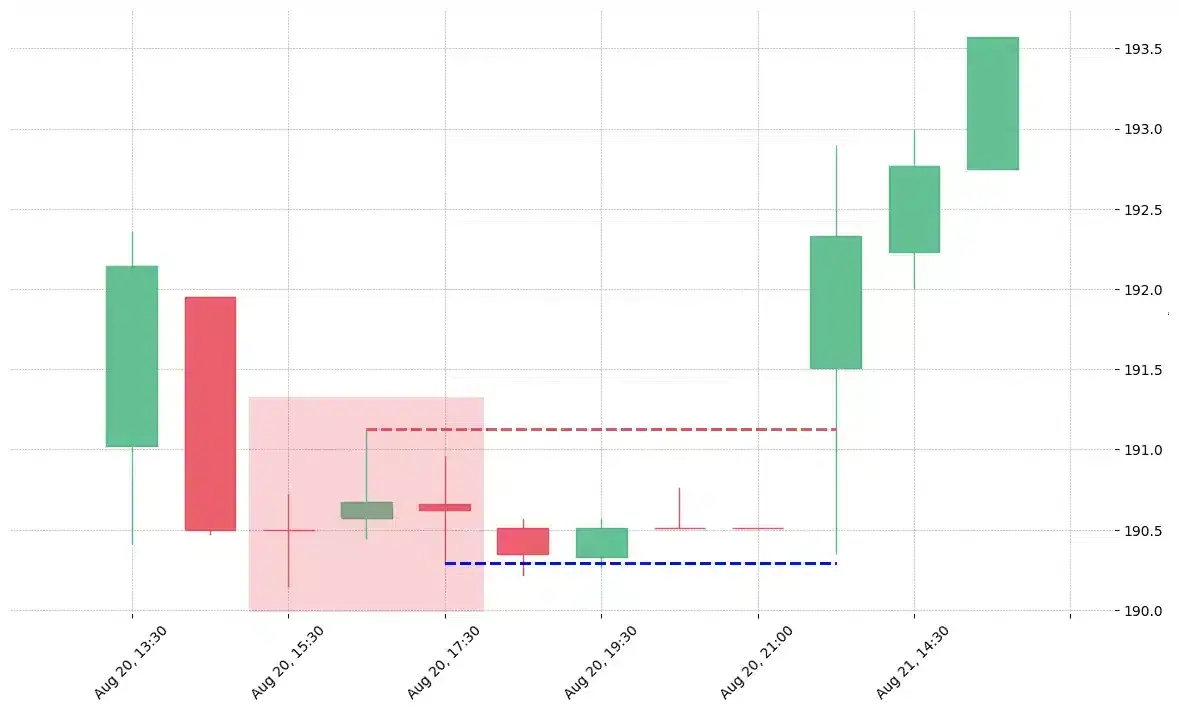
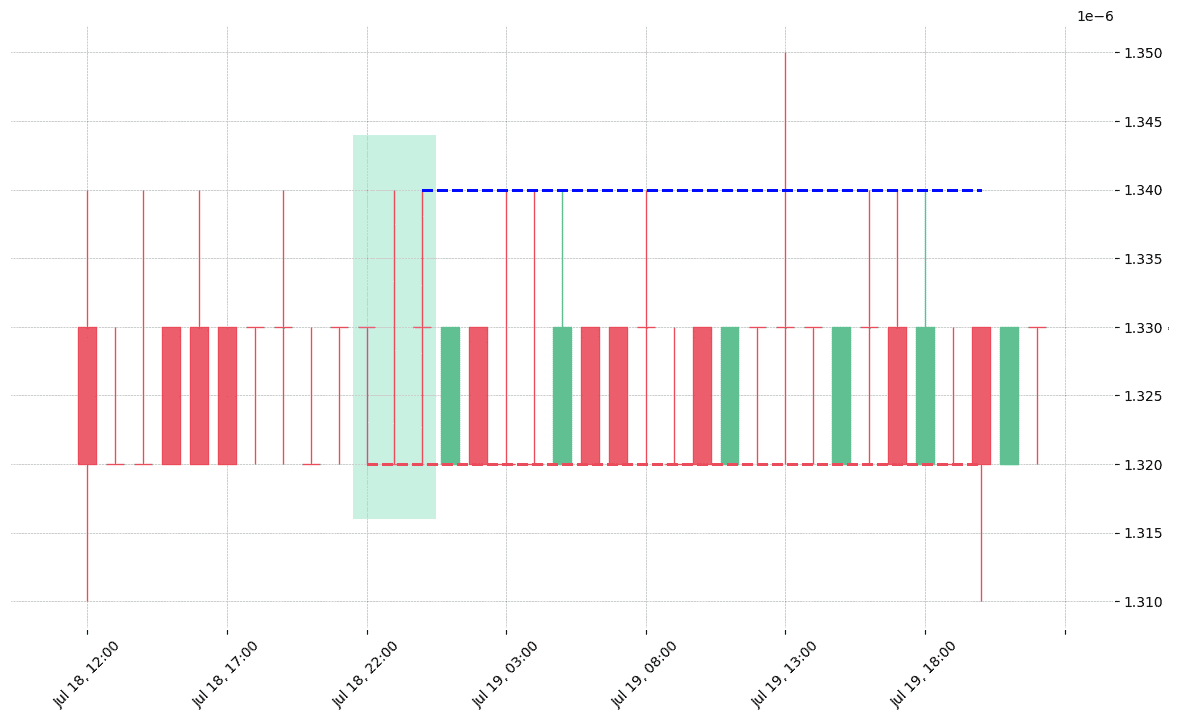
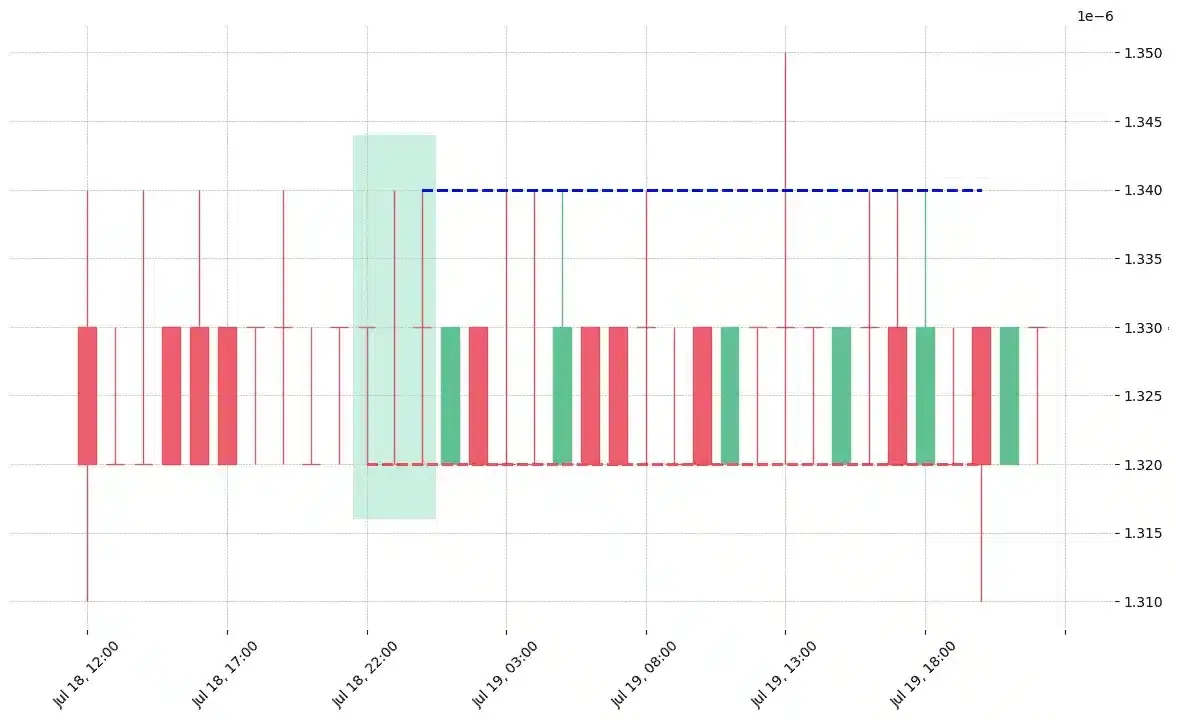
How does the Tri-Star pattern look in real life?

The currency pair HKD=X printed a bearish Tri Star on 2019-03-07 21:00:00. It confirmed on 2019-03-08 16:00:00 (meaning price closed below entry level). It retested the trade entry level on 2019-03-08 17:00:00. Then it failed to reach the 2:1 R/R target and got stopped on 2019-03-14 19:00:00.
The currency pair JPY=X printed a bearish Tri Star on 2012-06-22. It confirmed on 2012-07-16 (meaning price closed below entry level). It retested the trade entry level on 2012-08-16. Then it failed to reach the 2:1 R/R target and got stopped on 2012-11-02.
The currency pair KRW=X printed a bearish Tri Star on 2014-04-07. It confirmed on 2014-04-29 (meaning price closed below entry level). It retested the trade entry level on 2014-04-30. Then it failed to reach the 2:1 R/R target and got stopped on 2014-09-29.
The cryptocurrency pair SC/BTC printed a bearish Tri Star on 2018-09-10 13:00:00. It confirmed on 2018-09-11 14:00:00 (meaning price closed below entry level). It retested the trade entry level on 2018-09-11 15:00:00. Then it successfully reached the 2:1 R/R target.
The cryptocurrency pair TROY/BTC printed a bearish Tri Star on 2020-06-24 05:00:00. It confirmed on 2020-06-25 03:00:00 (meaning price closed below entry level). It retested the trade entry level on 2020-06-25 04:00:00. Then it successfully reached the 2:1 R/R target.
The currency pair EURGBP=X printed a bearish Tri Star on 2013-02-22. It confirmed on 2013-03-18 (meaning price closed below entry level). It retested the trade entry level on 2013-03-19. Then it successfully reached the 2:1 R/R target.
The currency pair HKD=X printed a bearish Tri Star on 2012-08-20. It confirmed on 2012-09-10 (meaning price closed below entry level). It retested the trade entry level on 2012-10-03. Then it successfully reached the 2:1 R/R target.
The currency pair JPY=X printed a bearish Tri Star on 2010-08-04. It confirmed on 2010-08-25 (meaning price closed below entry level). It retested the trade entry level on 2010-08-27. Then it successfully reached the 2:1 R/R target.
The stock MHK printed a bearish Tri Star on 2018-08-21 16:30:00. It confirmed on 2018-08-22 13:30:00 (meaning price closed below entry level). It retested the trade entry level on 2018-08-22 14:30:00. Then it successfully reached the 2:1 R/R target.
The currency pair KRW=X printed a bullish Tri Star on 2011-01-20. It confirmed on 2011-02-11 (meaning price closed above entry level). It retested the trade entry level on 2011-02-14. Then it failed to reach the 2:1 R/R target and got stopped on 2011-03-31.
The currency pair KRW=X printed a bearish Tri Star on 2011-11-25. Unfortunately it invalidated on 2011-12-19 before the trade could trigger (it triggered the stop before entering).
The stock MHK printed a bearish Tri Star on 2018-08-20 15:30:00. Unfortunately it invalidated on 2018-08-21 13:30:00 before the trade could trigger (it triggered the stop before entering).
The cryptocurrency pair QKC/BTC printed a bullish Tri Star on 2019-07-18 22:00:00. Unfortunately it invalidated on 2019-07-19 20:00:00 before the trade could trigger (it triggered the stop before entering).

Looking to learn more about this pattern?
You should take a look at Joe Marwood's online course. In his course, he backtested the 26 main candlestick patterns before to summarize which one is THE best pattern. I really liked his course and you shouldn't miss it!
Click here to signup to his "Candlestick Analysis For Professional Traders" course now!

Russell Crane

Russell Crane

Russell is an Algorithmic & Technical Analyst Trader @ PatternsWizard.
His passion is to share his knowledge about TA, patterns & more. Why hope for your trading to work when you can precisely know the performance stat of every pattern?

Are Candlestick Patterns Reliable

candlesticksWe loved Marwood Research’s course “Candlestick Analysis For Professional Traders“. Do you want to follow a great video course and deep dive into 26 candlestick patterns (and compare their success rates)? Then make sure to check this course!

Want to know which markets just printed a pattern?

Market Timeframe Printed on

Get “Every Candlestick Patterns Statistics”, The Last Trading Book You’ll Ever Need! 📖

PatternsWizard book - Every Candlestick Patterns Statistics

"Every Candlestick Patterns Statistics", the last trading book you'll ever need!

Pre-register now and receive the candlestick patterns statistics ultimate ebook for free before anyone else!

"All you need is one pattern to make a living."
- Linda Raschke

Awesome move! We are giving the last touch to the "Every Candlestick Patterns Statistics" book. We are very excited to send it to you right when it's ready. In the meantime, we'd like to gift you our trading roadmap and its best 55 resources. You'll shortly receive an email with the link. Don't miss it ;) Stay tuned 📈