
 Good Trading requires the Best Charting Tool!
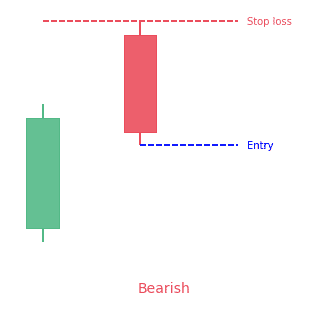
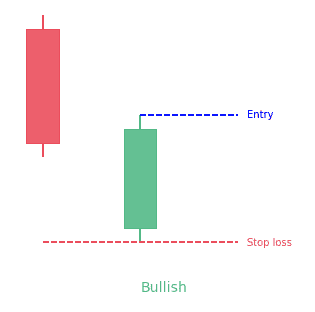
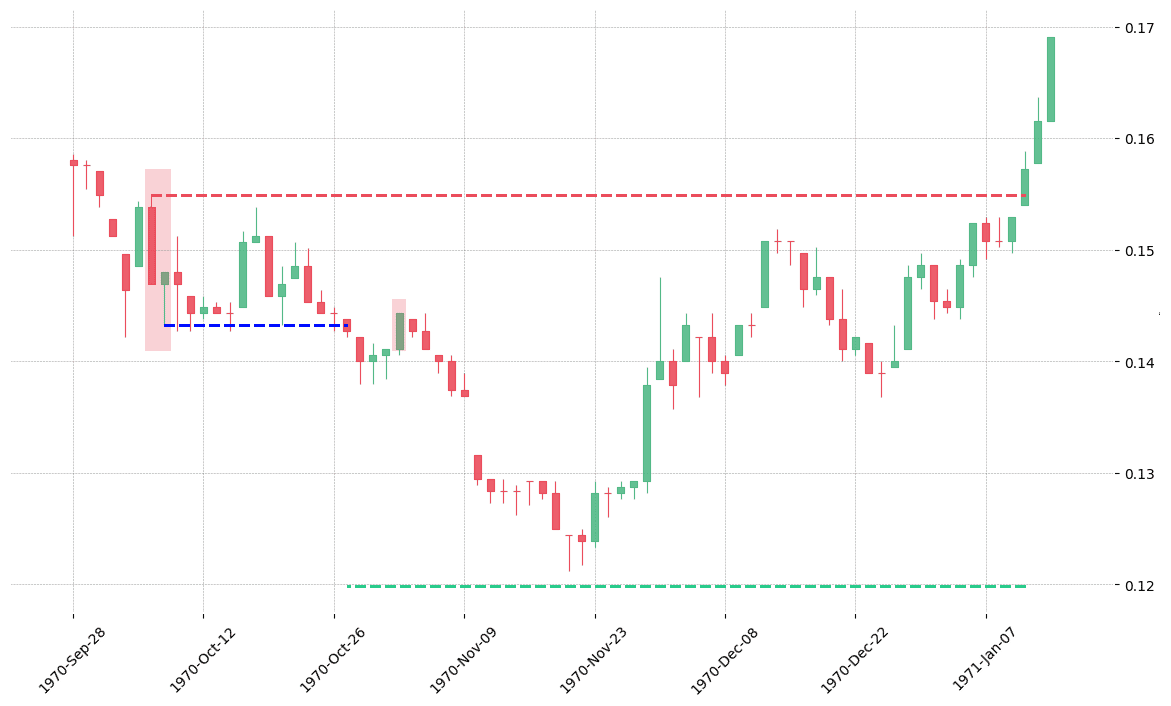
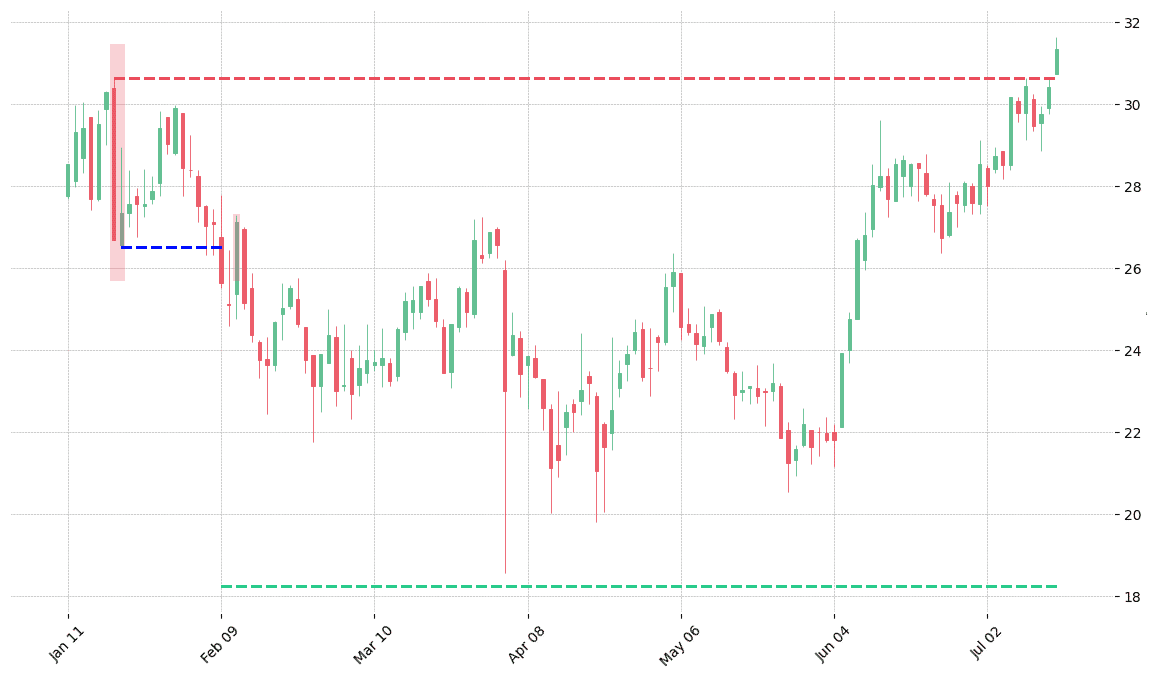
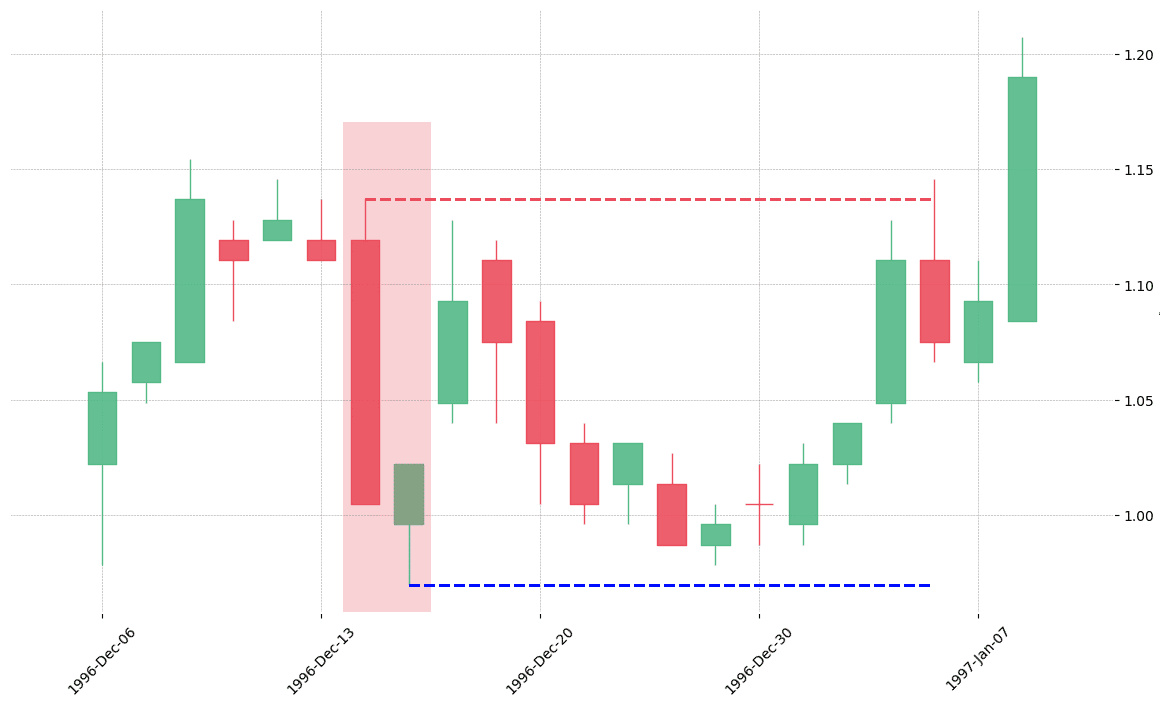
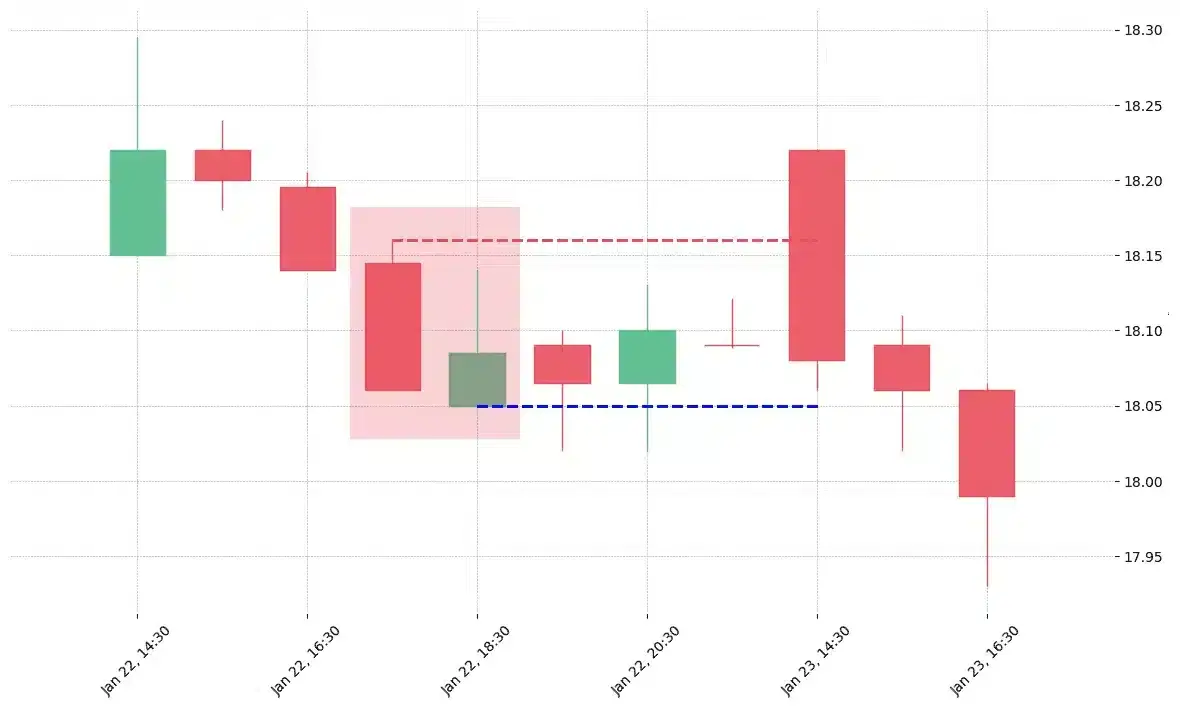
- The Thrusting candlestick pattern is a two-bar pattern.
- The second candle gaps up/down and then retrace to close within the 1st candle’s body.
Statistics to prove if the Thrusting pattern really works
Are the odds of the Thrusting pattern in your favor?
How does the Thrusting behave with a 2:1 target R/R ratio?
From our research the Thrusting pattern confirms 43.7% of the time on average overall all the 4120 markets we analysed. Historically, this patterns confirmed within 5.5 candles or got invalidated within 5.6 candles. If confirmed, it reached the 2:1 R/R target 35% of the time and it retested it's entry price level 97.2% of the time.
Not accounting for fees, it has an expected outcome of 0.051 $/$.
It means for every $100 you risk on a trade with the Thrusting pattern you make $5.1 on average.
Want to account for your trading fees? Have the detailled stats for your favorite markets / timeframes? Or get the stats for another R/R than 2:1?
🚀 Join us now and get fine-tuned stats you care about!
How to handle risk with the Thrusting pattern?
We analysed 4120 markets for the last 59 years and we found 23 016 occurrences of the Thrusting pattern.
On average markets printed 1 Thrusting pattern every 678 candles.
For 2:1 R/R trades, the longest winning streak observed was 10 and the longest losing streak was 24. A trading strategy relying solely on this pattern is not advised. Anyway, make sure to use proper risk management.
Keep in mind all these informations are for educational purposes only and are NOT financial advice.
If you want to learn more and deep dive into candlestick patterns performance statistics, I strongly recommend you follow the best available course about it. Joe Marwood (who's a famous trader with more than 45 000 Twitter followers) created an online course called "Candlestick Analysis For Professional Traders" in his Marwood Research University. There he will take you through the extensive backtesting of the 26 main candlestick patterns. He then summarizes which one is THE best pattern. Do you know which one it is?
Remember, don't trade if you don't know your stats. Click here to signup to the course now!
What is the Thrusting candlestick pattern?
The thrusting candlestick pattern is a two-bar pattern that appears during a downtrend. Normally it is considered as a bearish continuation pattern but testing has proved that it also acts as a bullish reversal pattern.
So, the overall performance of the thrusting pattern is quite random because it is very difficult to predict the direction of the breakout. Traders should look for confirmation before initiating a trade based on the thrusting pattern. The candle appearing after the pattern provides the confirmation. If the black candle follows the pattern, it will indicate the continuation of the downtrend.
On the other hand, a white candle suggests an upcoming reversal of the current bearish trend in the market. Therefore, the thrusting pattern should be used in combination with the other technical analysis tools for confirmation.
How to identify the Thrusting candlestick pattern?
The thrusting candlestick pattern is a two-bar pattern and it is easy to identify the pattern once it appears on the trading charts. A bearish thrusting continuation pattern only occurs during a strong downtrend indicated by several Japanese red candlesticks. A pattern must need to meet the following conditions to be a thrusting pattern.
- The first day’s candle must be a long black candle with a real body.
- The second day’s candle is a short white candle that opens below the low of the previous day.
- The second candle must also close in the body of the first candle without exceeding its midpoint.
What does the pattern tell traders?
The thrusting candlestick pattern conveys multiple pieces of information to the interested parties. It is generally considered a reliable pattern but only after the confirmation. During a strong downtrend, a long bearish candle appears that indicates the bearish sentiment in the market. It is generally a concern for the bulls who try to intervene in the proceedings to push the prices higher. As a result of the new buying pressure exerted by the bulls gives rise to the second candle that opens below the low of the previous day. However, the second candle fails to break out above the midpoint of the first candle. It suggests that bulls are not just strong enough to turn the tables and the current downtrend in the market is likely to continue.
The thrusting pattern also offers different trading plans to increase the odds of maximizing profits. When the candle appearing after the candle moves above the high of the first candle, it is a signal to enter a long position. If the prices move below the low of the second candle, it signals to enter a short trade. If the trend reverses after the thrusting pattern, traders should place stop-loss below the low of the pattern. The continuation of the downtrend suggests to place a stop-loss above the high of the thrusting candlestick pattern.
However, it is important to note that the thrusting candlestick pattern is a flip coin that depends on whether the prices will move higher or lower. Therefore, it must be used for trading or technical analysis with full care before acting upon the thrusting pattern.
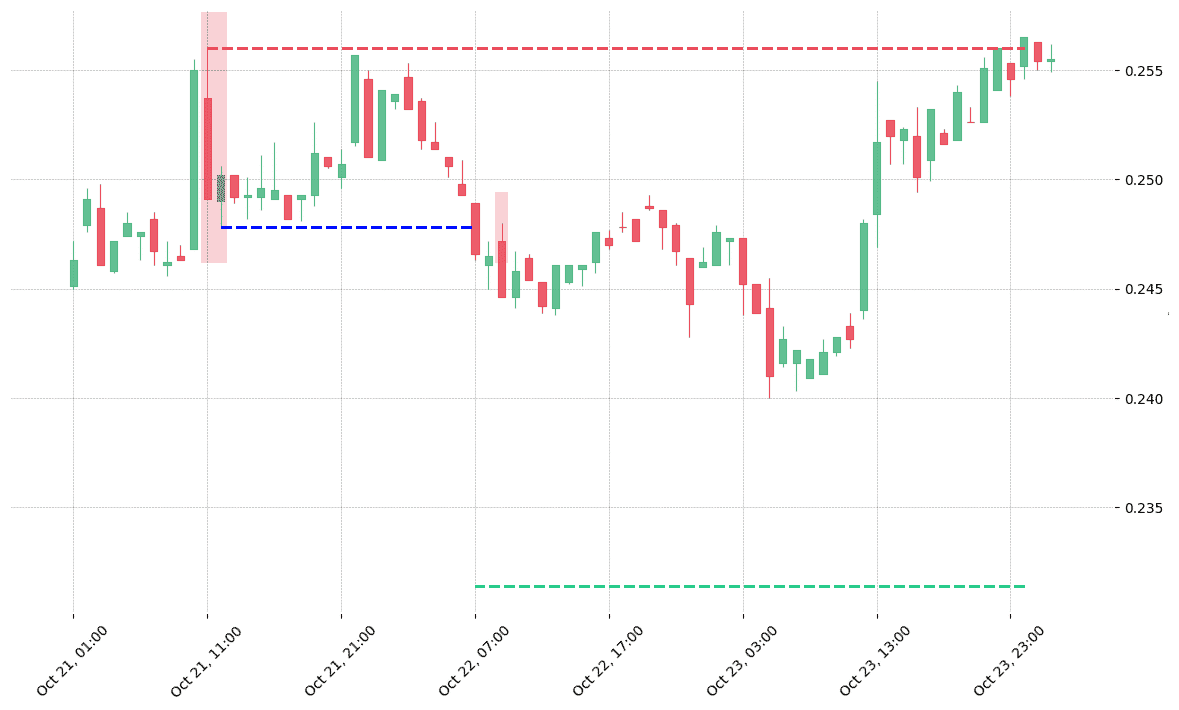
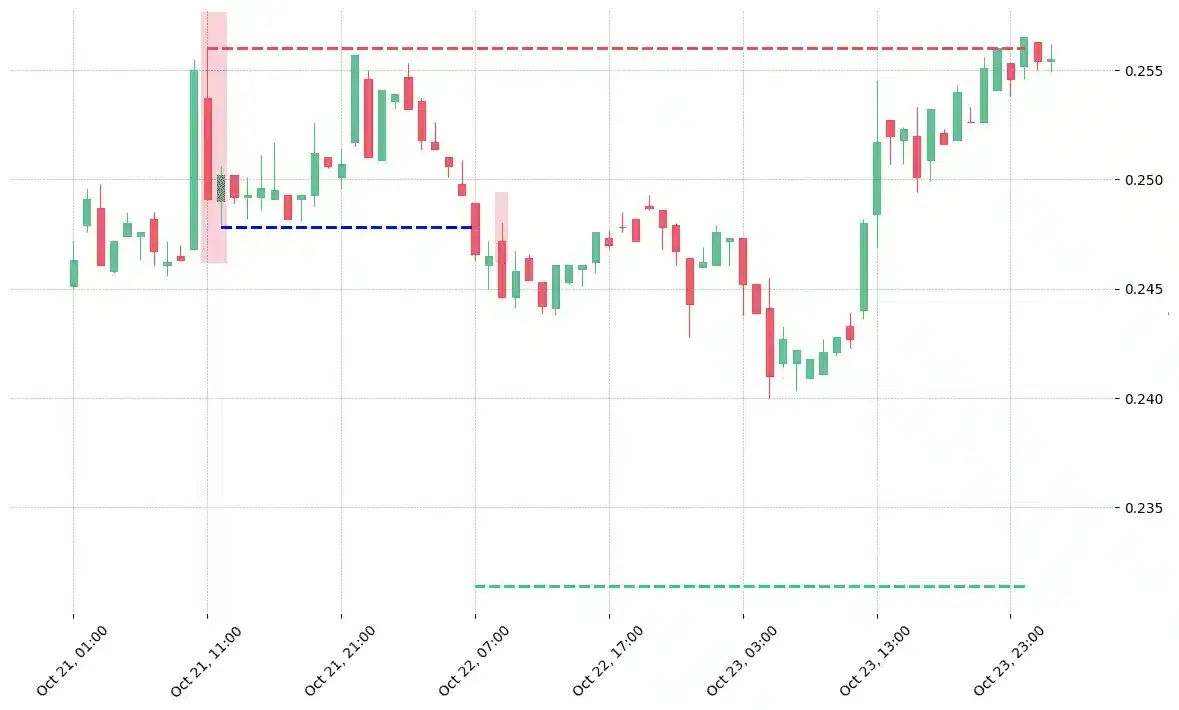
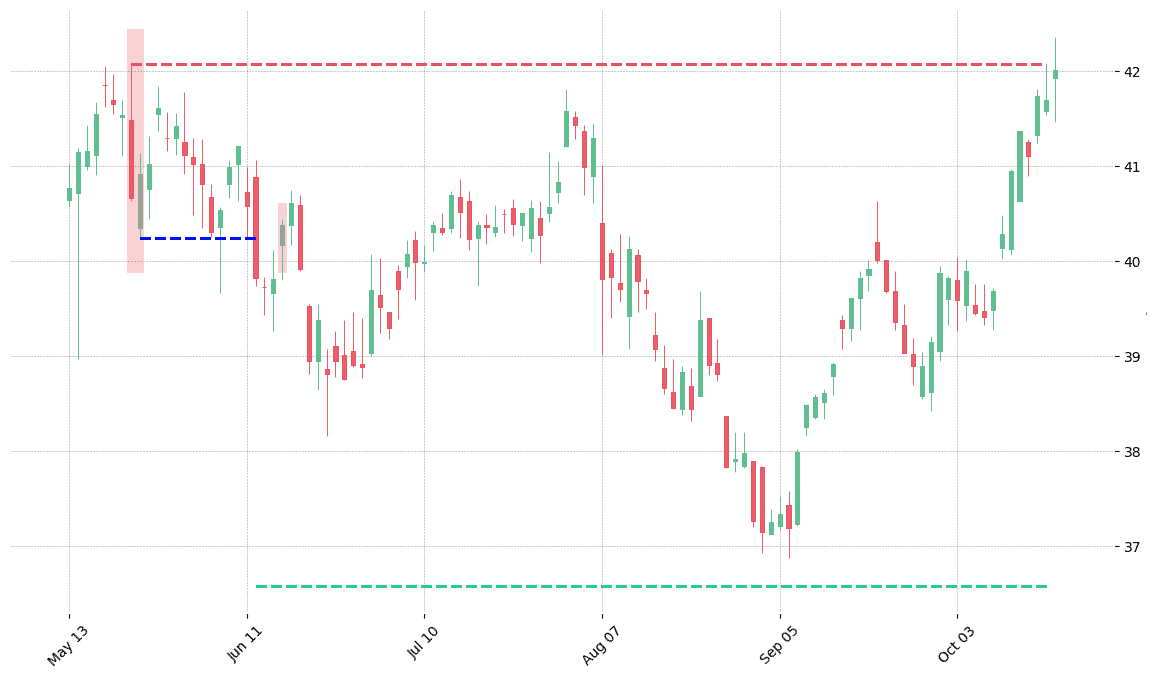
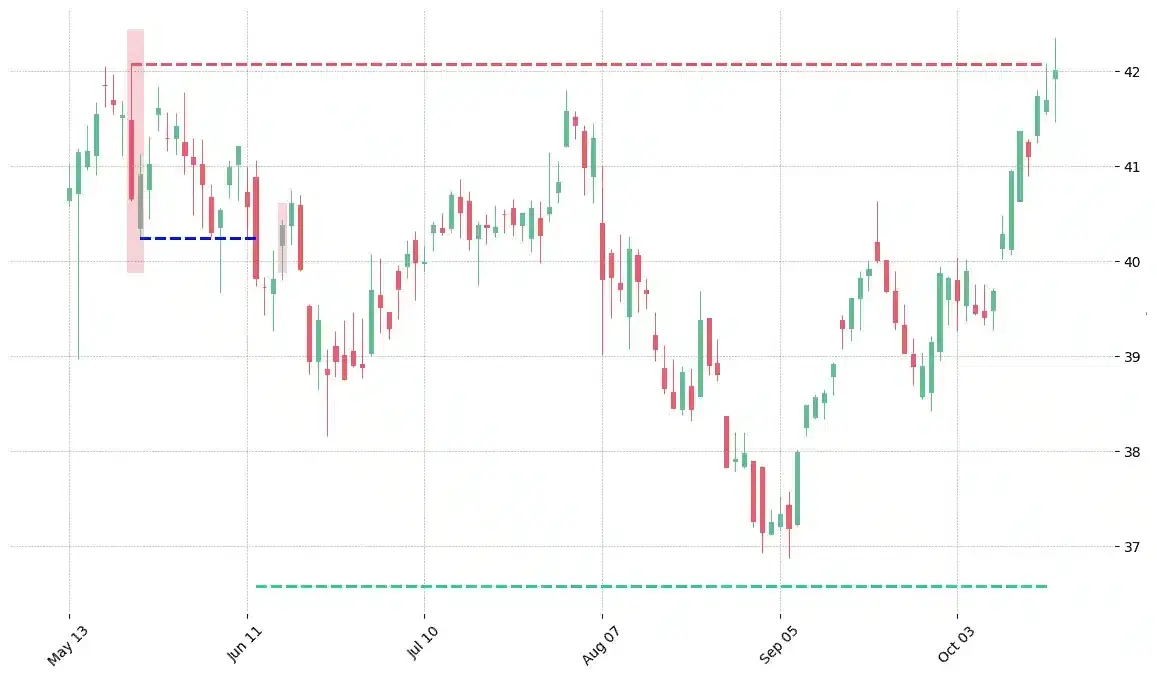
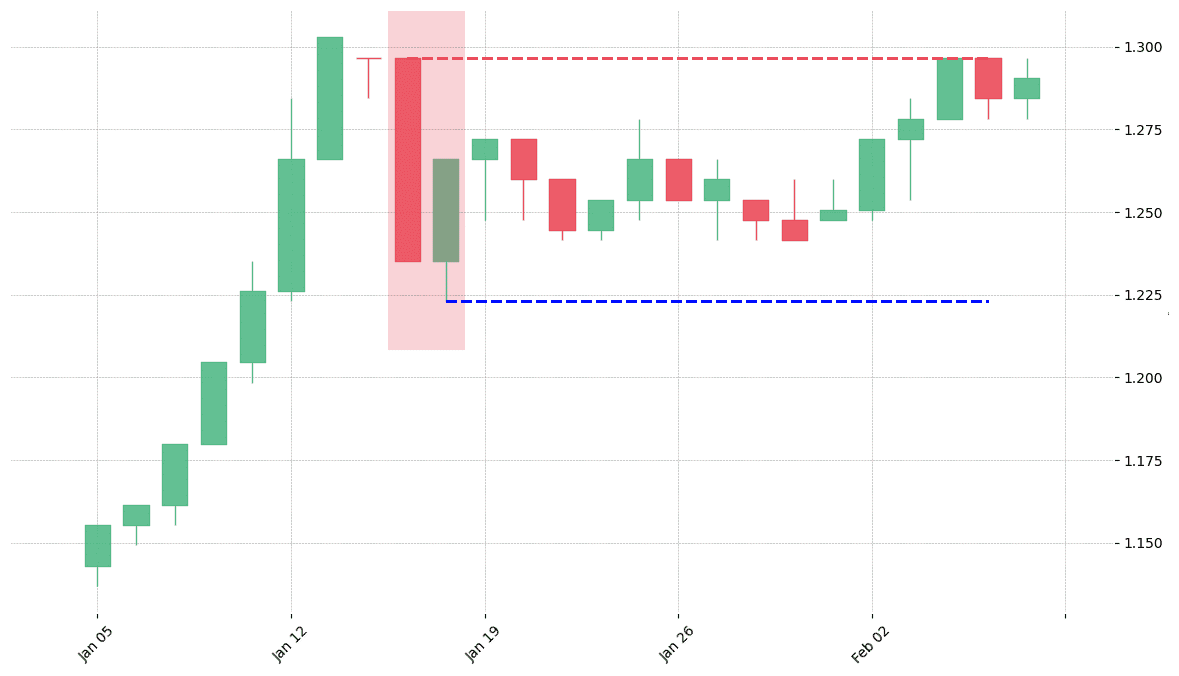
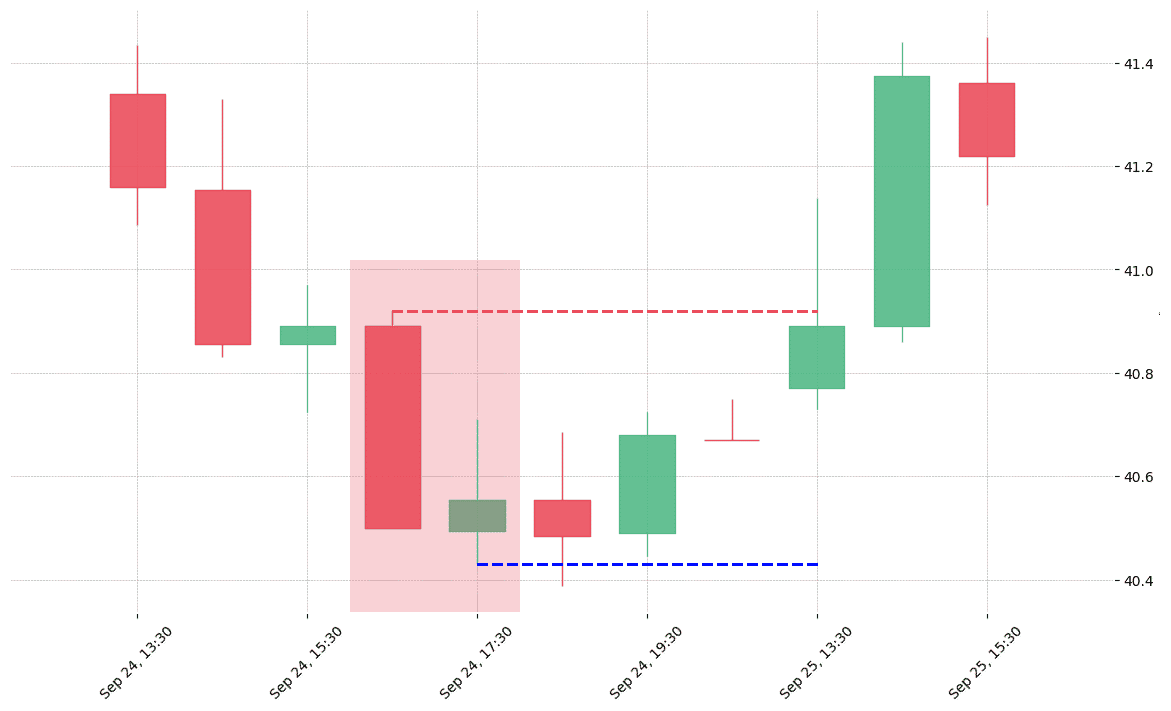
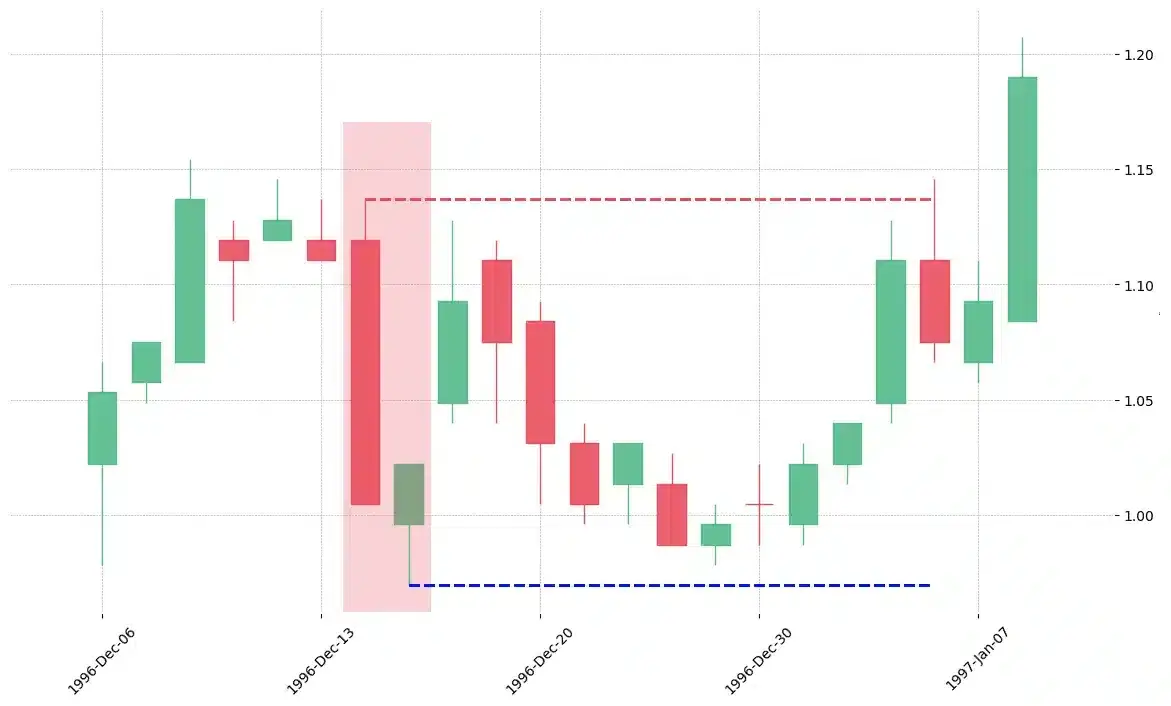
How does the Thrusting pattern look in real life?


Looking to learn more about this pattern?
You should take a look at Joe Marwood's online course. In his course, he backtested the 26 main candlestick patterns before to summarize which one is THE best pattern. I really liked his course and you shouldn't miss it!
Click here to signup to his "Candlestick Analysis For Professional Traders" course now!


 We loved Marwood Research’s course “Candlestick Analysis For Professional Traders“. Do you want to follow a great video course and deep dive into 26 candlestick patterns (and compare their success rates)? Then make sure to check this course!