
 Good Trading requires the Best Charting Tool!
Recognizing patterns is a necessary aspect of technical analysis. Traders should make sure that if they have a moment of doubt, they can act on a situation if they have seen it before. In this article, we will cover in-depth the Three Line Strike candlestick pattern.
When evaluating price actions using technical analysis you are gauging the flows of investor sentiment based on various market trends and consolidation. When prices start moving sideways, they make patterns that can be used to determine future price movements.
As you start recognizing various chart patterns, you will learn to know the difference between patterns that foreshadow a continuation, and those that signify that a reversal will happen. One of the most powerful continuation patterns is the three-line strike candlestick pattern.
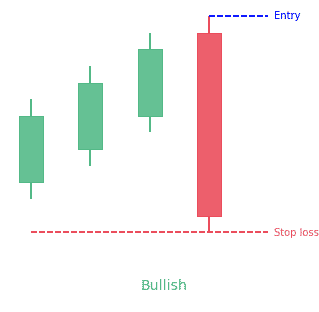
- The Three Line Strike candlestick pattern is a 5-bar continuation pattern.
- The bullish formation is composed of a big green candle, 3 up candles, and one down candle erasing the advance made by the prior 3 candles.
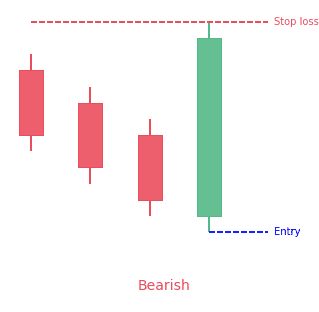
- The bearish formation is composed of a big red candle, 3 down candles, and one up candle erasing the decrease made by the prior 3 candles.
Statistics to prove if the Three-Line Strike pattern really works
Are the odds of the Three Line Strike pattern in your favor?
How does the Three Line Strike behave with a 2:1 target R/R ratio?
From our research the Three Line Strike pattern confirms 21.5% of the time on average overall all the 4120 markets we analysed. Historically, this patterns confirmed within 10 candles or got invalidated within 5.4 candles. If confirmed, it reached the 2:1 R/R target 36.9% of the time and it retested it's entry price level 91.6% of the time.
Not accounting for fees, it has an expected outcome of 0.108 $/$.
It means for every $100 you risk on a trade with the Three Line Strike pattern you make $10.8 on average.
Want to account for your trading fees? Have the detailled stats for your favorite markets / timeframes? Or get the stats for another R/R than 2:1?
🚀 Join us now and get fine-tuned stats you care about!
How to handle risk with the Three Line Strike pattern?
We analysed 4120 markets for the last 59 years and we found 8 884 occurrences of the Three Line Strike pattern.
On average markets printed 1 Three Line Strike pattern every 1 756 candles.
For 2:1 R/R trades, the longest winning streak observed was 9 and the longest losing streak was 14. A trading strategy relying solely on this pattern is not advised. Anyway, make sure to use proper risk management.
Keep in mind all these informations are for educational purposes only and are NOT financial advice.
If you want to learn more and deep dive into candlestick patterns performance statistics, I strongly recommend you follow the best available course about it. Joe Marwood (who's a famous trader with more than 45 000 Twitter followers) created an online course called "Candlestick Analysis For Professional Traders" in his Marwood Research University. There he will take you through the extensive backtesting of the 26 main candlestick patterns. He then summarizes which one is THE best pattern. Do you know which one it is?
Remember, don't trade if you don't know your stats. Click here to signup to the course now!
What is the Three Line Strike candlestick pattern?
A three-line strike is a continuation group of candlesticks that has three bars in the direction of a trend, followed by a final candle that pulls back to the start point. Traders make use of the three-line strike as an opportunity to buy at a current trend low or sell at a current high.
Candlesticks can be used to assist traders to determine a trend that is likely to persist. After prices trend in a particular direction, they will pause before refreshing higher. This is seen as a continuation pattern and is different from a pattern that would signal a reversal.
Bullish Three-Line Strike
A bullish three-line strike is made up of four candles. Of these, the first three are bullish, while the last is bearish. It is made up of three strong bullish candles that progressively end higher followed by a final strike candle. The strike candlestick is bearish and begins at or higher than the third candle but closes at least lower than the open of the first candle. It has these qualities:
- The first three bars are bullish and end higher
- The fourth candle is negative and ends lower than the low of the pattern
Bearish Three-Line Strike
A bearish three-line strike is a four candle continuation pattern that comes up in a bearish trend. The first three candles are bearish, while the last candle is positive and ends above the highest close of the previous three candles.
It is the opposite with three strong falling candles that close increasingly lower followed by a single bullish strike candle. The strike candle should open at or lower than the close of the third candle and close greater than the open of the first candle. The pattern is made up of three bearish candles, and one large bullish candle, all present in a downtrend. It has these qualities:
- The market is in a bearish
- The first three candles are bearish
- The last candle is bullish, but closes above the highest close of the previous three candles
How to identify the Three Line Strike candlestick pattern?
The three-line strike is not a common pattern in forex markets. It is therefore difficult to judge its reliability, particularly on daily charts and higher. Patterns are regularly forming within each other. The large patterns like triangle patterns can affect the formation and breakdown of other candlestick patterns.
The medium-sized patterns can also make a continuation pattern turn into a reversal pattern. Patterns such as the three-line strike candlesticks pattern could form the handle of the cup and handle and instead of continuing, they reverse. Therefore, a three-line strike candlestick pattern forming at the apex of symmetrical triangle patterns could have various outcomes.
What does the Three Line Strike tell traders?
Bullish Three-Line Strike
Since all candlesticks have unique shapes, they also represent unique price movements in the market and offer a lot of clues about the prevailing forces. Traders are very interested in knowing about the forces that moved the market, to have a better chance of correctly predicting what will happen in the future. But it’s not simple accurately understanding the reasons behind a market move.
Now, while this might be the case, watching and analyzing market data still is a valuable pastime! You will inevitably get a lot of new trading ideas of which some may become the foundation for a new trading strategy.
Most market participants believe in ascending prices. Due to this, the market forms the first three bullish candles.
However, with the market has gone up for a long time, it’s becoming overbought. That is, it has simply gone up so much so that more people are beginning to look to sell off some of their positions in anticipation of a pullback. In other words, market sentiment is beginning to become more bearish.
As the next candle opens, you will notice how buyers push the market downwards. And while the move was violent and sudden, a lot of market participants still are bullish given the rising trend. Due to this, prices continue to go higher shortly thereafter.
Bearish Three-Line Strike
It means that the bears are in control and there is a strong downward movement. This movement is enhanced by the appearance of the three black candles, each one driving the price less than the candle before it. The fourth day, however, comes with a powerful surprise – the bulls have regained strength and moved the price higher and higher, resulting in white candlestick that engulfs the previous candles, erasing the progress of the bears.
Even though the reversal of sentiment shown on the fourth day may show that a reversal is likely, the opposite is true. The magnitude and speed of the reversal pose a risk for those betting on a reversal. Rather, the downtrend should be expected to resume.
A bullish three line strike typically indicates that the current trend will go on. But this isn’t always the case. At times, when the pattern is flighty and less dependable, it will herald a reversal of the uptrend. Due to this, you must always check for confirmation. Watch the days that follow for a signal. A white candle, a large gap up, or a higher close all point toward a continuation of the uptrend.
How to trade when you see the Three Line Strike candlestick pattern?
Contrary to popular belief, you cannot just act on single candlestick patterns without additional confirmation. Most candlestick patterns aren’t simply accurate enough to be traded on their own. Rather, you need to get additional filters and conditions that succeed to rule out a lot of the losing trades you would have taken otherwise.
Entry point
The three-line strike pattern is a rare pattern which means that using a scan to find them might be useful, since it is difficult to detect them.
Risk Management
The risk management methods that you can apply when using the three-line strike entry, should be like other trend-following strategies. The aim is to catch a trend and follow the trend until it reverses. This would mean that you could put a stop-loss below the entry point and move it higher as the market trends upward. You can move the stop-loss downward for a bearish pattern.
Before entering a trade based on a three-line strike pattern, ensure you have a good risk management strategy. Since the pattern is focused on finding a current trend, you can apply a trailing stop-loss that moves up (or down) as prices trend higher (lower).
Trading strategy with the Three Line Strike candlestick pattern
- Observe for the first three bearish candlesticks to form
- Next, notice for the fourth large bullish candlestick to engulf 1st three bearish ones
- Then, watch for the fifth candlestick to break above fourth bullish one
- Take a long position once price breaks above the fourth candlestick
- Place stop-loss below the base of the fourth candle
- You can also take a short position once the price falls below the fourth candle
- Then place a stop above the 4th candle
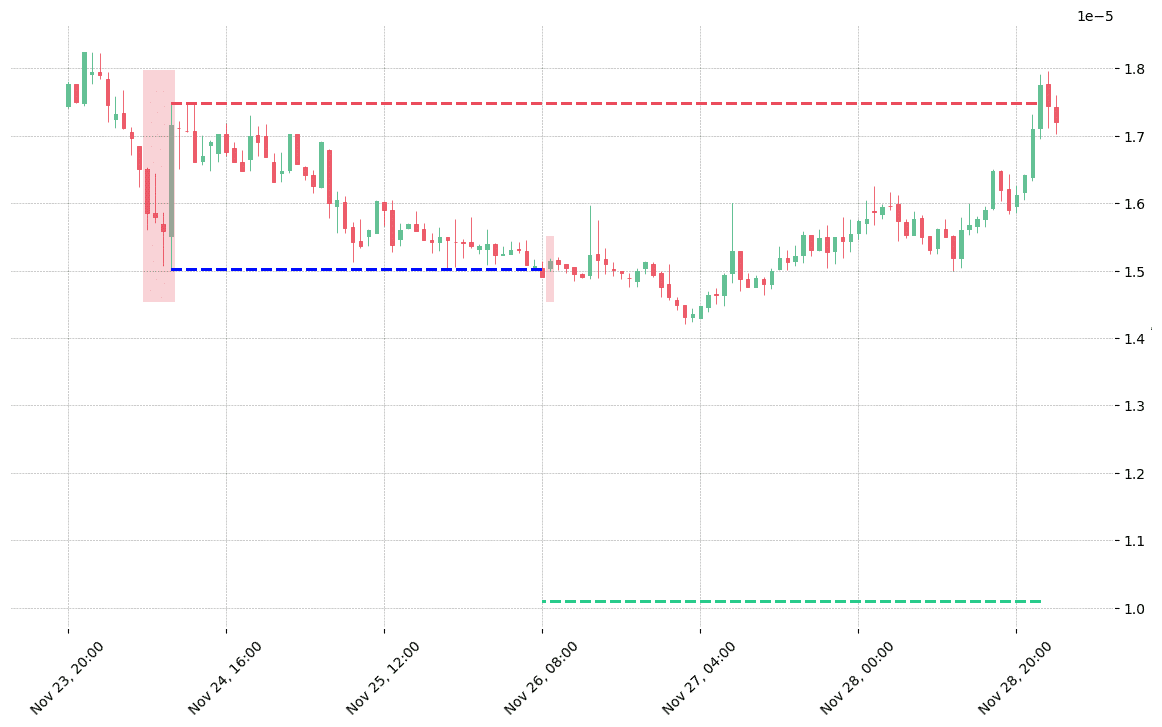
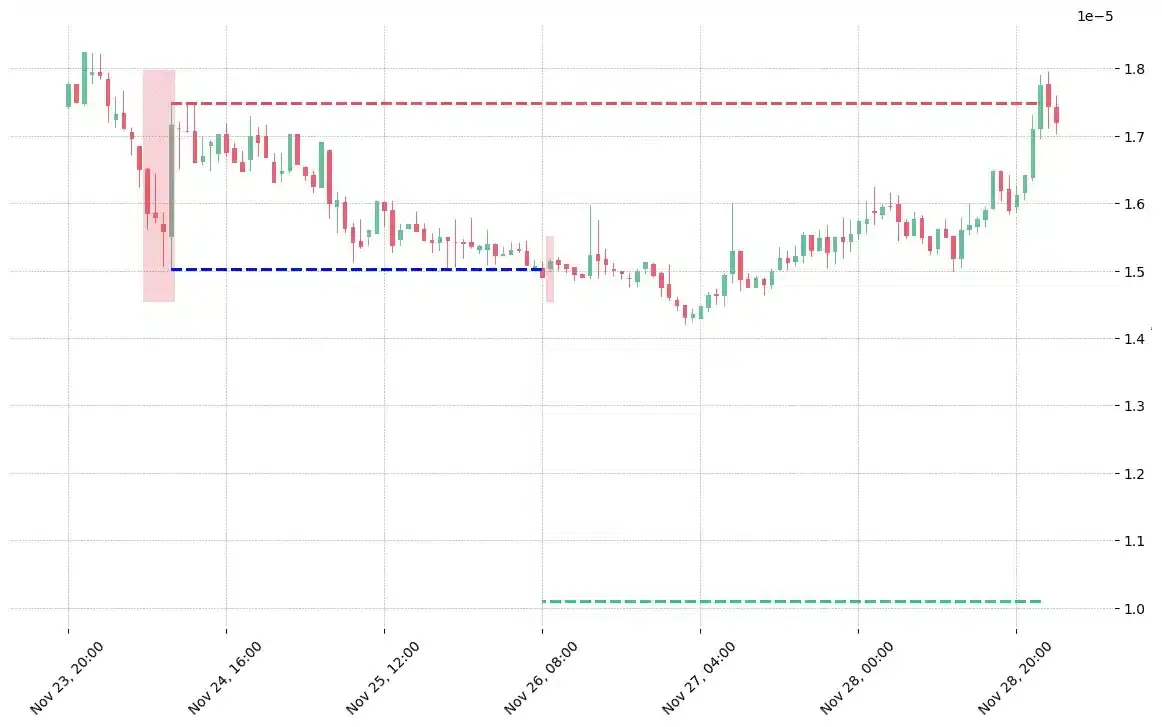
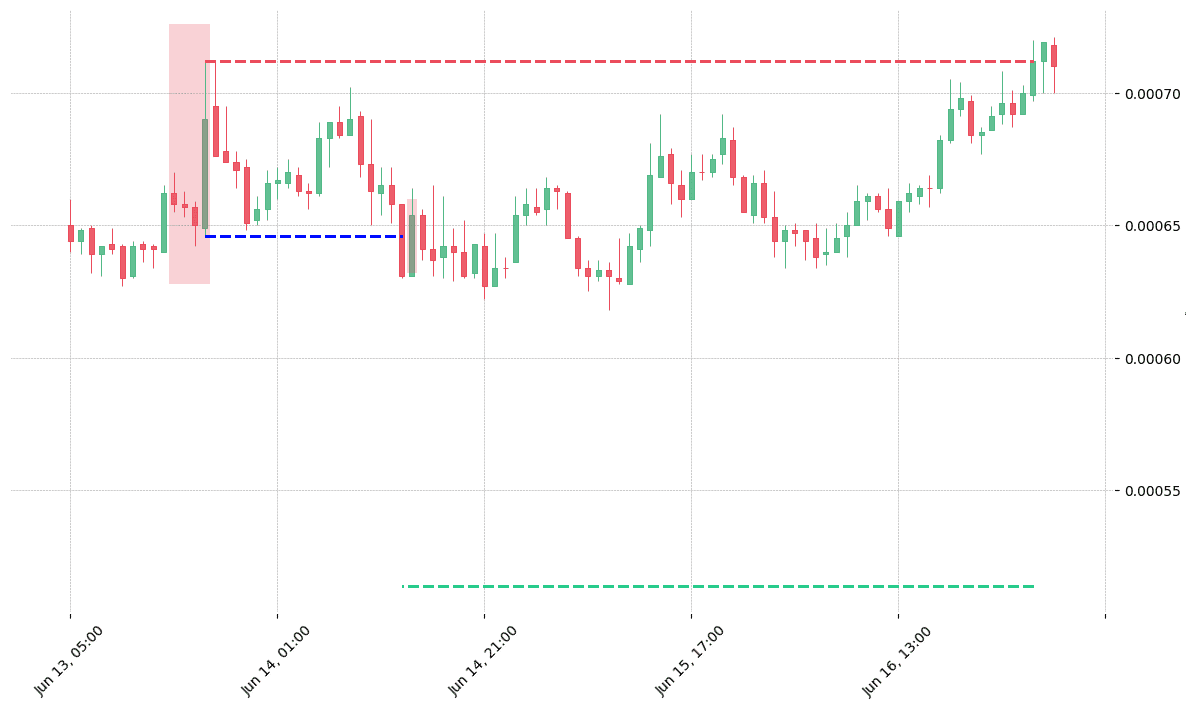
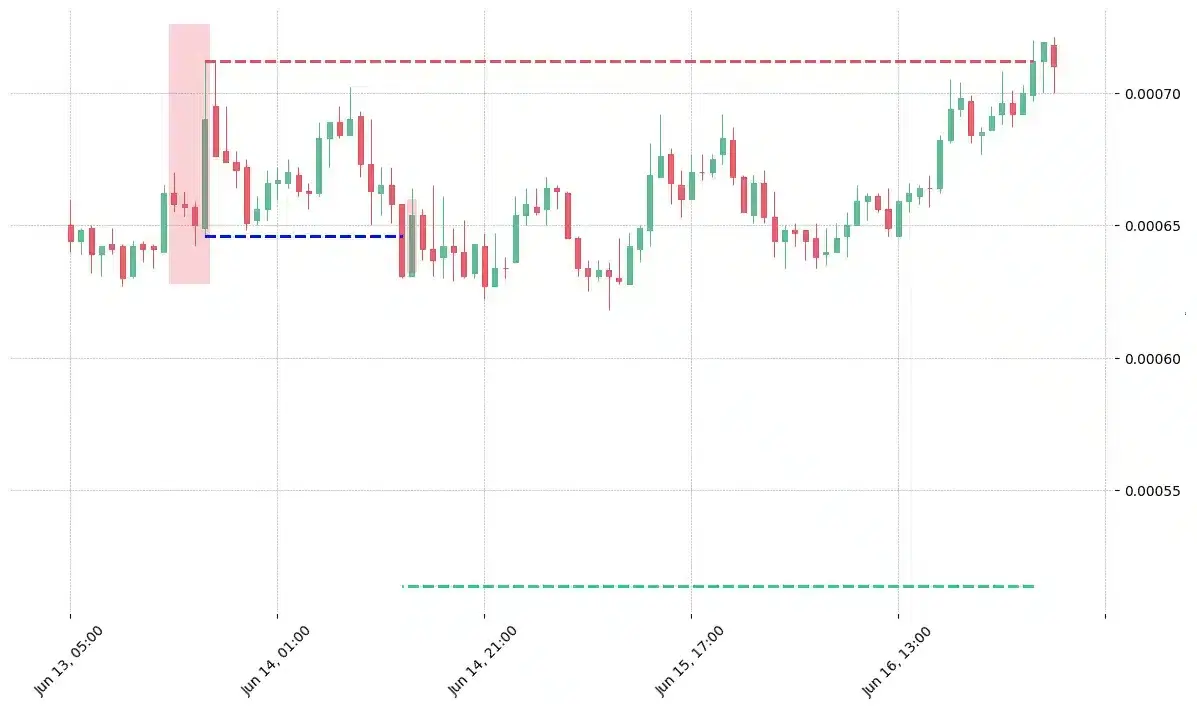
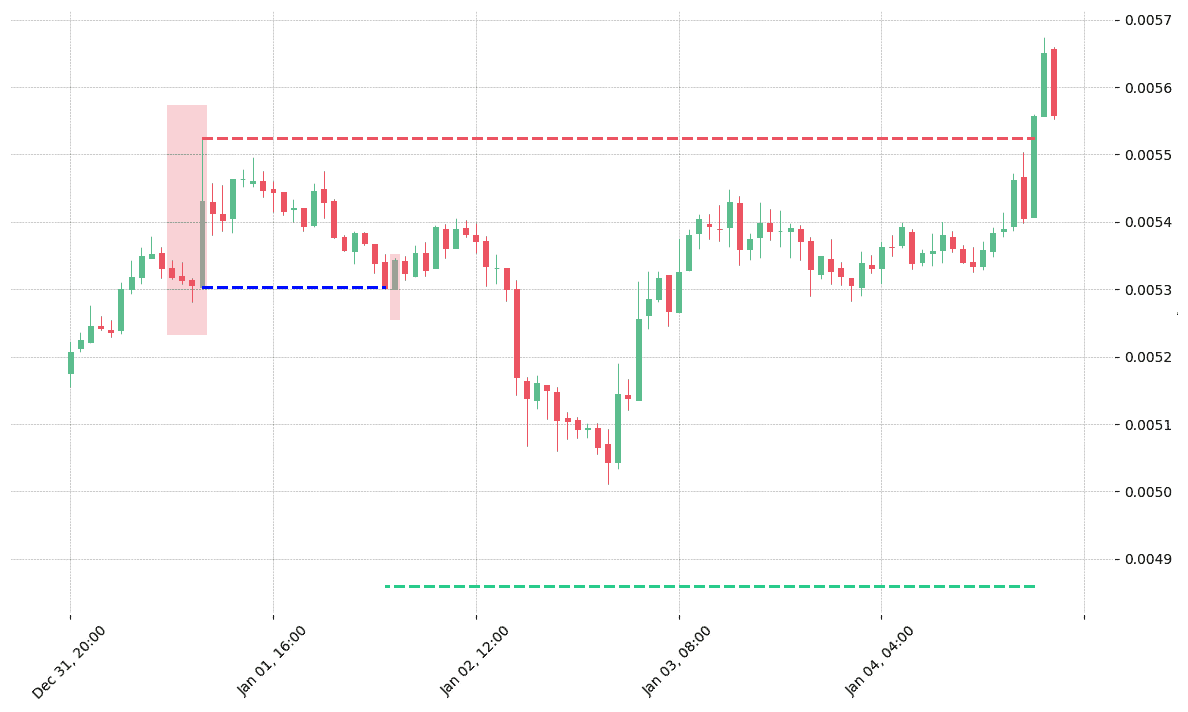
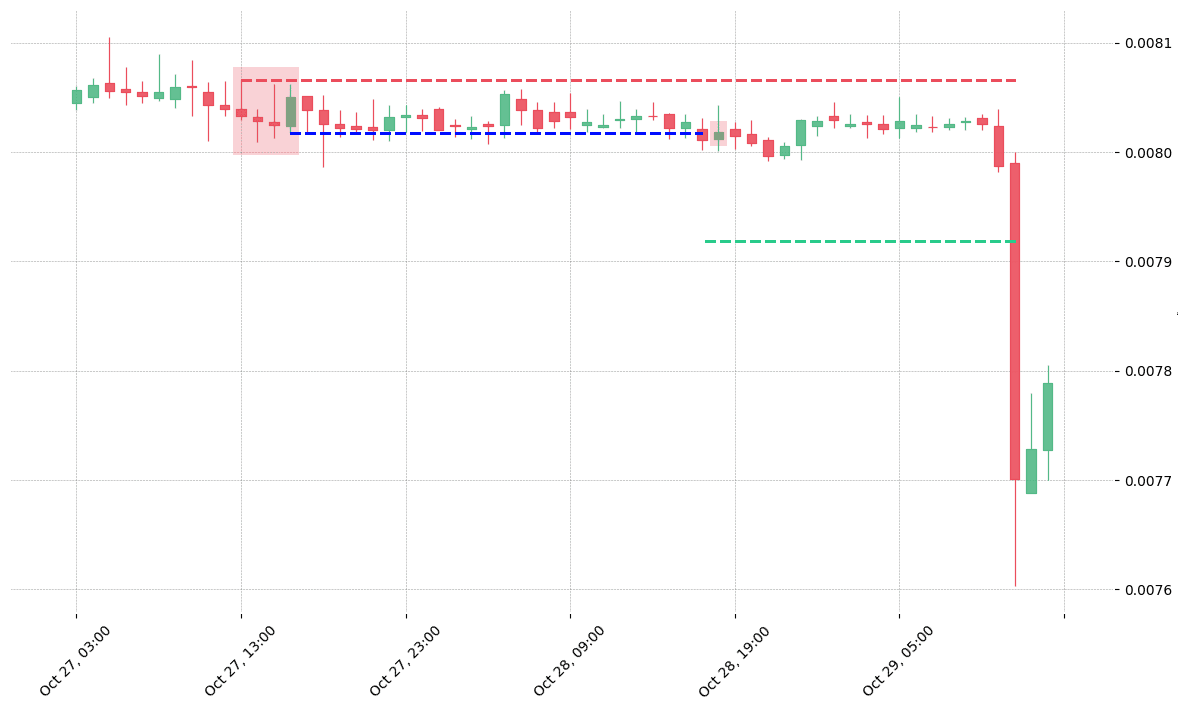
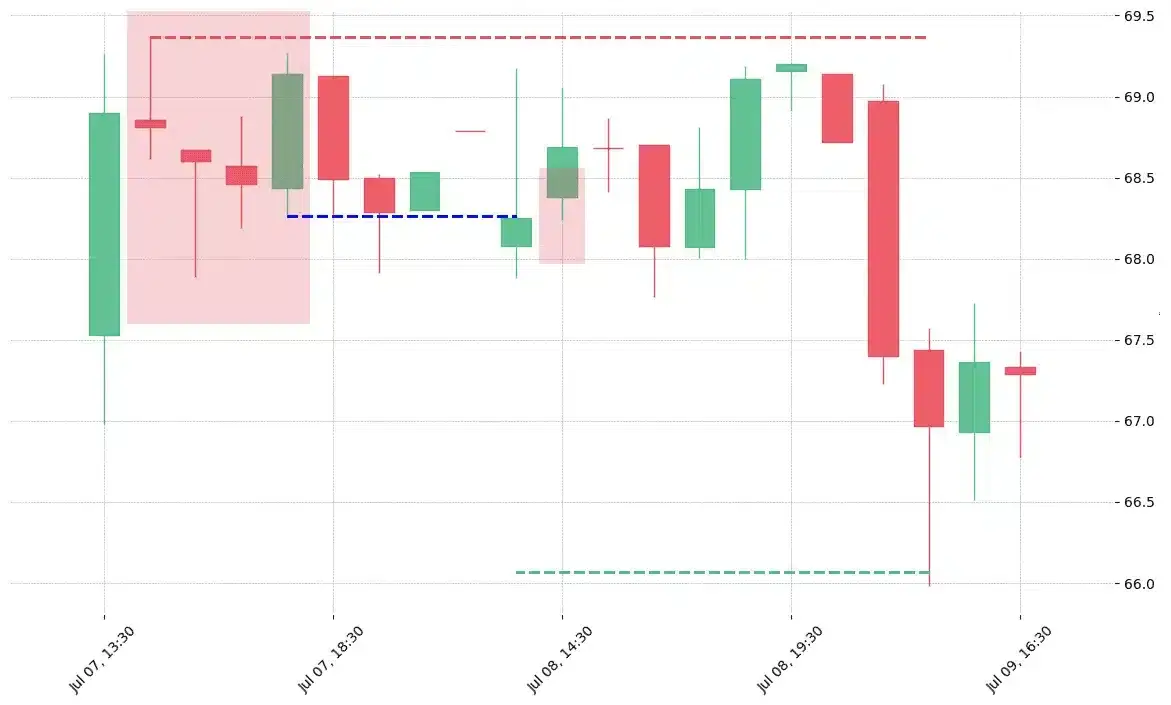
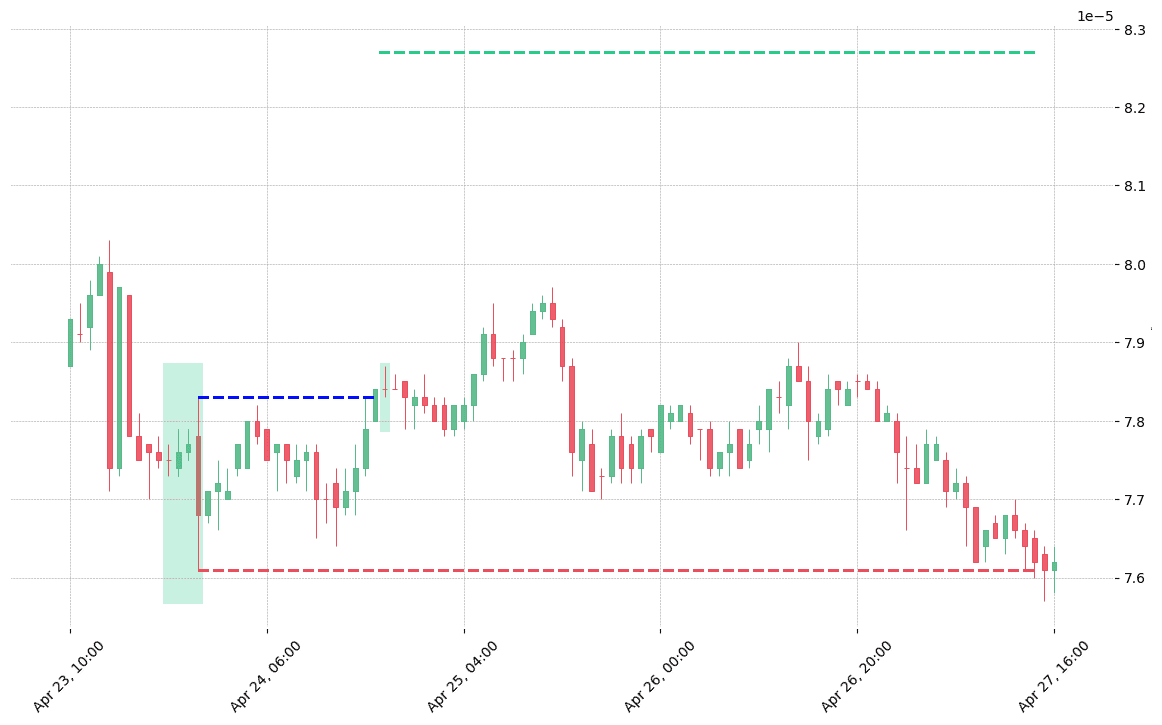
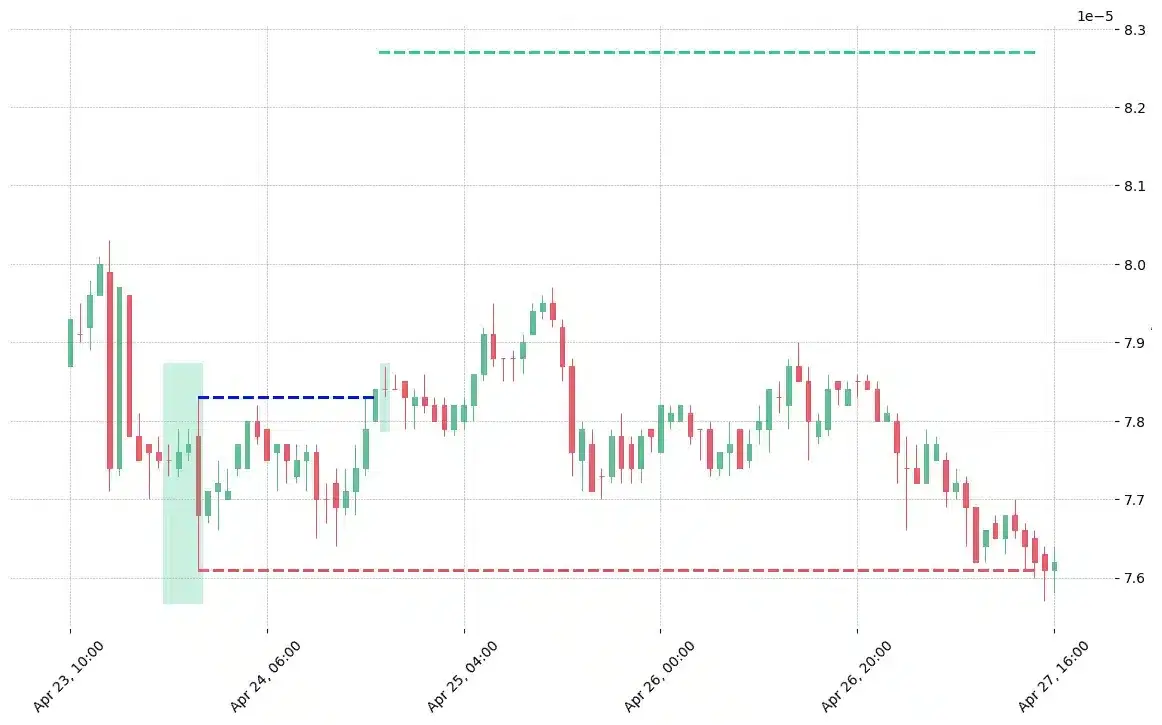
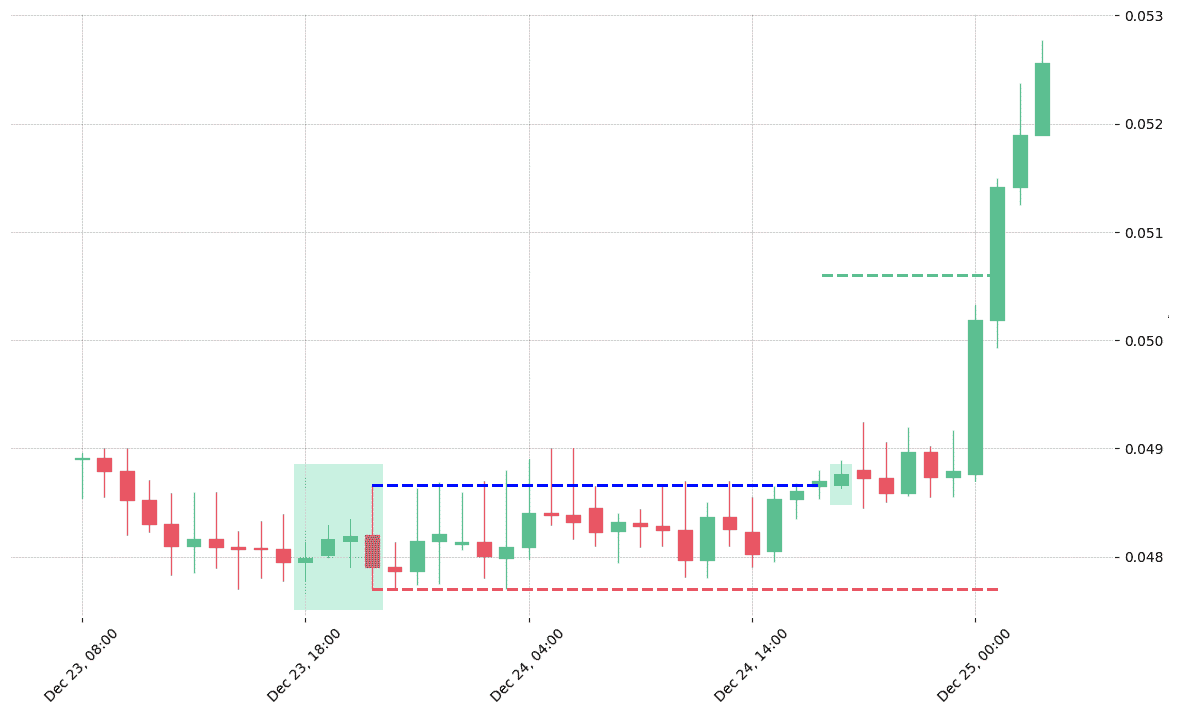
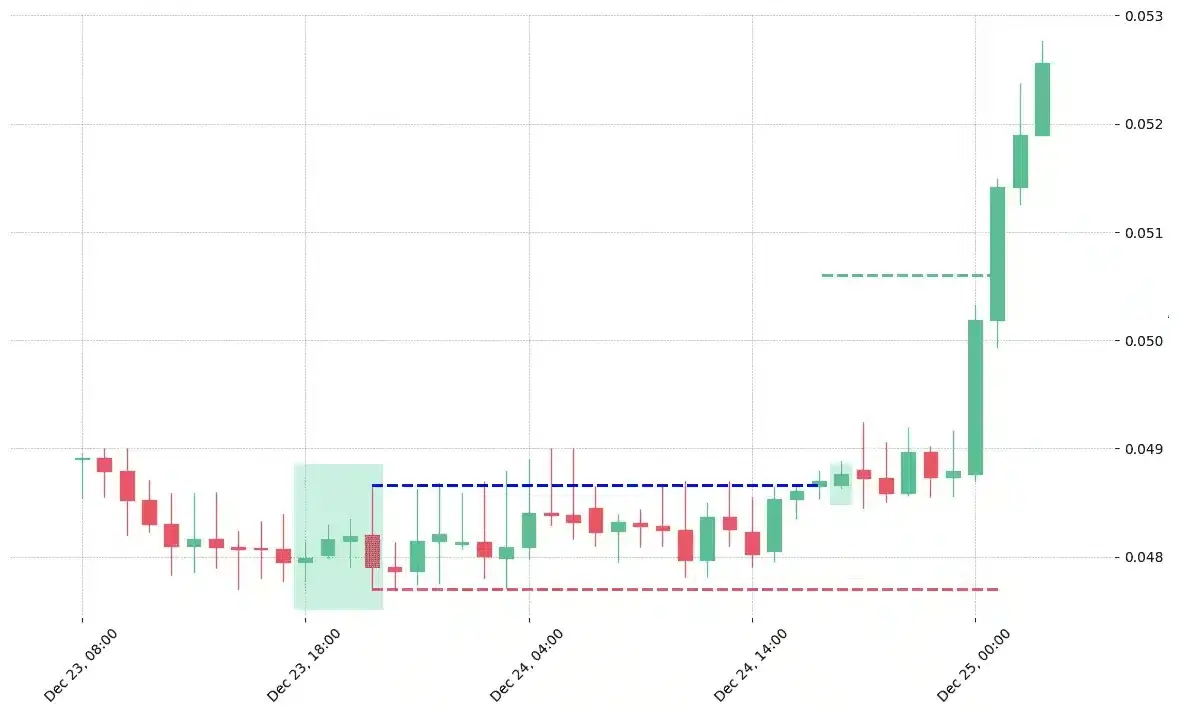
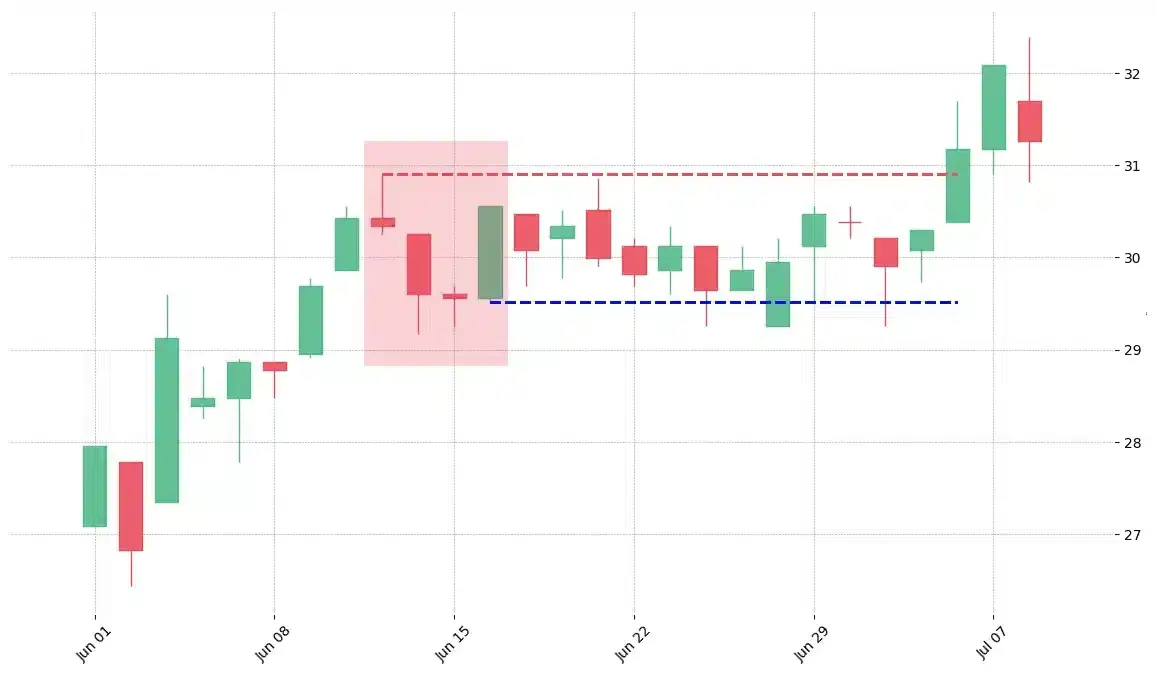
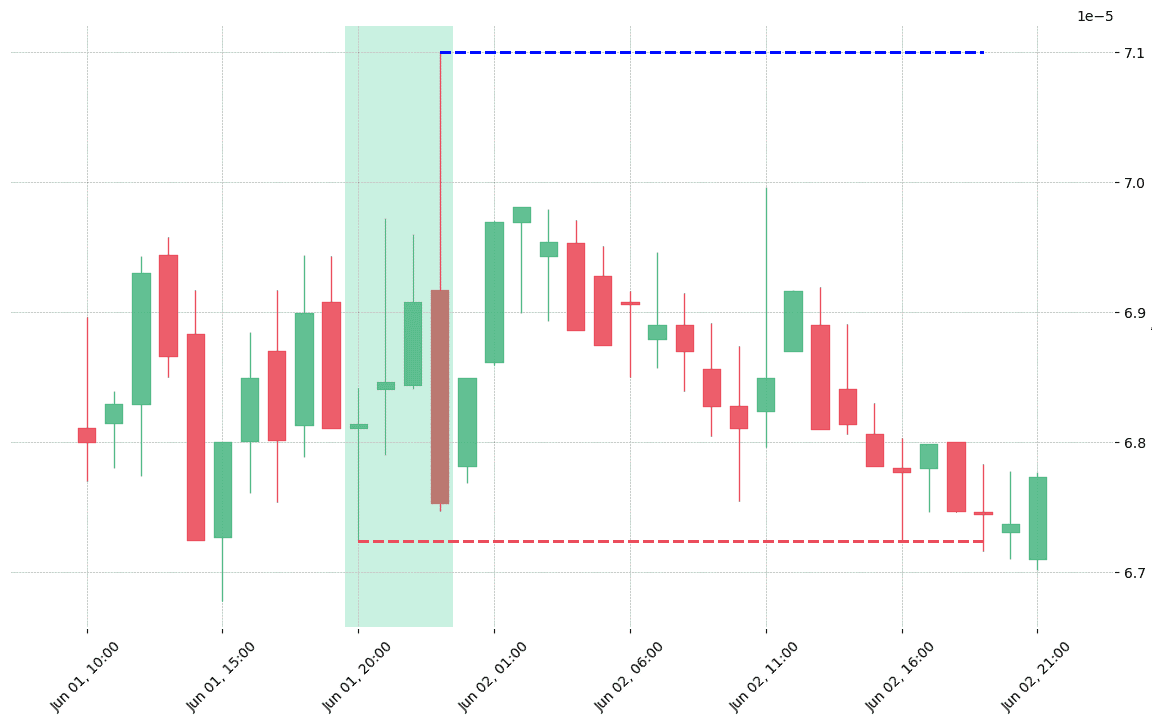
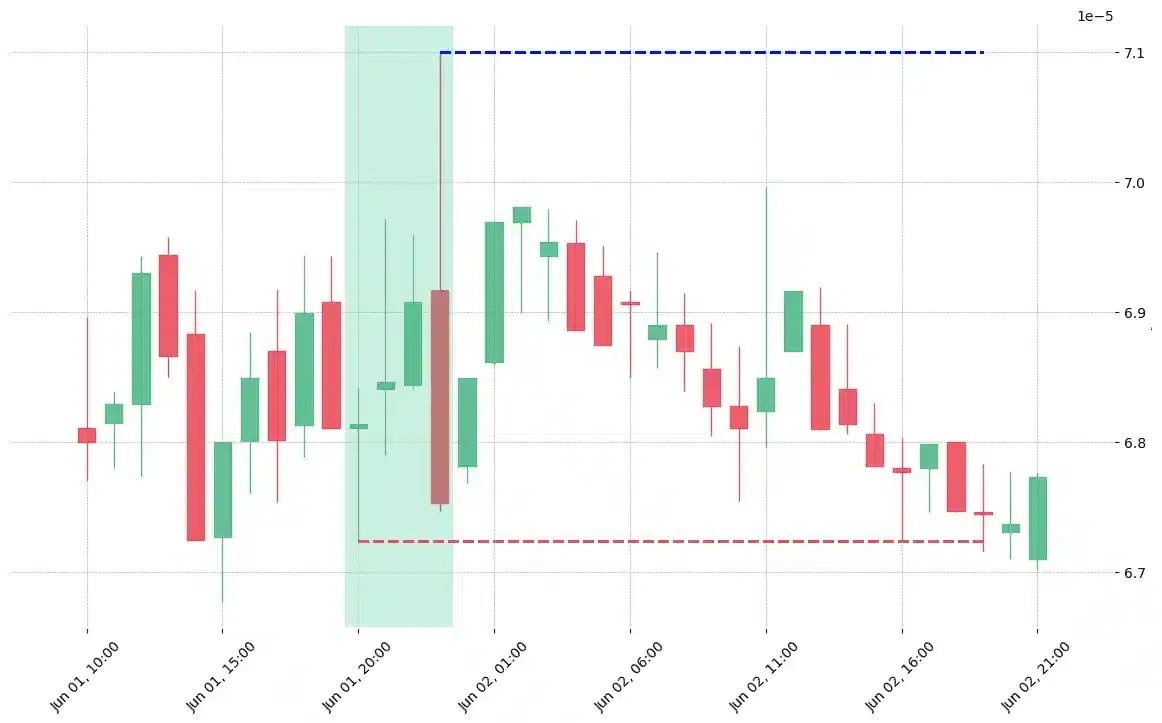
How does the Three-Line Strike pattern look in real life?


Looking to learn more about this pattern?
You should take a look at Joe Marwood's online course. In his course, he backtested the 26 main candlestick patterns before to summarize which one is THE best pattern. I really liked his course and you shouldn't miss it!
Click here to signup to his "Candlestick Analysis For Professional Traders" course now!


 We loved Marwood Research’s course “Candlestick Analysis For Professional Traders“. Do you want to follow a great video course and deep dive into 26 candlestick patterns (and compare their success rates)? Then make sure to check this course!