 Good Trading requires the Best Charting Tool!
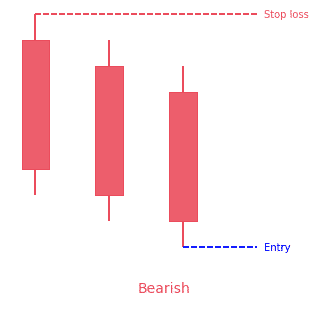
- The three black crows is a 3-bar bearish reversal pattern
- The pattern consists of 3 bearish candles opening above the previous one and closing below the midpoint of the previous candle
- Each candle should be relatively large to show the strong participation
Statistics to prove if the Three Black Crows pattern really works
Are the odds of the Three Black Crows pattern in your favor?
How does the Three Black Crows behave with a 2:1 target R/R ratio?
From our research the Three Black Crows pattern confirms 87.8% of the time on average overall all the 4120 markets we analysed. Historically, this patterns confirmed within 2.1 candles or got invalidated within 13.6 candles. If confirmed, it reached the 2:1 R/R target 28.6% of the time and it retested it's entry price level 99.3% of the time.
Not accounting for fees, it has an expected outcome of -0.141 $/$.
It means for every $100 you risk on a trade with the Three Black Crows pattern you lose $14.1 on average.
Want to account for your trading fees? Have the detailled stats for your favorite markets / timeframes? Or get the stats for another R/R than 2:1?
🚀 Join us now and get fine-tuned stats you care about!
How to handle risk with the Three Black Crows pattern?
We analysed 4120 markets for the last 59 years and we found 1 401 occurrences of the Three Black Crows pattern.
On average markets printed 1 Three Black Crows pattern every 11 136 candles.
For 2:1 R/R trades, the longest winning streak observed was 6 and the longest losing streak was 16. A trading strategy relying solely on this pattern is not advised. Anyway, make sure to use proper risk management.
Keep in mind all these informations are for educational purposes only and are NOT financial advice.
If you want to learn more and deep dive into candlestick patterns performance statistics, I strongly recommend you follow the best available course about it. Joe Marwood (who's a famous trader with more than 45 000 Twitter followers) created an online course called "Candlestick Analysis For Professional Traders" in his Marwood Research University. There he will take you through the extensive backtesting of the 26 main candlestick patterns. He then summarizes which one is THE best pattern. Do you know which one it is?
Remember, don't trade if you don't know your stats. Click here to signup to the course now!
What is the Three Black Crows candlestick pattern?
What is it made of?
Three black crows show a bearish candlestick pattern that predicts the reversal of an uptrend. Candlestick charts indicate the opening, high, low, and the closing price on a security. For stocks going higher, the candlestick is green or white. When moving lower, they show a black or red color.
The black crow pattern is made up of three consecutive long candlesticks that have opened within the real body of the previous candle and closed lower than the previous candle. Most times, traders use this indicator together with other technical indicators or chart patterns to confirm a reversal.
The pattern consists of three consecutive red candles. This is a visual pattern and can be easily identified on the price action charts. It essentially indicates a shift in control from bulls to bears. Steve Nison says in his book “Candlestick Trading Technique” that this pattern is one of the most useful ones for longer-term trades.
It is a visual pattern
This pattern is visual, meaning that no particular calculations are needed when identifying this indicator. The three black crows pattern appears when bears overtake the bulls during three consecutive trading sessions. The pattern can be seen on the pricing charts as three bearish long-bodied candlesticks with short or no shadows or wicks.
Typically, when the pattern appears, the bulls will begin the session with the price opening modestly higher than the previous close, but the price is pushed lower throughout the session. In the end, the price will close near the session low under pressure from the bears. This trading action will lead to a very short or nonexistent shadow. Traders often interpret this downward pressure sustained over three sessions to be the beginning of a bearish downtrend.
How to identify the Three Black Crows pattern?
This pattern can be seen at the top of an uptrend when the trend reversal occurs. The three bearish candles are forming one after another in the way that the open of the next candle is only slightly taller than the close of the earlier one. From that, you can assume, a strong downtrend has just started.
The pattern unfolds on the markets with high volatility, such as after the release of important news; a strong trend rises only to suddenly collapse.
- In an uptrend, the pattern is made up of three consecutive bear candles that have big bodies of roughly the same size. The three black crows candlestick pattern confirms the strength of the sellers.
- Every candle marks a successive drop in price action and should not have long shadows or wicks. Applying this trading pattern in conjunction with other technical indicators will enhance the probability of winning a trade.
- Candles should open and close lower than the previous candle.
As well the pattern should come up at or close to a chart top so that the first bar forms a recent high. Remember that three black crows can form in either bearish or bullish trends. In a bearish trend the pattern often appears in short upswings or bearish rallies.
With forex charts as with other highly active markets, the close of one bar will usually level at the open of the next bar unless the bars are split during a weekend or holiday. Stock charts experience large gaps between the open and close where the market has closed overnight or over a weekend for instance.
What does the Three Black Crows chart pattern tell traders?
The Three Black Crows pattern announces a trend change
After being strong in the market, it is normal for the grip of the bulls to be weaker and allow the bears to have some fun; therefore, their prices get pushed lower. For daily charts, it means that the bears have driven prices lower for three successful days, causing red bars to be formed. This is the foundation of the three black crow chart patterns.
The three black crows candlestick pattern resemble a stair-step pattern with price heading lower. This indicates a strong reversal in the price of the stock. The continuous downward movement indicates the strength of the bears and they are now controlling the stock.
It’s necessary to remember that it is normal to have negative market sentiment coinciding with this price pattern which causes more negative pressure on stocks. Make sure to fully understand all news risks associated with the stock before trading this pattern. Large external factors can make the stock chart become irrational.
Bulls and bears are fighting
When there are a lot of forces, such as combining negative market sentiment with this technical pattern. It is highly likely that this will be a strong reversal pattern and a complete shift from a bull to a bear market. It officially confirms the end of upward price movement.
Some traders will get similar patterns using intraday charts, but it is best for daily charts. Since longer-term traders are trying to detect big trends that will define a lengthy market environment, this type of price action on a chart will have little to no impact on the daily timeframes.
It is important for traders to keep an eye for the length of the second and third candles. They must be approximately the same size (ideally larger) to show that the bears are in full control. If not, a hammer has likely formed. It signals to traders that bulls have taken control back and will drive price low in a trend-continuation pattern.
Applying the Three Black Crows candlestick pattern
As a visual pattern, it is best to use three black crows with confirmation from other technical indicators. This pattern and the confidence a trader can put into it depends a lot on how well-formed the pattern appears. The three black crows should ideally be relatively long-bodied bearish candlesticks that close at or near the low price for the time.
In other words, the candlesticks should have long, real bodies and short, or non-existent, shadows. If the shadows are stretching out, then it may simply mean a minor shift in momentum between the bulls and bears before the uptrend reasserting itself.
How to trade when you see the Three Black Crows?
Now that you have an idea of what the three black crows are and how to apply it, it’s time to go into the trading aspect.
First candle
You’ll notice the first candle going in an uptrend direction. The color should be red and it means that the price is closing lower than the open price of the security. This candle can either be a long or small bearish candle.
Second candle
A second candle appears, and should also be red in color, and have a similar size to the first. The opening price should fall within the body of the initial red candle. It is preferable that the opening price of the second candle falls between the mid-point and the closing price of the previous candle. Additionally, the candle should not break the high price of the previous candle.
Third and last candle
Again, this candle will also have a red color and can either be small or long. It should have an opening price within the body of the candle of the previous day. Preferably, the opening price of this candle should be between mid-point and the closing price of the candle of the second day. The candle should never break the high price of the previous candle.
Stop-Loss
Having a stop-loss is one of the most important aspects of a successful trading session. Some beginners never use this, and it ends up being a huge mistake. Traders need to use a stop-loss in every trade taken. For this pattern, place the stop-loss above the first candle and close the entire position when the price action gets to a significant area of support.
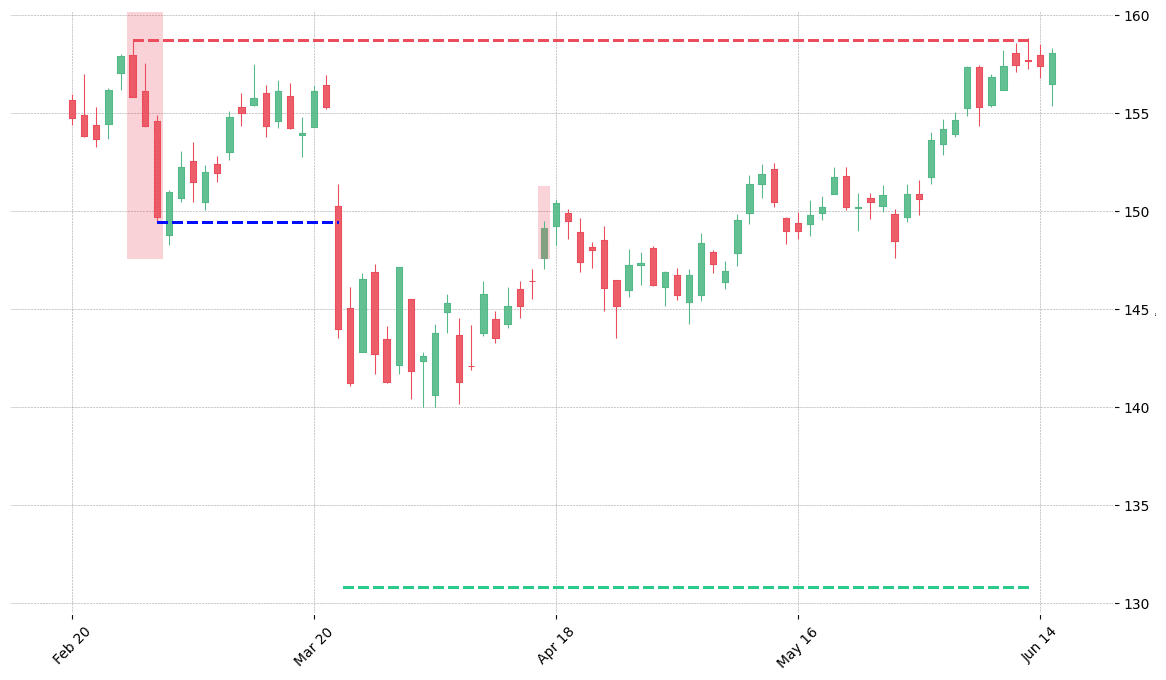
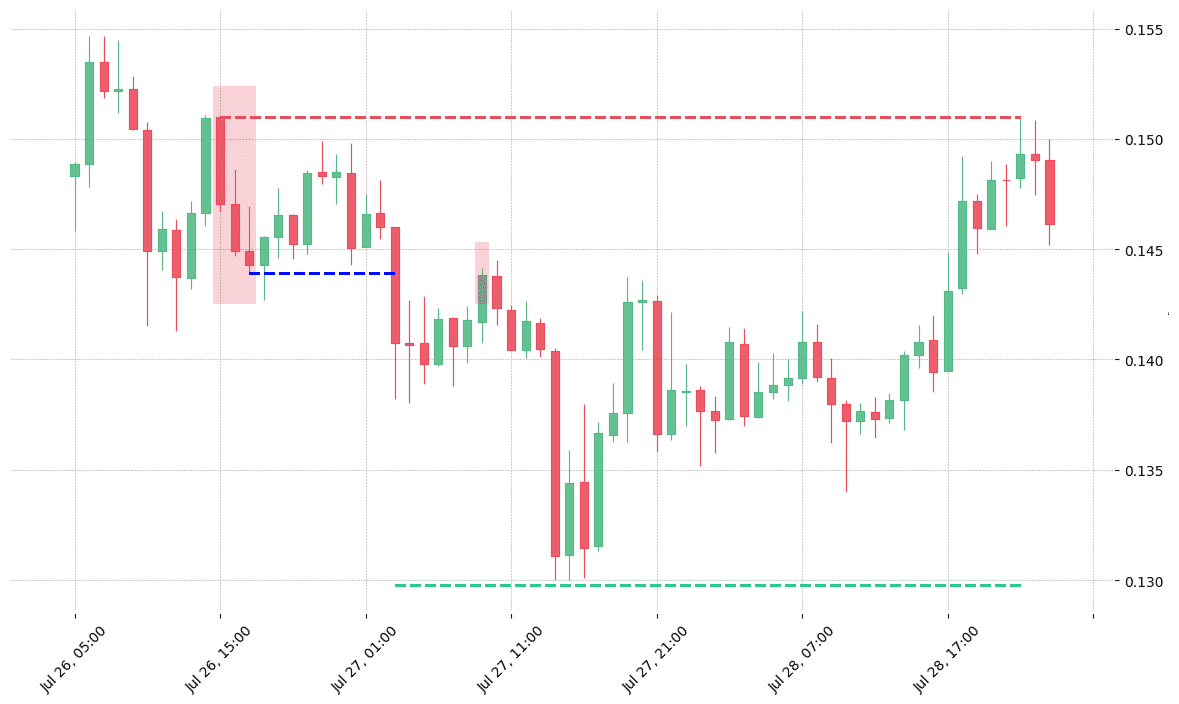
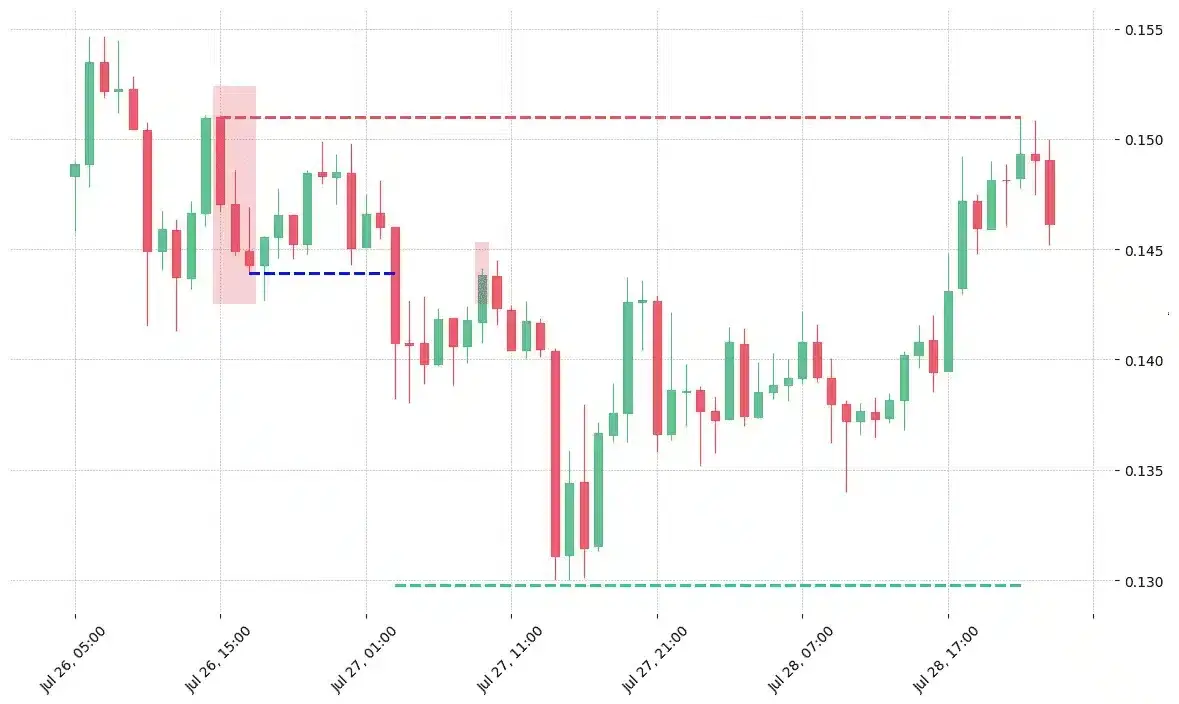
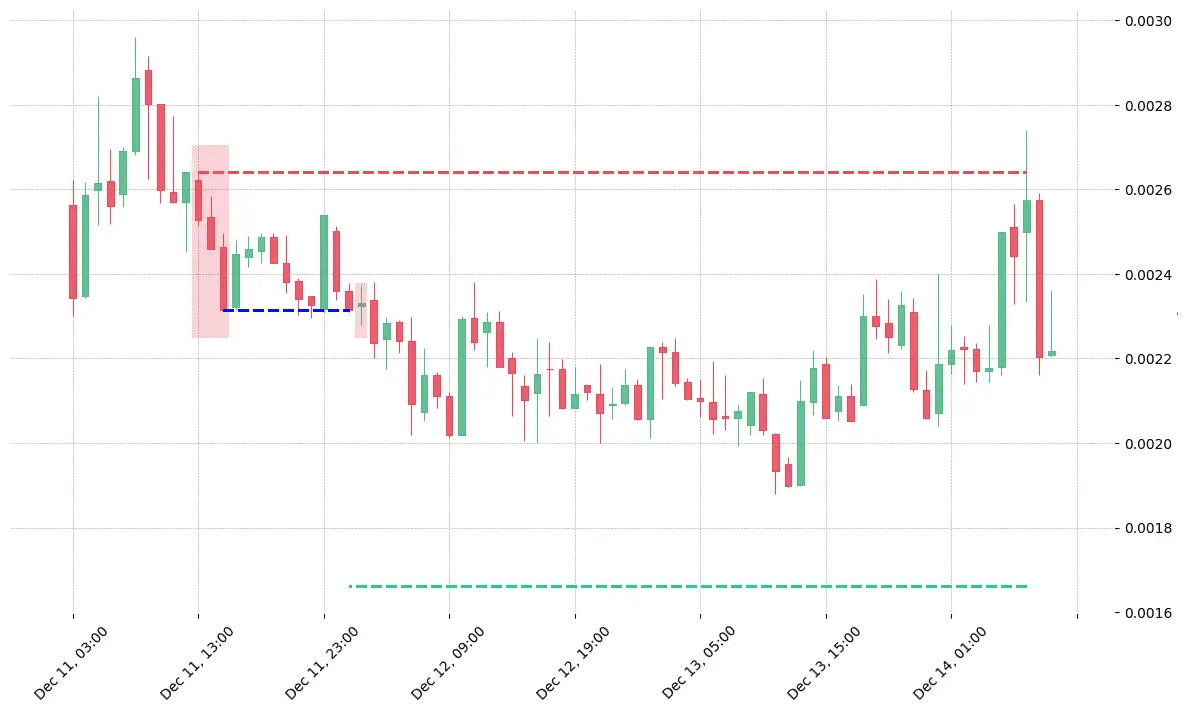
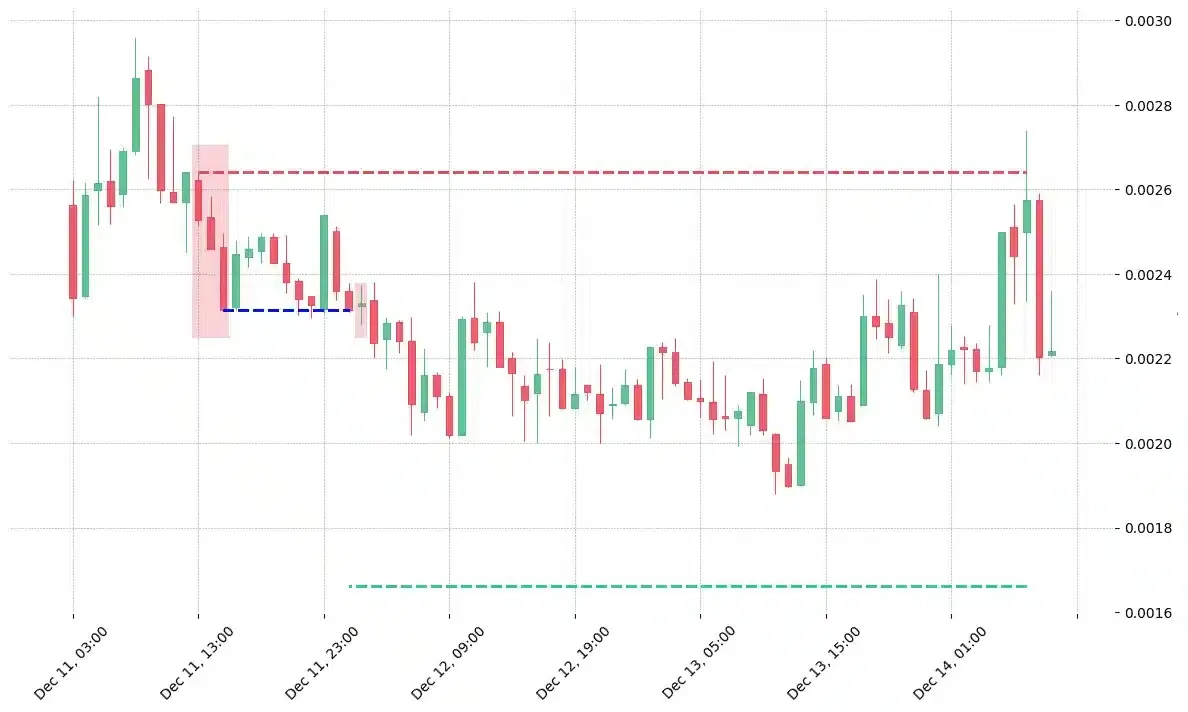
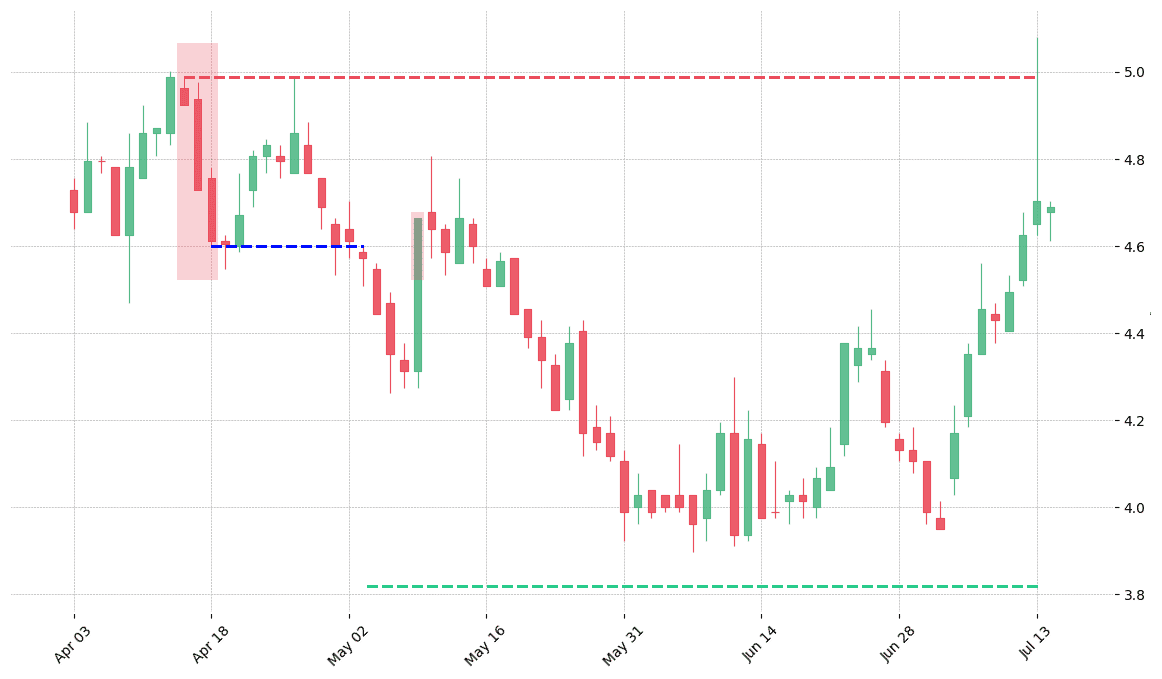
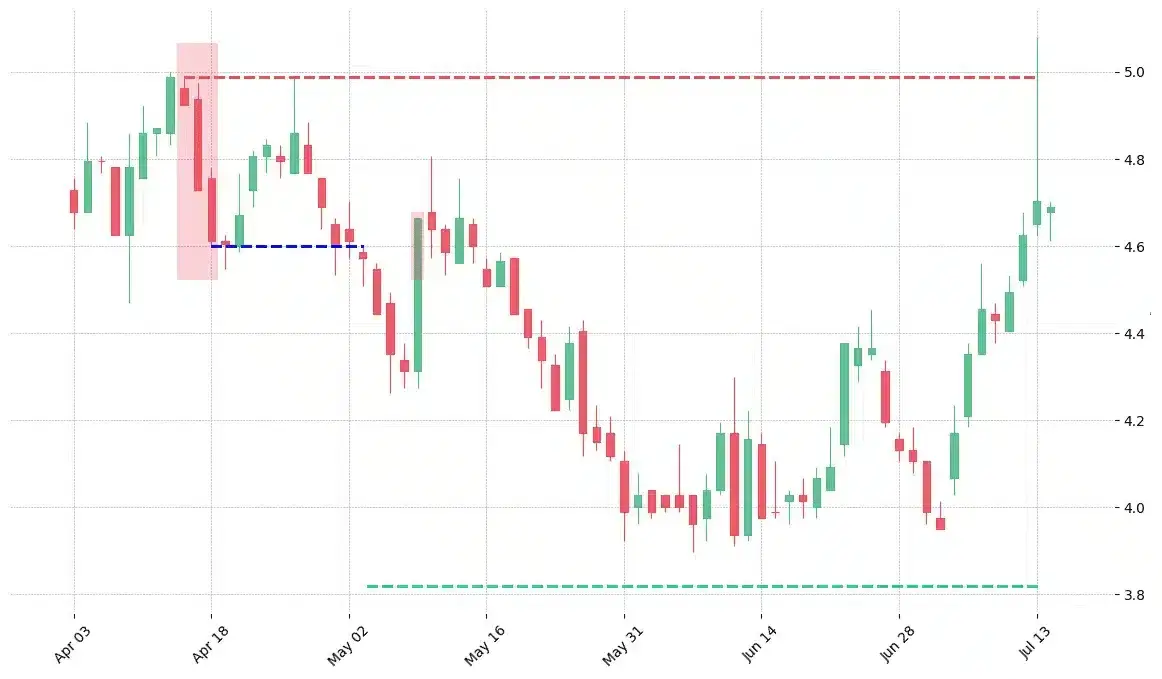
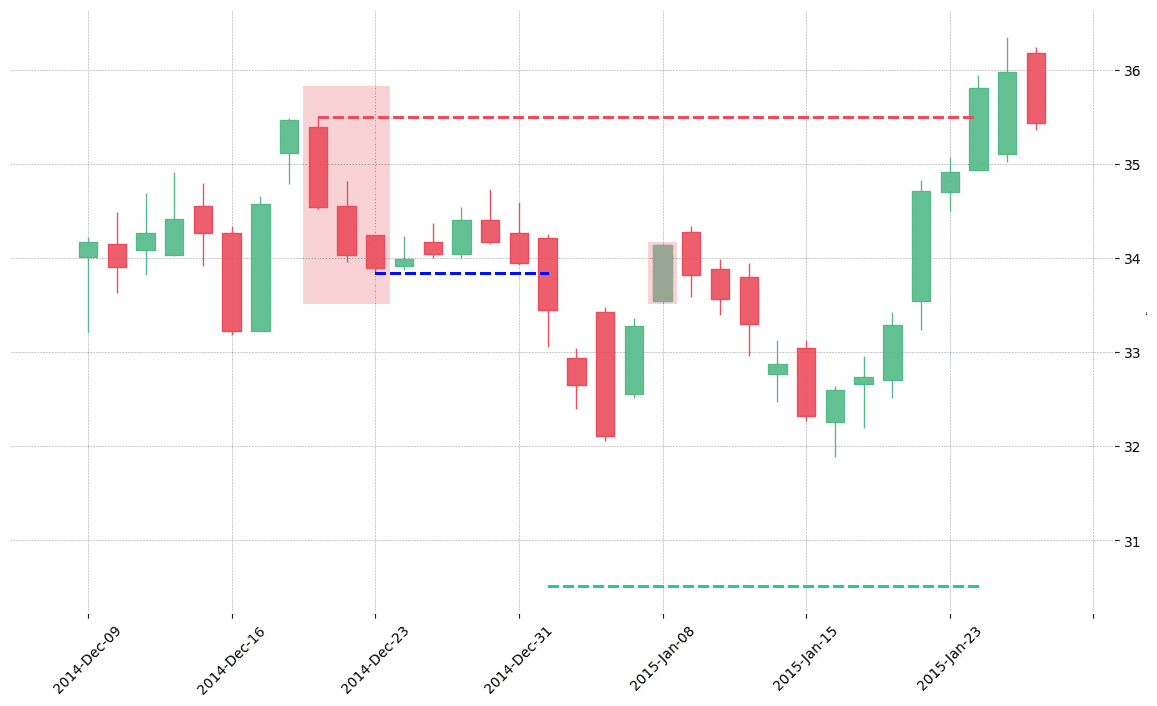
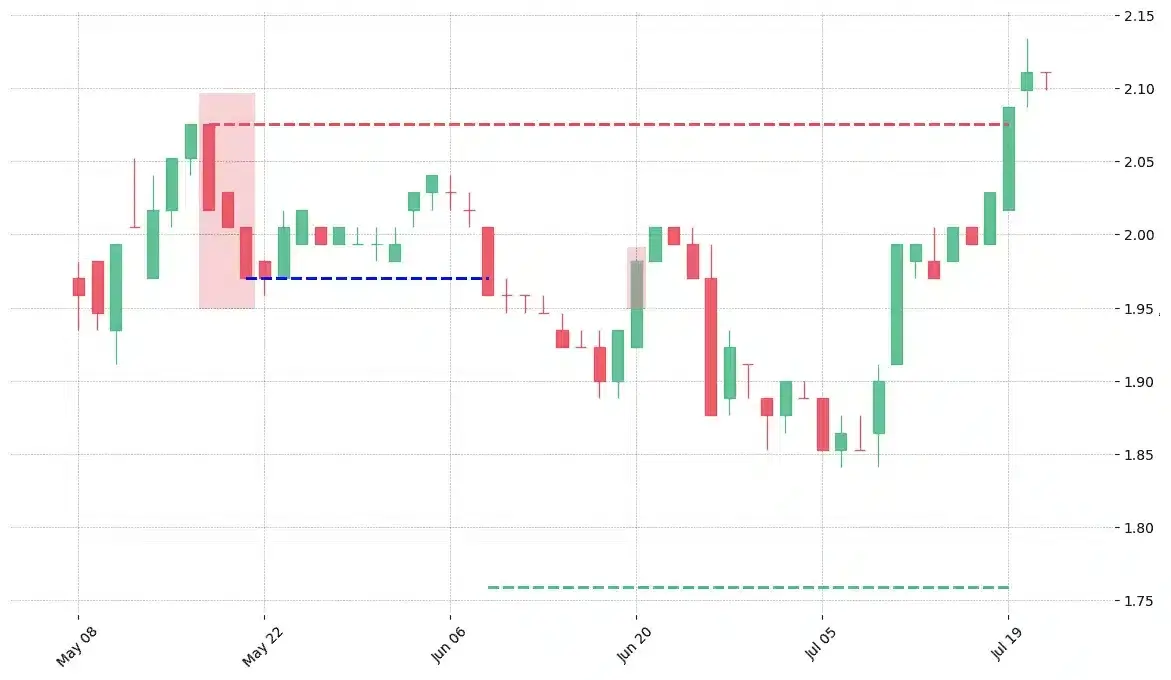
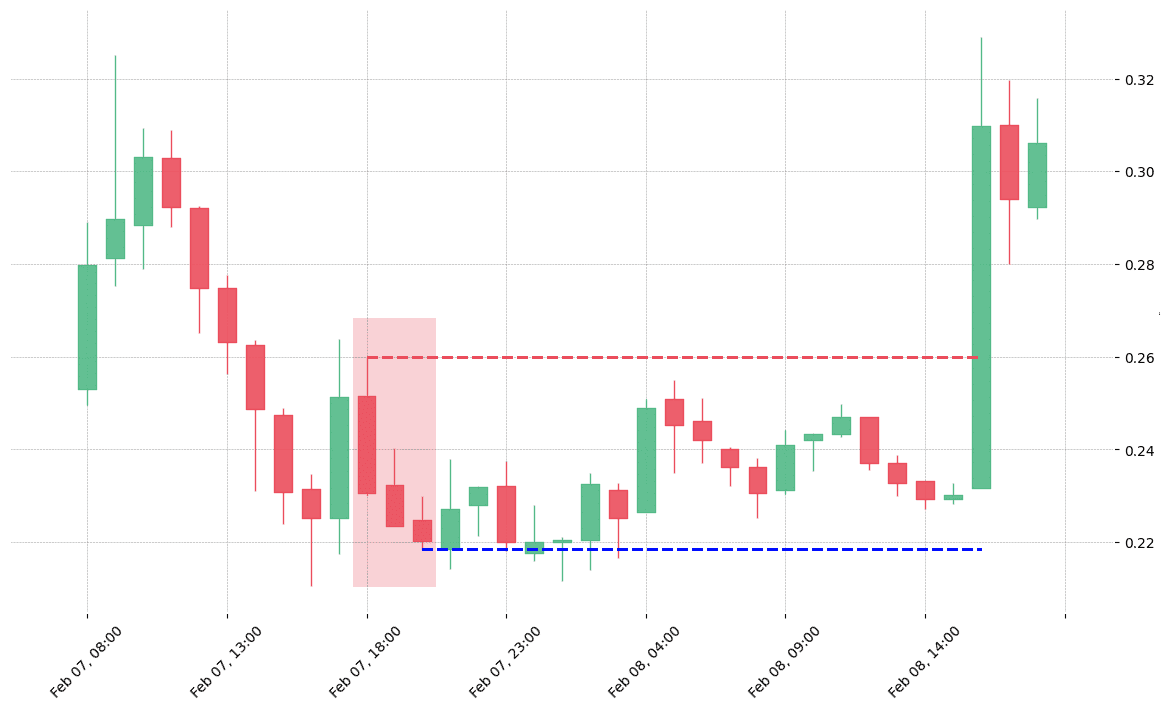
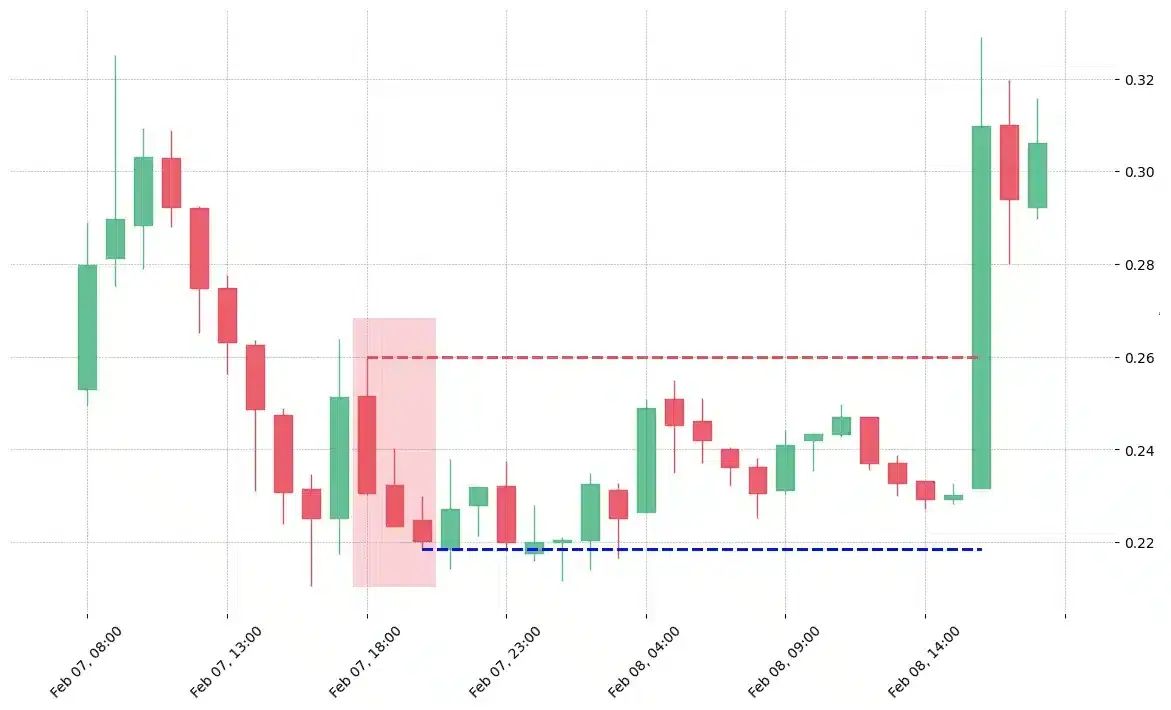
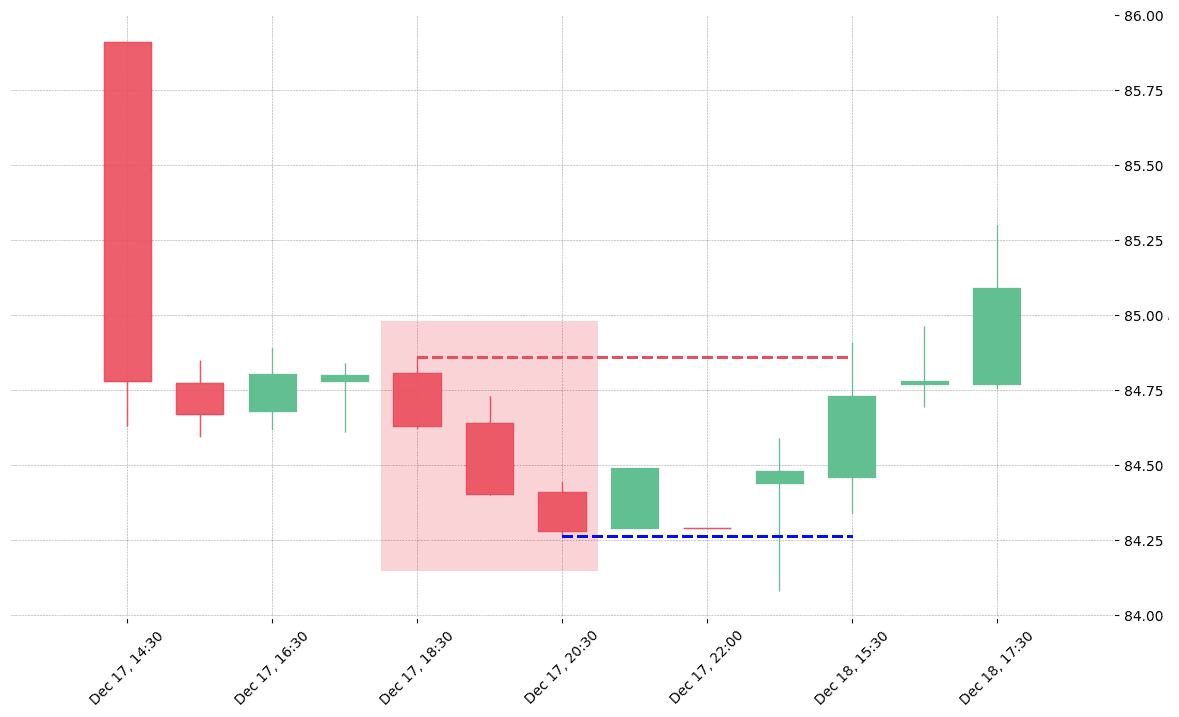
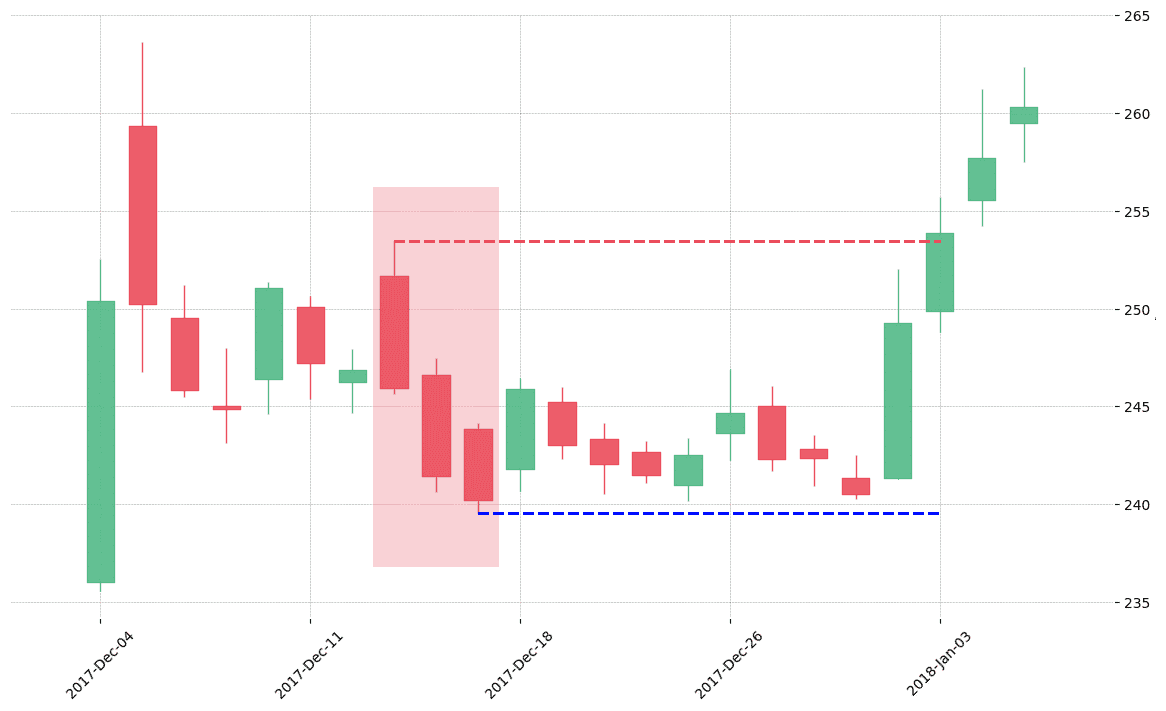
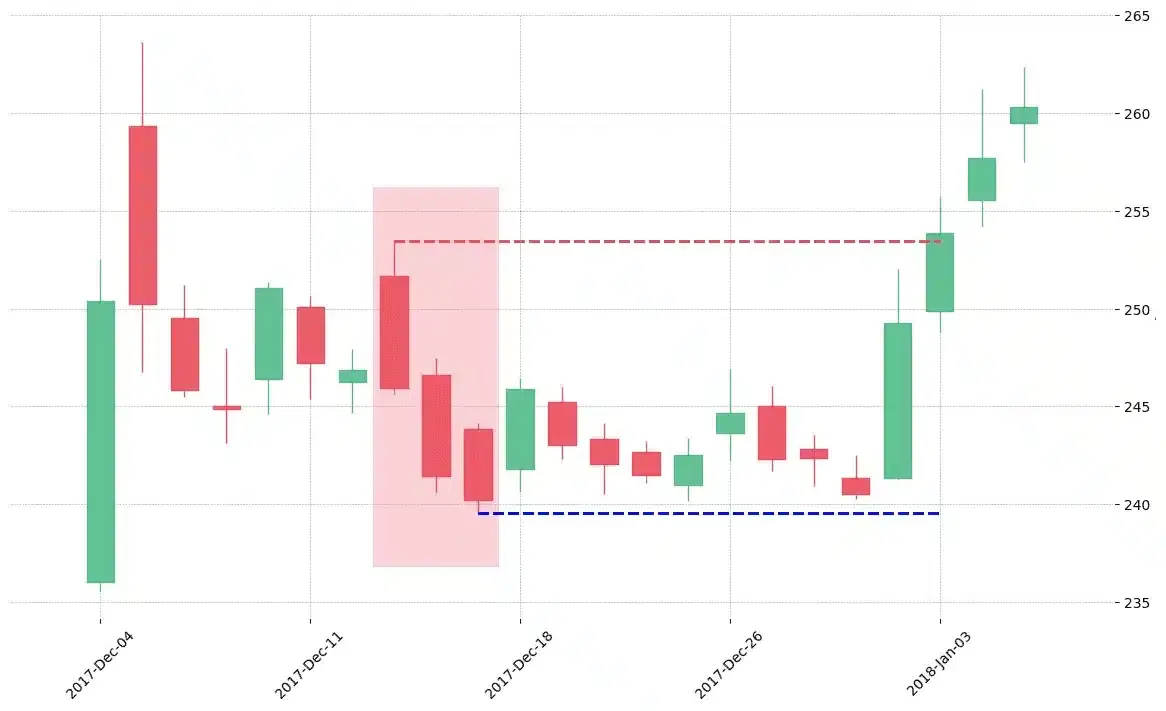
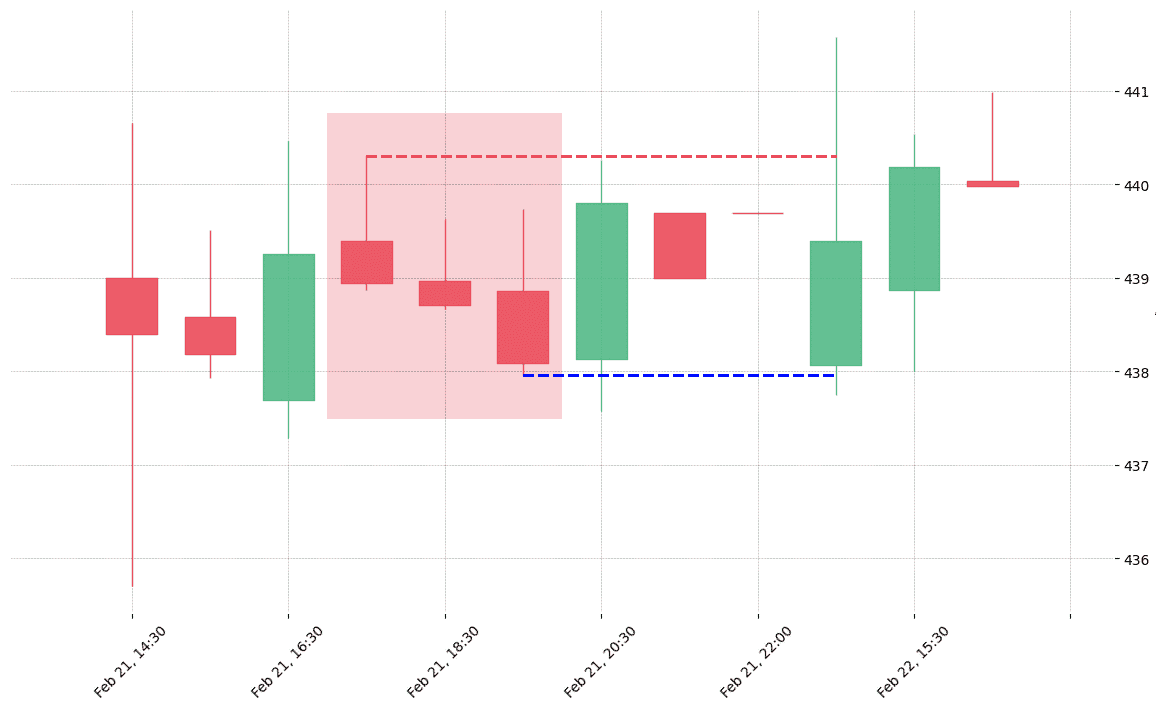
How does the Three Black Crows pattern look in real life?


Looking to learn more about this pattern?
You should take a look at Joe Marwood's online course. In his course, he backtested the 26 main candlestick patterns before to summarize which one is THE best pattern. I really liked his course and you shouldn't miss it!
Click here to signup to his "Candlestick Analysis For Professional Traders" course now!


 We loved Marwood Research’s course “Candlestick Analysis For Professional Traders“. Do you want to follow a great video course and deep dive into 26 candlestick patterns (and compare their success rates)? Then make sure to check this course!