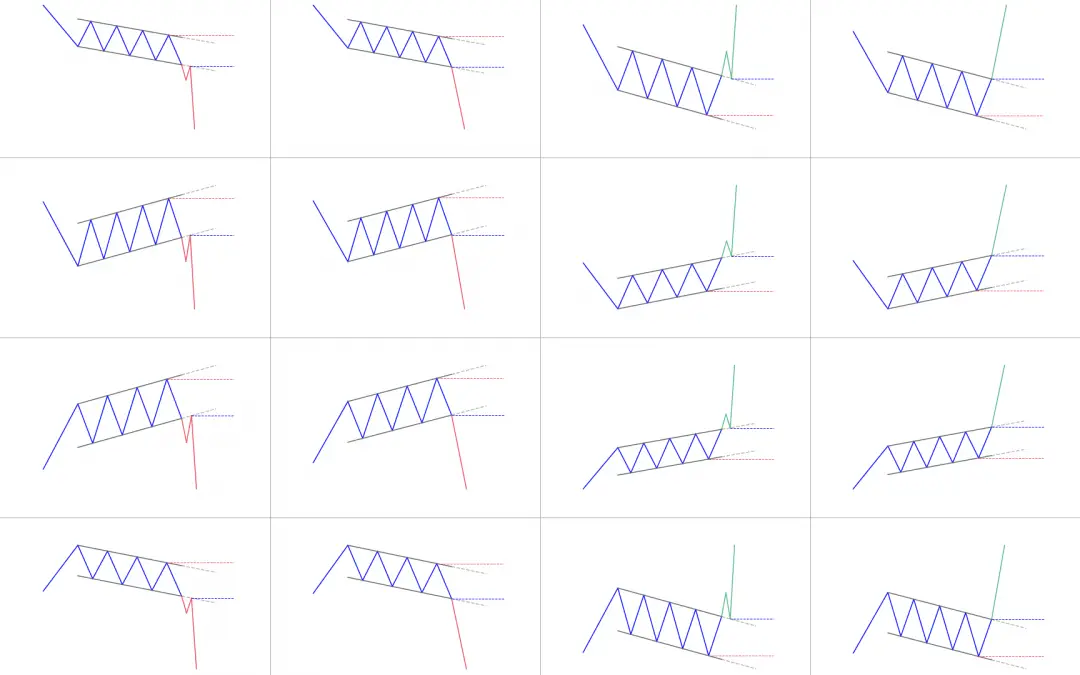
They come in different shapes and sizes but they all share something in common : they are well-known shapes you can draw in your price chart.
Every classical pattern detailed with their performance and reliability stats
Below you’ll find the ultimate database with every single classic pattern (you can find other types of pattern here: candlestick patterns or harmonic patterns). You’ll find detailed articles for each going into detailed explanation, giving you examples and data for each pattern. No more doubt about what makes a specific pattern and how well it works.
Moreover, this extensive cheat sheet will definitely give you an edge and let you understand and recognize every pattern. Plus at PatternsWizard, our absolute focus is to bring you data-driven performance statistics. So for most classic patterns (articles below) you’ll find data about each pattern’s performance statistics and reliability (how often they confirm, reach the target or stop, how often they appear, …) to adjust your trading strategy of financial markets.
What are classical patterns?
Classic, traditional or common patterns refer to the same kind of patterns.
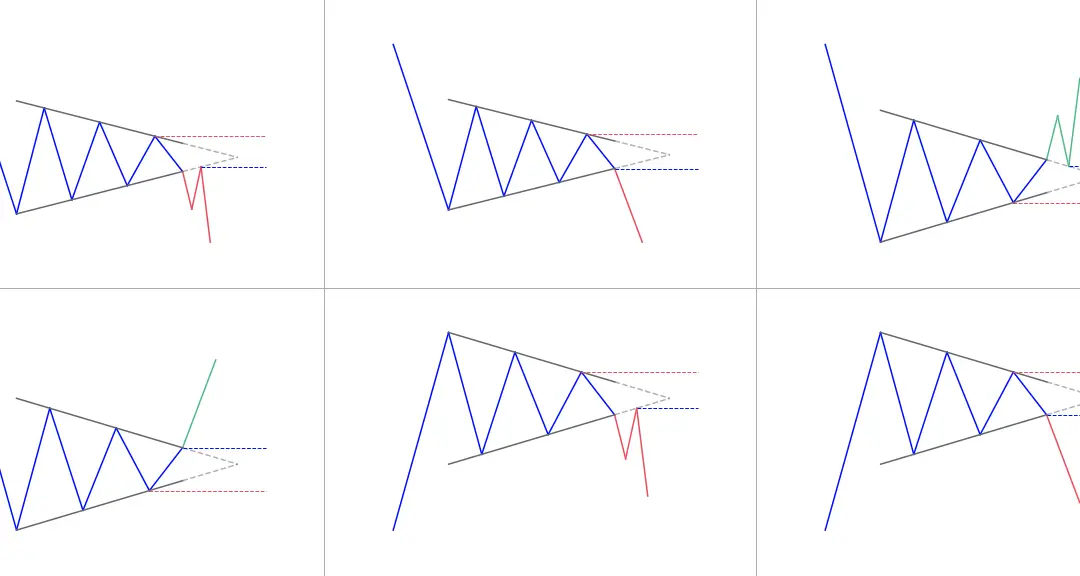
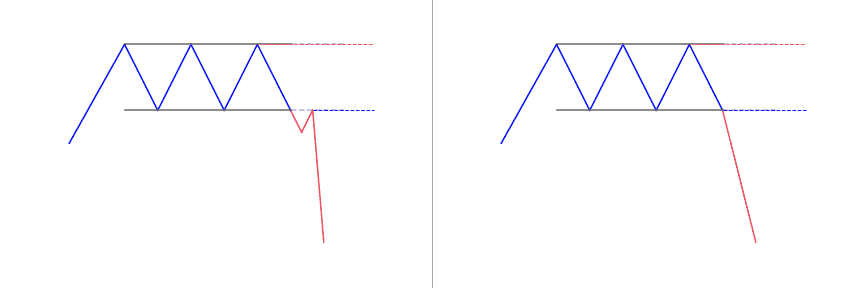
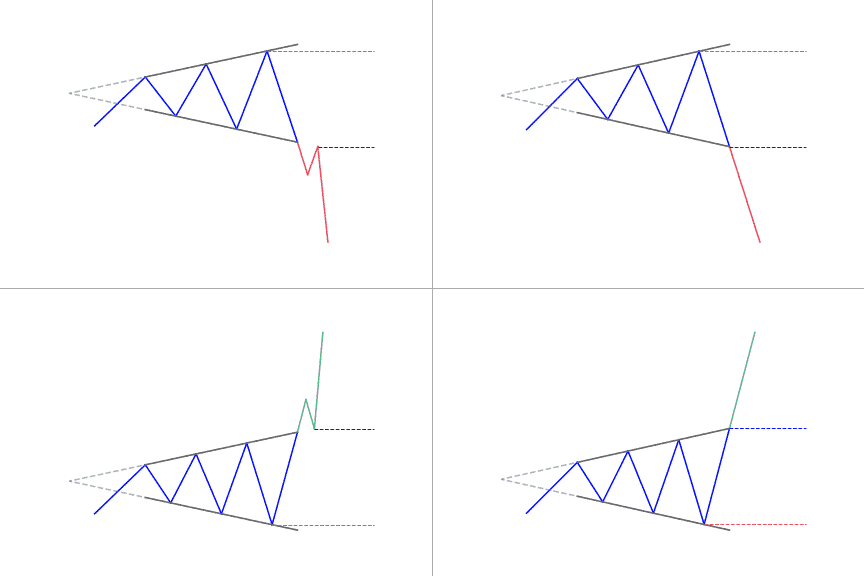
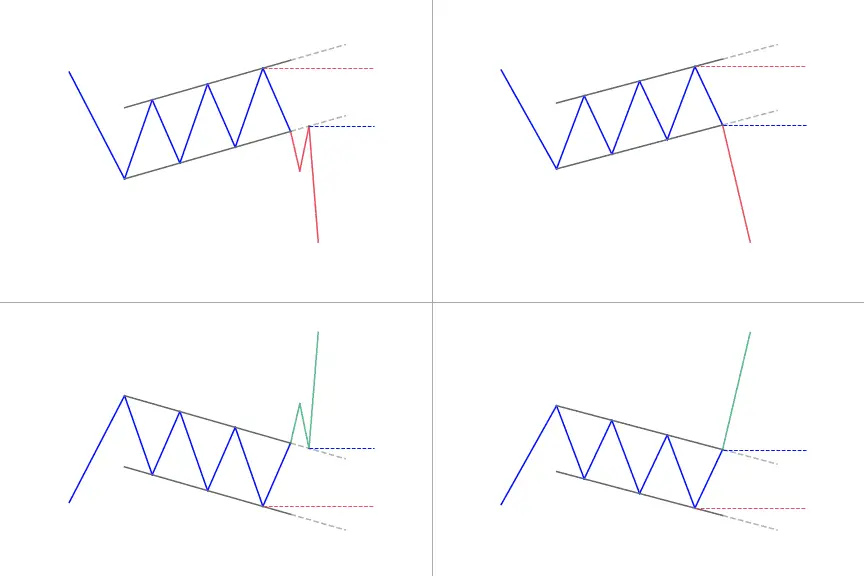
Classic chart patterns are aggregates of price drawing some well known forms.
They often form around support or resistance levels. These trend lines indicate areas where traders were interested in exchanging their assets holding and time + trades will draw these patterns.

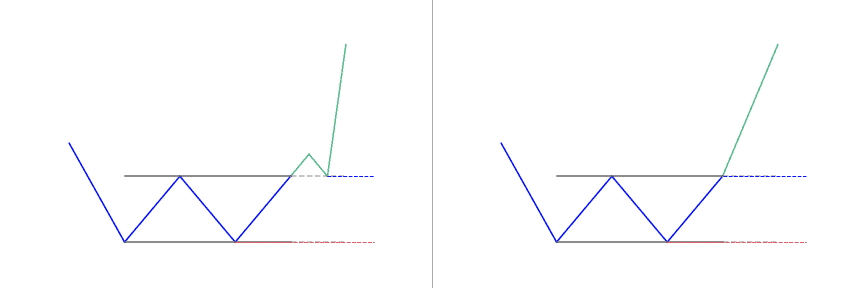
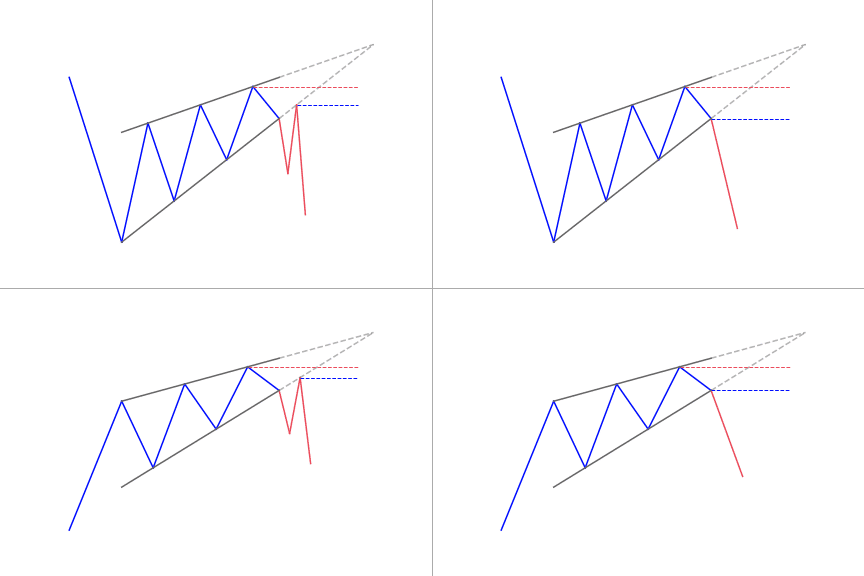
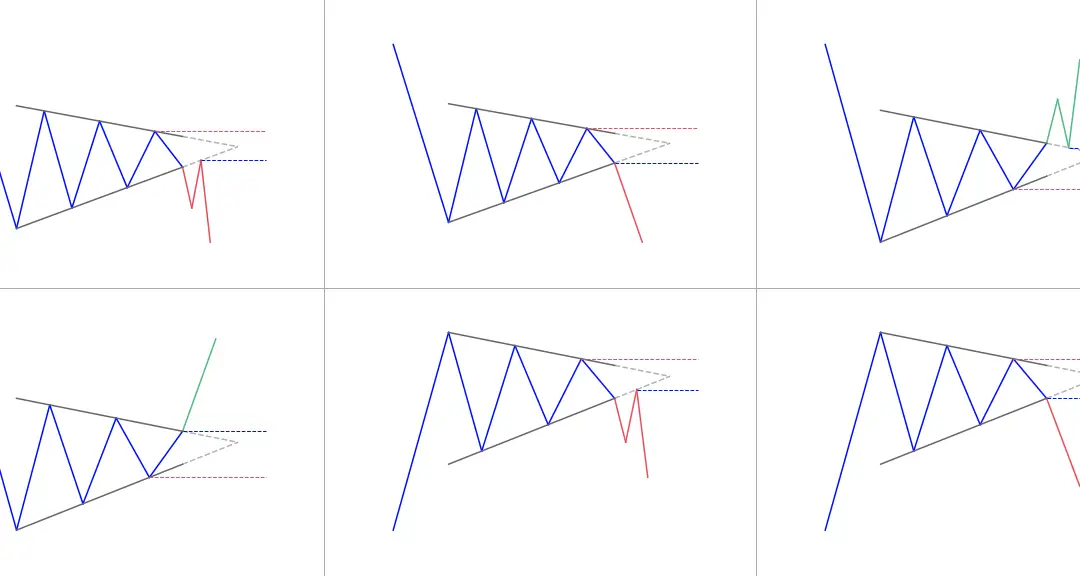
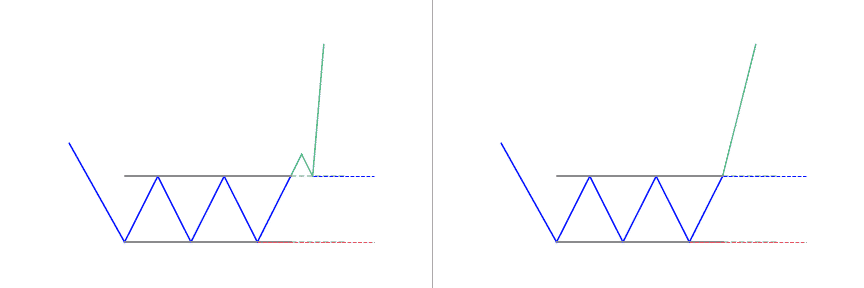
They are believed to be great indicators of market sentiment. Let’s consider for example an ascending triangle (as illustrated on the right). As time goes on traders step in to repeatedly sell at the same given high price (the horizontal resistance) and new buyers step in to repeatedly buy at new higher prices (the ascending trendline). It shows upward pressure and an expected move is a break up of the horizontal resistance level. Keep in mind technical analysis is probabilistic (hence why we created PatternsWizard) and it can sometimes not break out or do a false breakout.
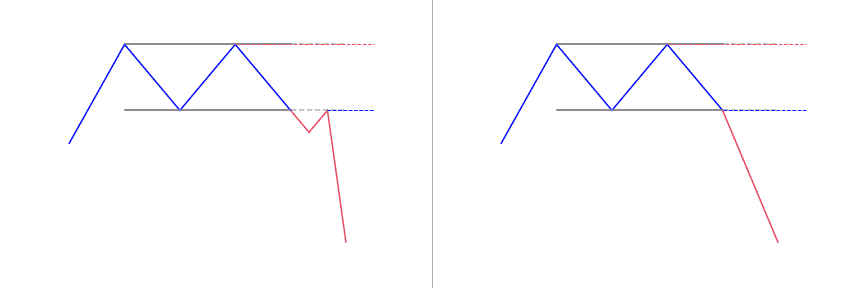
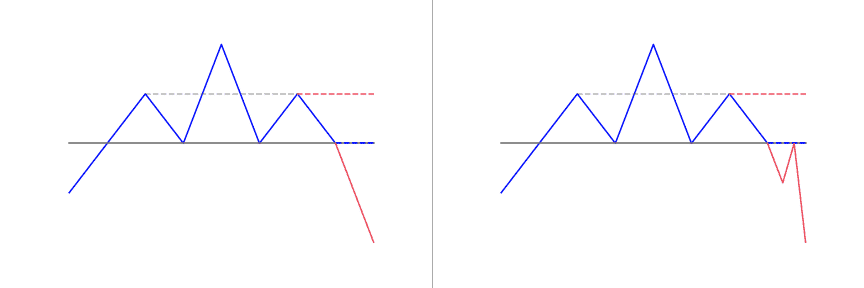
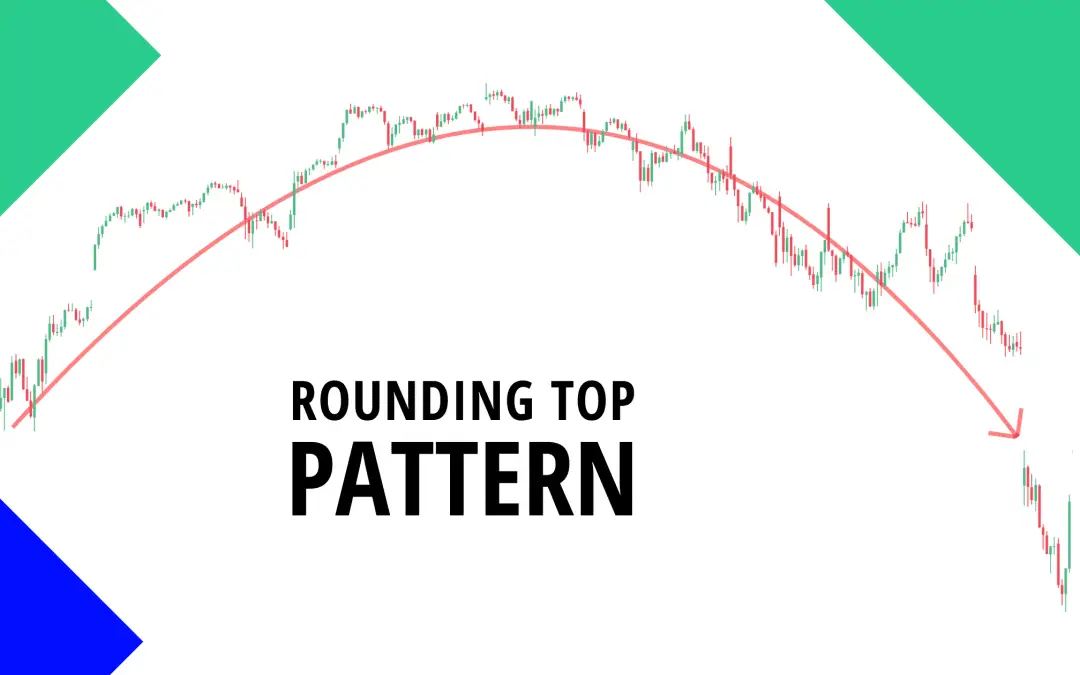
Some of the best known classical chart patterns are the head and shoulders pattern, the wedge pattern, the double top or triple bottom. They can form as a bullish pattern or a bearish pattern. For example a bearish reversal pattern (such as an inverted H&S) in an upper trend is a strong hint for a trend reversal to the down side. Same can apply to a bullish reversal pattern (in reverse).
How can they help you enhance your trading strategy?
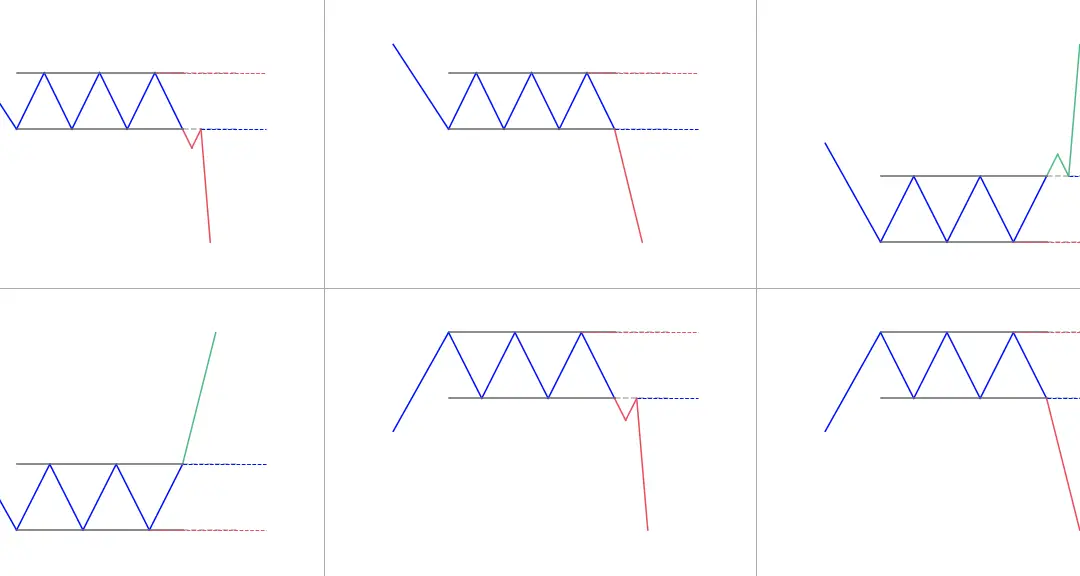
Depending on the pattern (each pattern can tell a different story), they can be a hint for :
- Reversal pattern : it predicts price will reverse and move in the opposite direction.
- Continuation pattern : it predicts price will continue its move in the same direction.
Regardless of the pattern(s) you’d like to hunt and trade, you’ll need a reliable source to chart your markets. TradingView is the best solution for you! As you may have noticed, most of our charts on the site are taken from charts created on TradingView. Click here to check TradingView for free now!
Patterns help you better predict and understand what the markets will do. Learn about classic patterns so you can get an edge in the market and profit from your trading.
Want to go into the details of a specific pattern? You’re at the right place!
These patterns often have very illustrative names. Feel free to discover the detailed article for each classic pattern right below :
 Good Trading requires the Best Charting Tool!
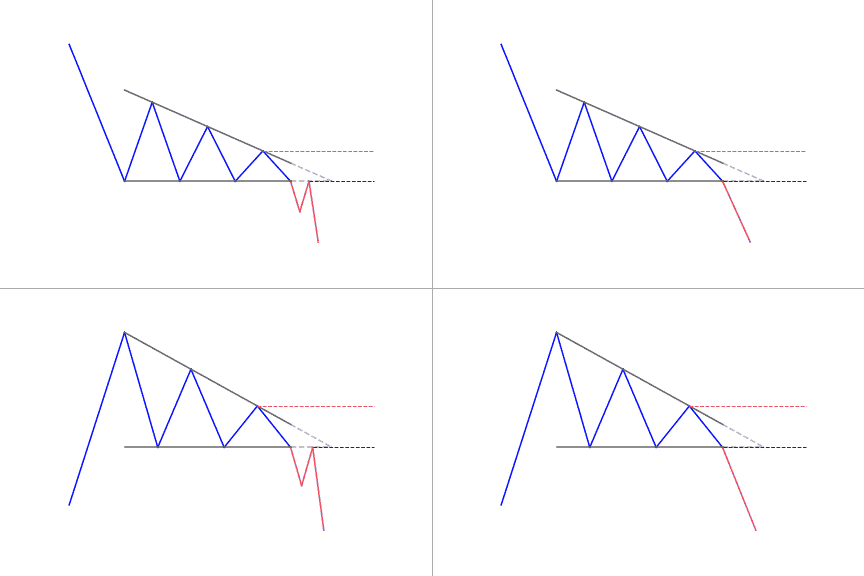
![Ascending Triangle Pattern: Full Guide [2022]](https://patternswizard.com/wp-content/uploads/2020/05/ascendingtriangle.png)
![Falling Wedge Pattern: Ultimate Guide [2022]](https://patternswizard.com/wp-content/uploads/2020/05/fallingwedge.png)
 We loved Marwood Research’s course “Candlestick Analysis For Professional Traders“. Do you want to follow a great video course and deep dive into 26 candlestick patterns (and compare their success rates)? Then make sure to check this course!
