Spinning Top Candlestick Pattern: What is it?

Candlestick patterns

Spinning top pattern

The Spinning Top candlestick pattern is a versatile single candle pattern. It is versatile and mysterious because of its formation that can occur at the peak of an uptrend, in the very middle of a trend, or at the bottom of a downtrend.

It is a small candlestick pattern that can be both, a bearish or bullish pattern. This pattern is formed when opening and closing prices are almost similar or very close to each other. It also illustrates that there is indecision among traders in the uptrend, downtrend, or during a trend.

Like most of the other patterns, it also suggests the imminent change in trend. Experts emphasize that the Spinning Top pattern just shows the state of confusion among traders about the direction of the market. Therefore, it should not be taken as a continuation or reversal signal.

  • The Spinning Top pattern is a symmetrical candlestick reversal pattern.
  • The candle body should be small and both shadows should be about the same size.
  • It’s the sign of indecision (as for a doji).

Statistics to prove if the Spinning Top pattern really works

Are the odds of the Spinning Top pattern in your favor?


How does the Spinning Top behave with a 2:1 target R/R ratio?

Success rate

From our research the Spinning Top pattern confirms 42.7% of the time on average overall all the 4120 markets we analysed. Historically, this patterns confirmed within 3.2 candles or got invalidated within 2.9 candles. If confirmed, it reached the 2:1 R/R target 42.4% of the time and it retested it's entry price level 89.3% of the time.
Not accounting for fees, it has an expected outcome of 0.271 $/$. It means for every $100 you risk on a trade with the Spinning Top pattern you make $27.1 on average.
Want to account for your trading fees? Have the detailled stats for your favorite markets / timeframes? Or get the stats for another R/R than 2:1?
🚀 Join us now and get fine-tuned stats you care about!

How to handle risk with the Spinning Top pattern?


We analysed 4120 markets for the last 59 years and we found 1 134 089 occurrences of the Spinning Top pattern.
On average markets printed 1 Spinning Top pattern every 14 candles.

For 2:1 R/R trades, the longest winning streak observed was 30 and the longest losing streak was 157. A trading strategy relying solely on this pattern is not advised. Anyway, make sure to use proper risk management.

Stack the odds in my favor NOW!

Keep in mind all these informations are for educational purposes only and are NOT financial advice.

If you want to learn more and deep dive into candlestick patterns performance statistics, I strongly recommend you follow the best available course about it. Joe Marwood (who's a famous trader with more than 45 000 Twitter followers) created an online course called "Candlestick Analysis For Professional Traders" in his Marwood Research University. There he will take you through the extensive backtesting of the 26 main candlestick patterns. He then summarizes which one is THE best pattern. Do you know which one it is?
Remember, don't trade if you don't know your stats. Click here to signup to the course now!

How a Spinning Top candlestick pattern is formed? 

The single candle of the Spinning Top candlestick has long wicks that extend higher and lower its short body. Such a pattern is formed when the prices rapidly move in one direction before a sudden reversal of the trend in an inverse direction.

For example, when bulls try to push prices high followed by the efforts of bears to pull prices back before the closure of the market. As closing prices in the market settle near the opening prices, therefore, this pattern shows a draw between both sides. 

How to identify a Spinning Top candlestick pattern? 

The Spinning Top candlestick pattern is comparatively easy to identify just like the Doji candlestick pattern. It has the same structure and logic as the simple Doji pattern. However, it has a wider candle body which exhibits a significant movement in market prices during the period of the candle. In short, if a candlestick pattern has a wider body with almost equal-sized long wicks at both sides, it is your Spinning Top candlestick pattern.

What does the pattern tell traders? 

The Spinning Top candlestick pattern is advantageous for the traders in the sense that it is much stronger in a trending market. Whether it be in an uptrend or a downtrend, it indicates a balance of bullish and bearish forces. It tells traders that the opposite direction of the market has the potential to grow in the market. Hence, it makes the short-term outcome very uncertain.

Again in this pattern, the key is the next candle. The next candle should be the opposite of the current trend in the market. If so is the case, it is important to search for a candle in the same direction. It will confirm that the price action will continue in the same direction. 

How to trade the pattern?

During an uptrend, the Spinning Top candlestick pattern shows a possible reversal because of fewer potential buyers. During a downtrend, it also indicates a price reversal because of fewer sellers in the market. In either case, technical analysts emphasize that traders should wait for a confirmation signal before initiating a trade.

Moreover, it is advised to use derivatives such as spread bets. Derivatives do not allow ownership of the underlying assets but tracking price movements gets easy. This means that it becomes easy for you to trade rising and falling markets after both, bullish Spinning Top candlestick pattern and bearish Spinning Top candlestick pattern. 

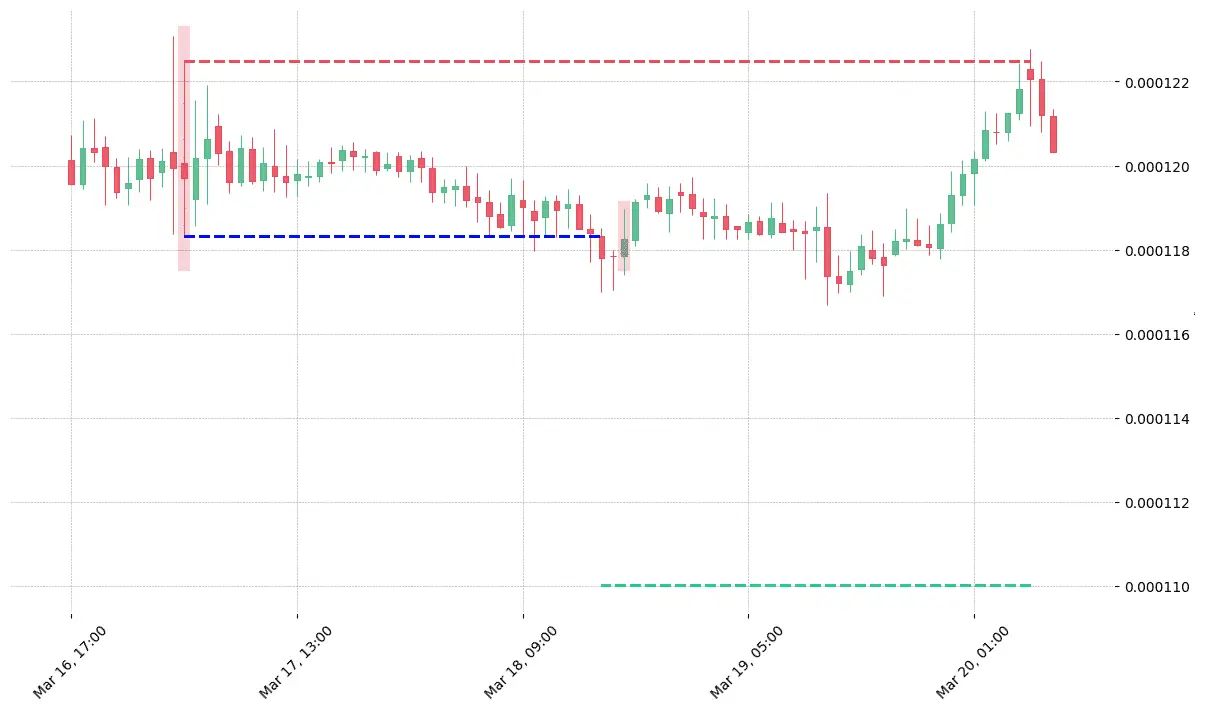
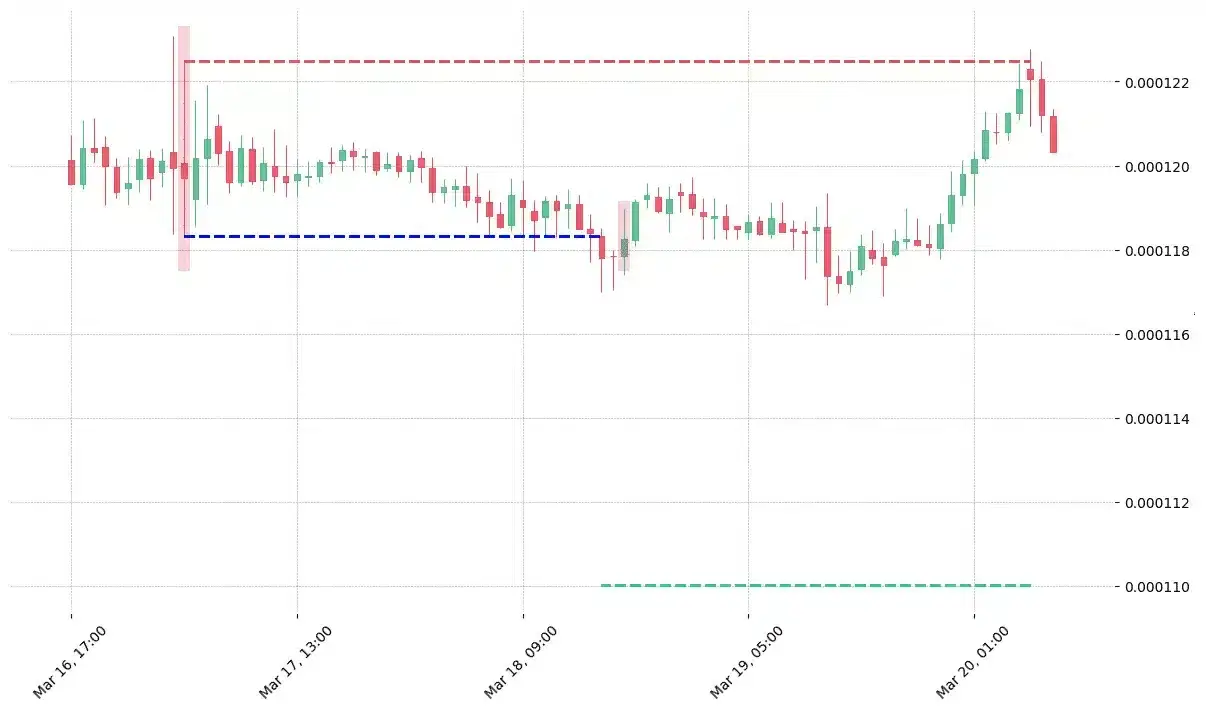
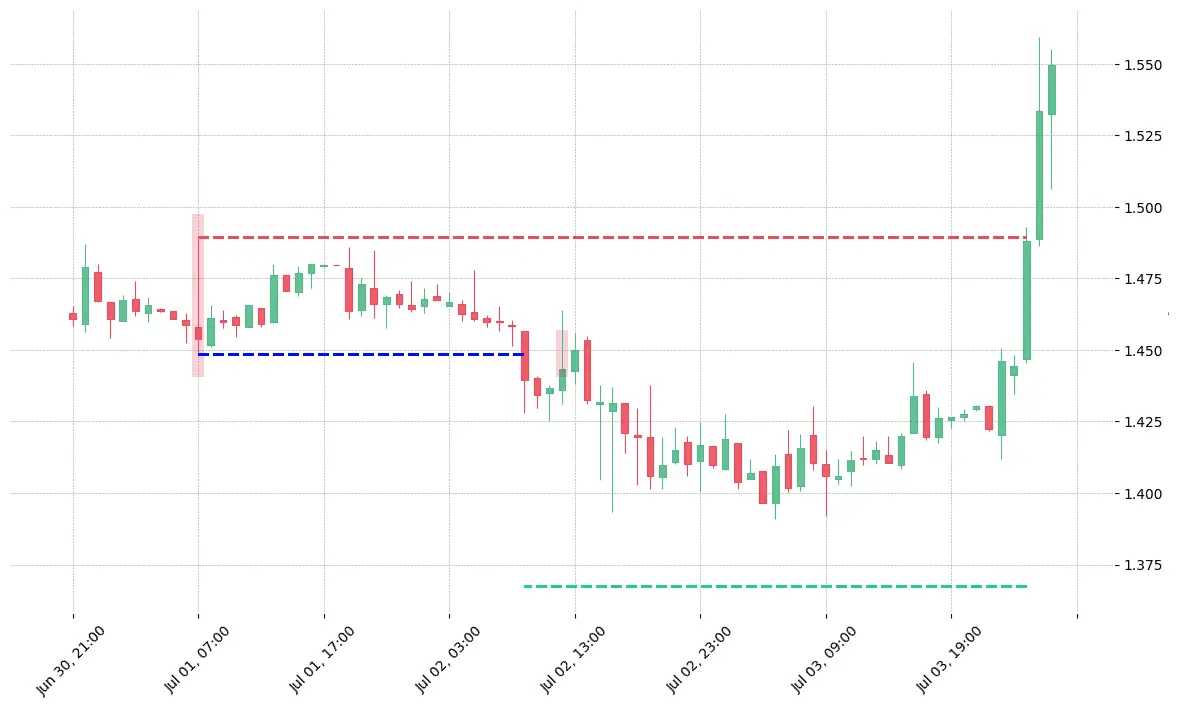
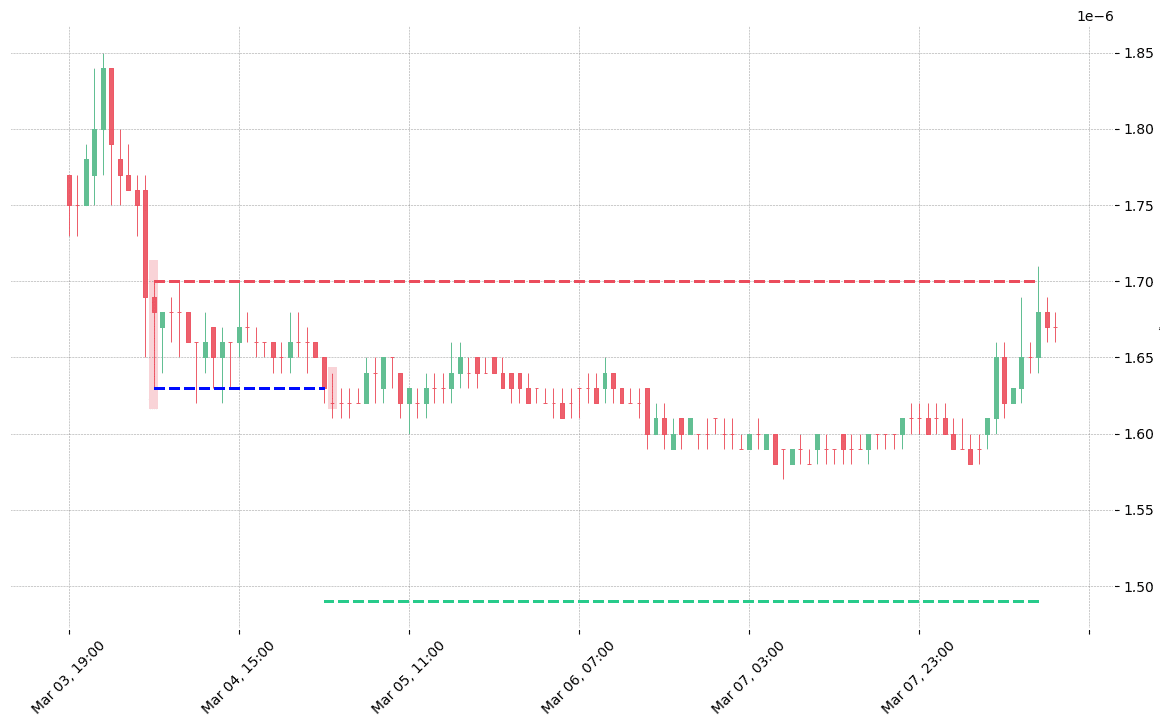
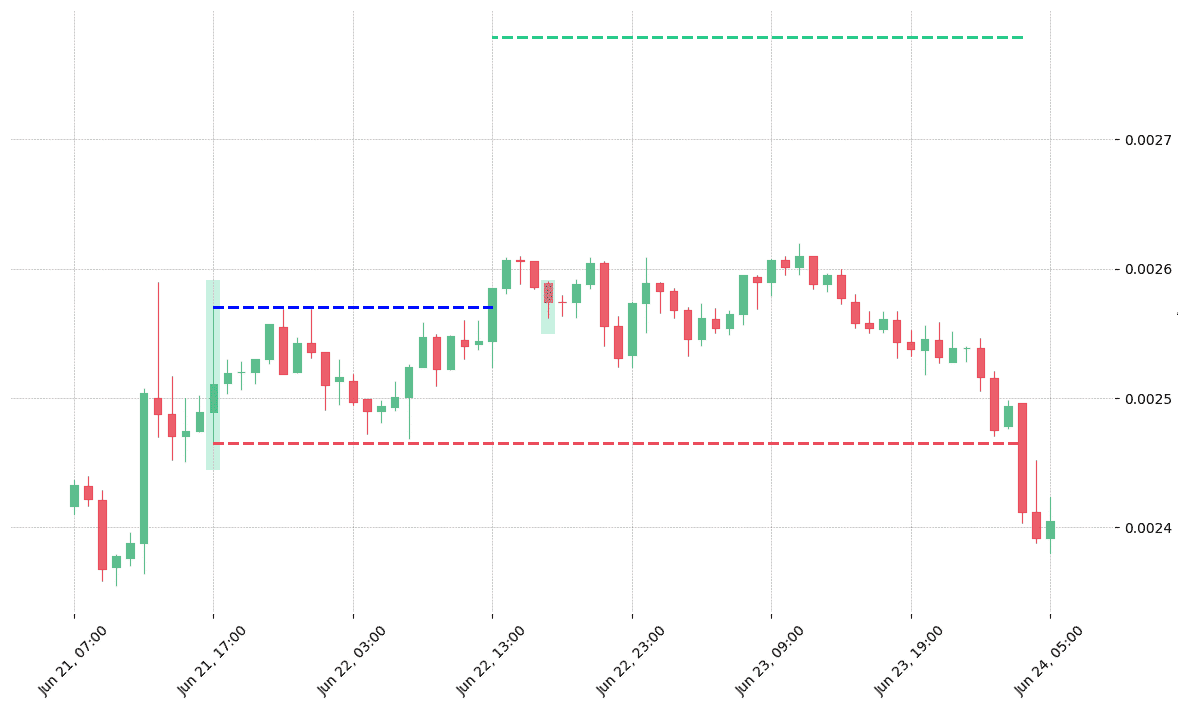
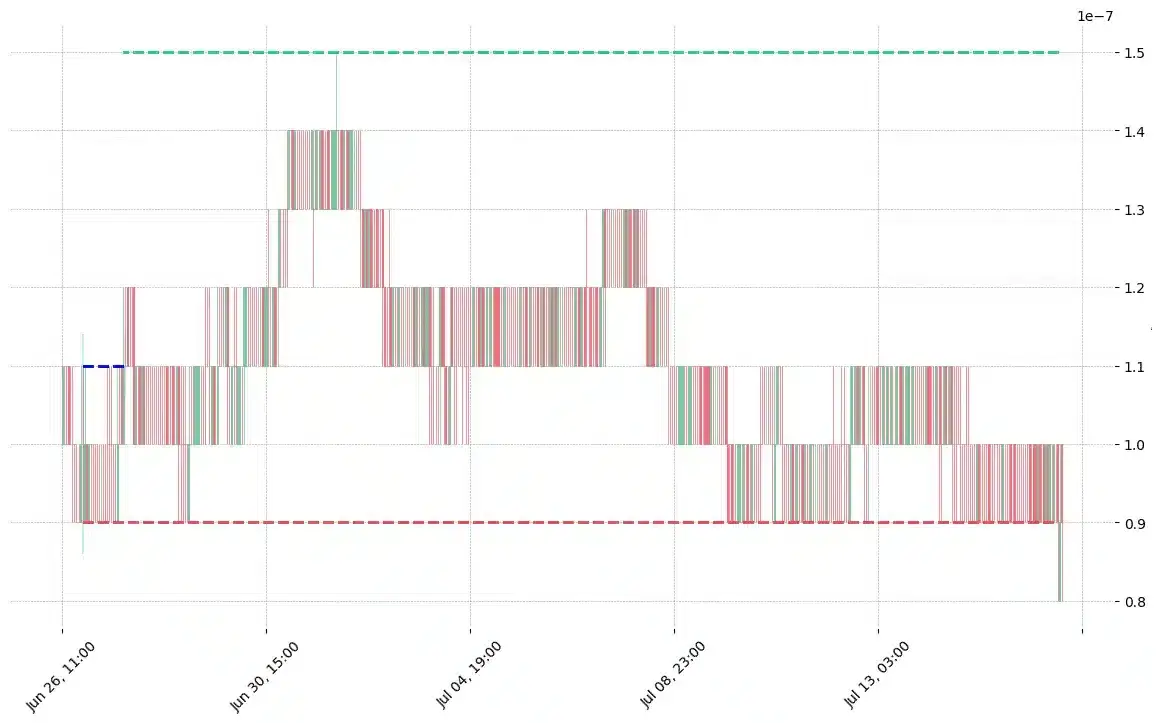
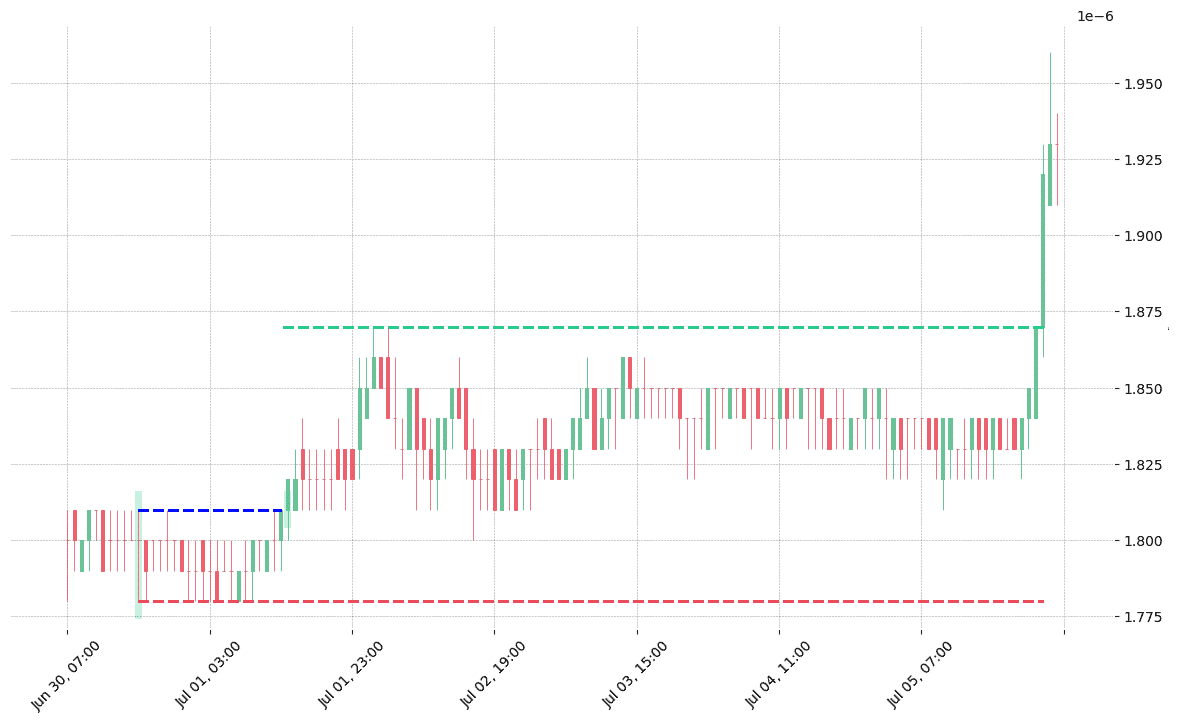
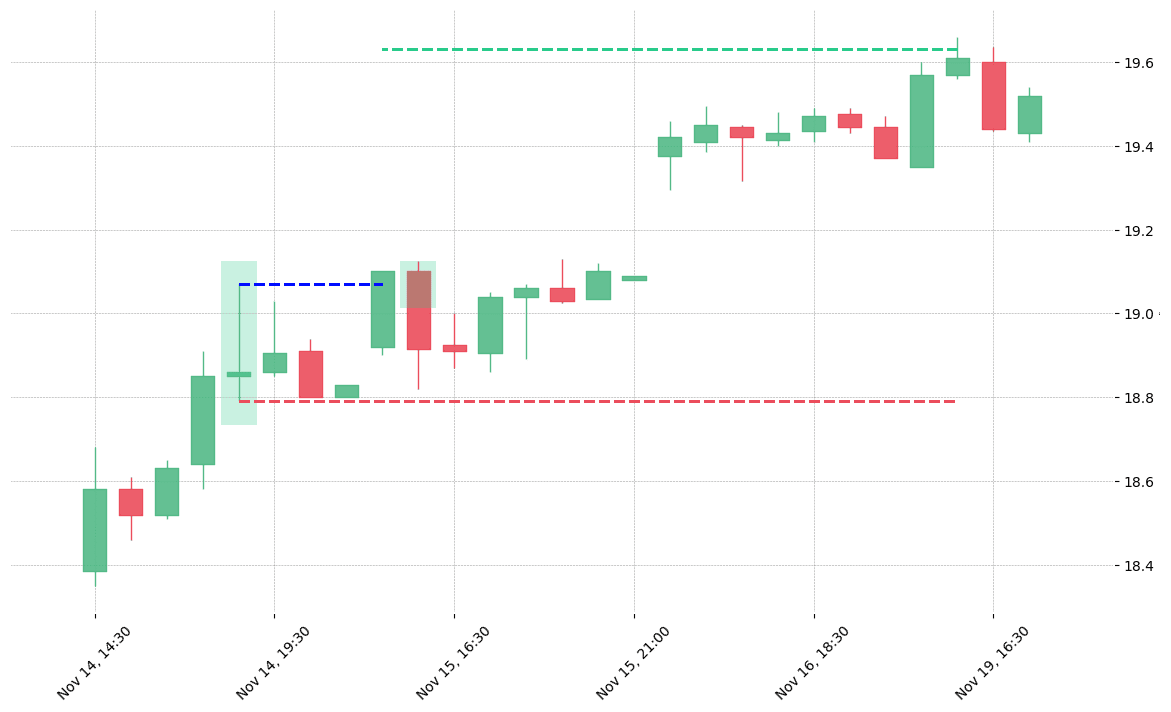
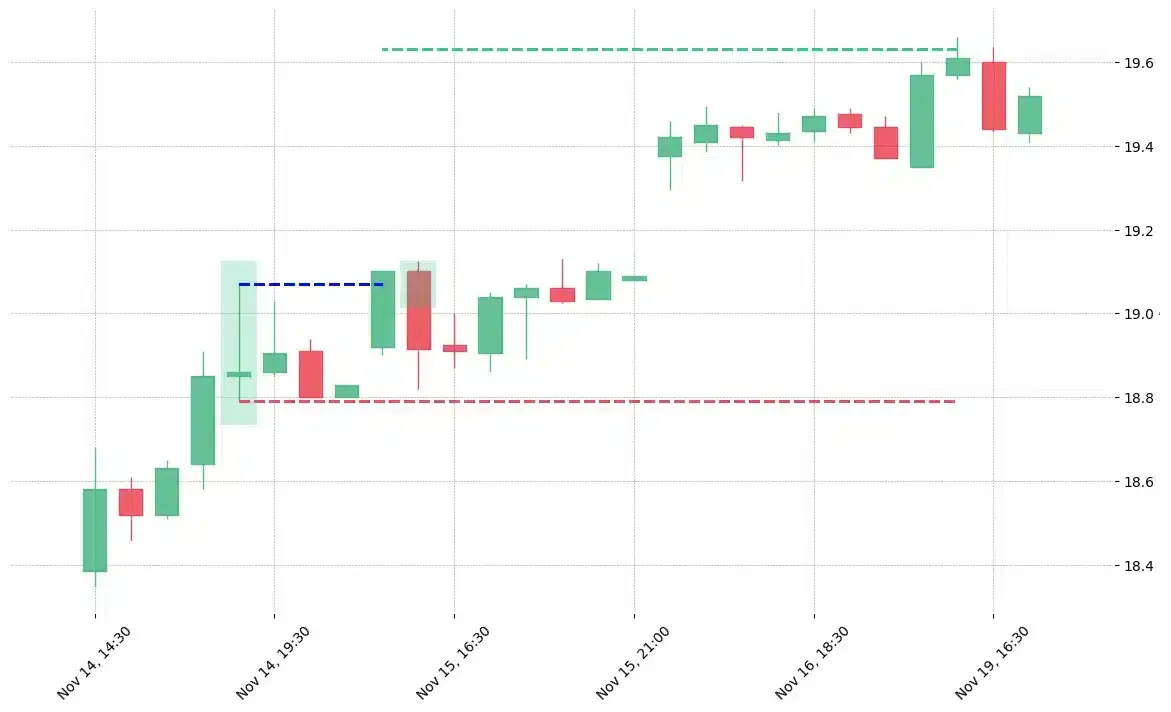
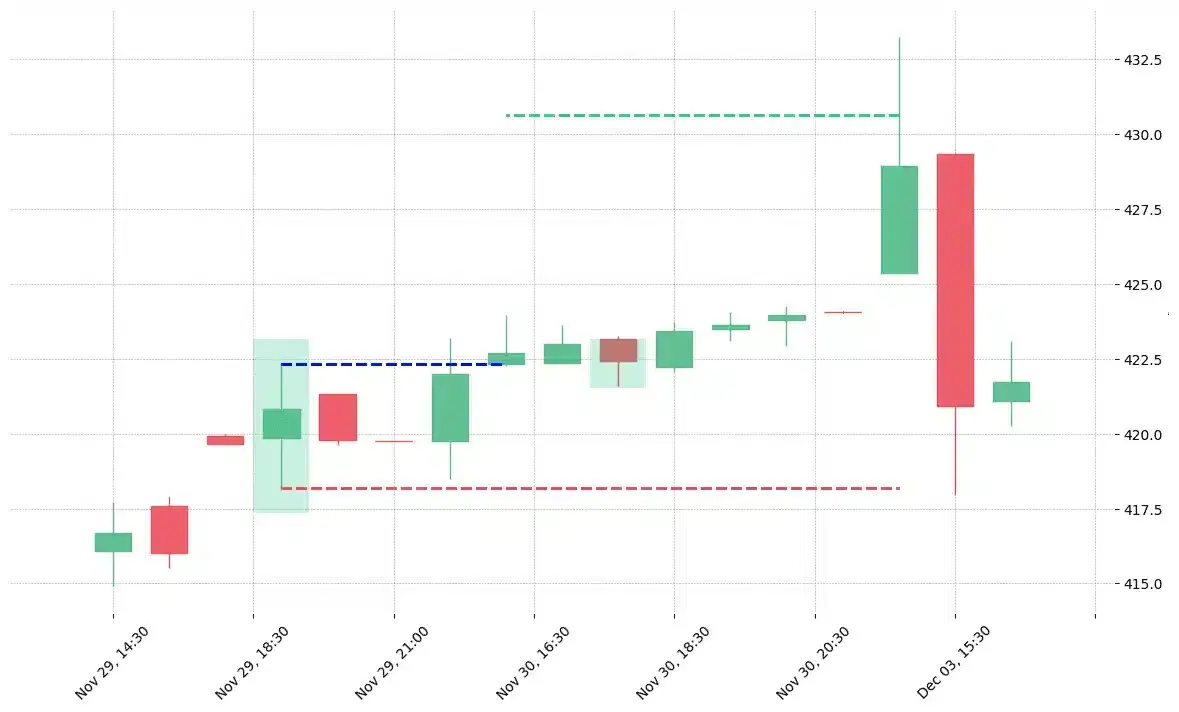
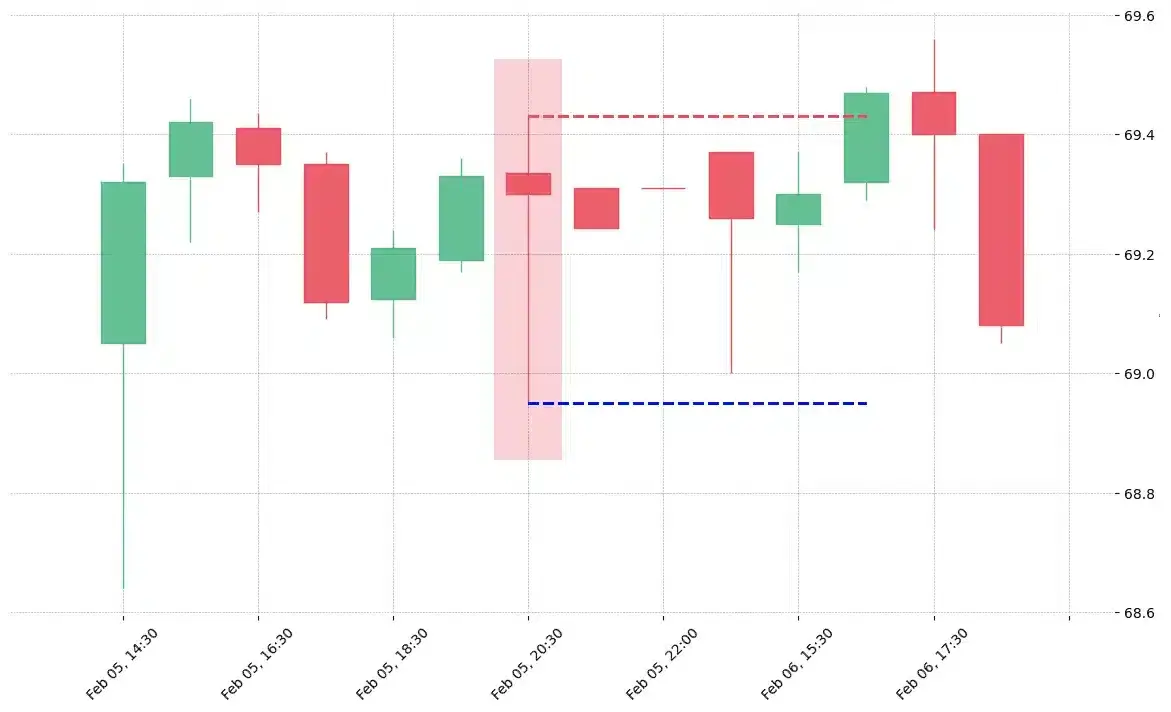
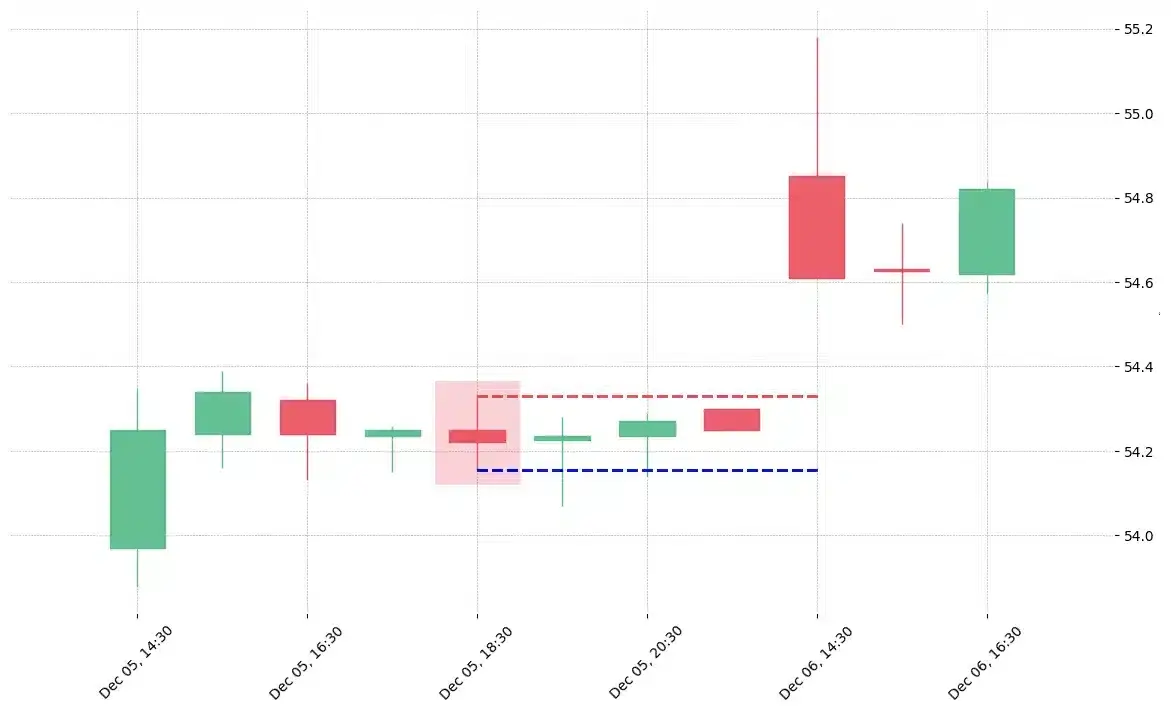
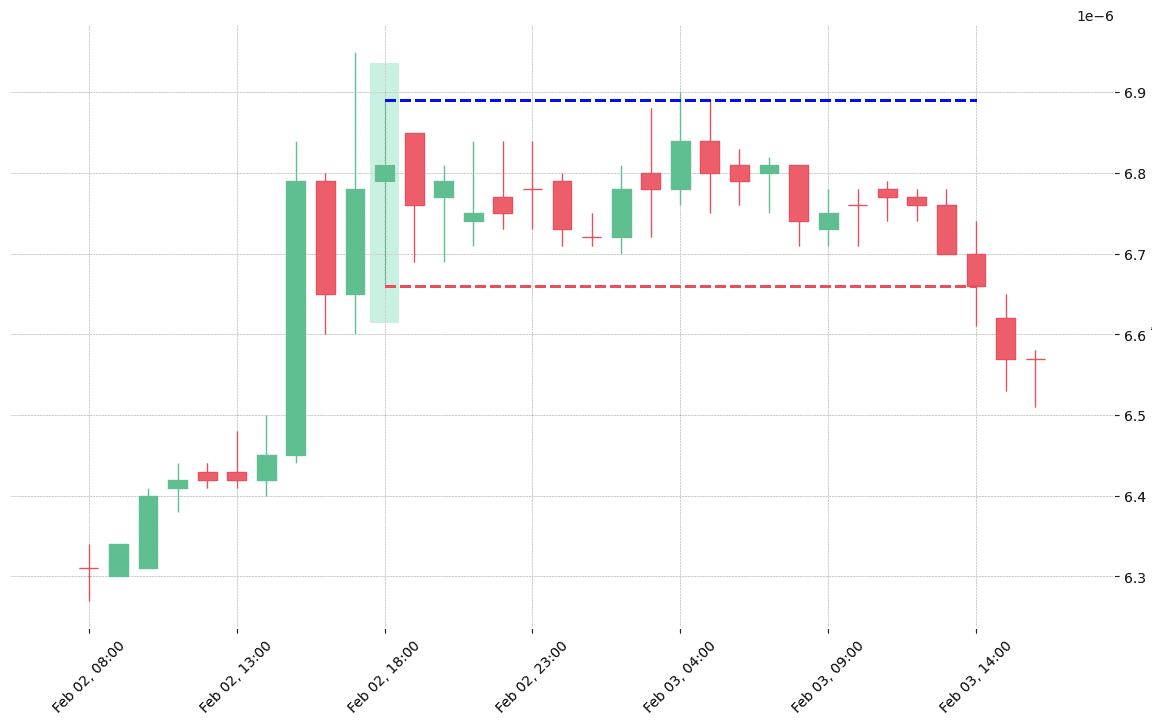
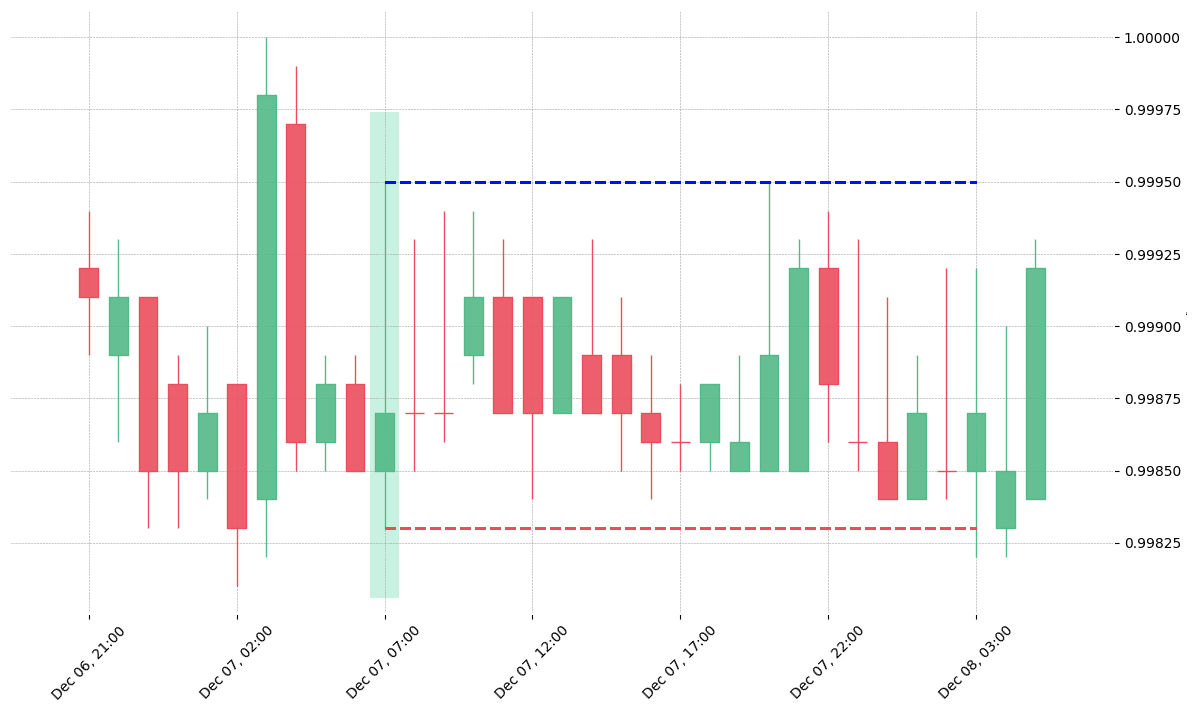
How does the Spinning Top pattern look in real life?

The cryptocurrency pair LINK/BTC printed a bearish Spinning Top on 2019-03-17 03:00:00. It confirmed on 2019-03-18 16:00:00 (meaning price closed below entry level). It retested the trade entry level on 2019-03-18 18:00:00. Then it failed to reach the 2:1 R/R target and got stopped on 2019-03-20 06:00:00.
The cryptocurrency pair OMG/USDT printed a bearish Spinning Top on 2020-07-01 07:00:00. It confirmed on 2020-07-02 09:00:00 (meaning price closed below entry level). It retested the trade entry level on 2020-07-02 12:00:00. Then it failed to reach the 2:1 R/R target and got stopped on 2020-07-04 01:00:00.
The cryptocurrency pair XVG/BTC printed a bearish Spinning Top on 2019-03-04 05:00:00. It confirmed on 2019-03-05 01:00:00 (meaning price closed below entry level). It retested the trade entry level on 2019-03-05 02:00:00. Then it failed to reach the 2:1 R/R target and got stopped on 2019-03-08 13:00:00.
The cryptocurrency pair BNB/BTC printed a bullish Spinning Top on 2018-06-21 17:00:00. It confirmed on 2018-06-22 13:00:00 (meaning price closed above entry level). It retested the trade entry level on 2018-06-22 17:00:00. Then it failed to reach the 2:1 R/R target and got stopped on 2018-06-24 03:00:00.
The cryptocurrency pair BTT/BTC printed a bullish Spinning Top on 2019-06-26 21:00:00. It confirmed on 2019-06-27 17:00:00 (meaning price closed above entry level). It retested the trade entry level on 2019-06-27 18:00:00. Then it failed to reach the 2:1 R/R target and got stopped on 2019-07-16 19:00:00.
The cryptocurrency pair TRX/BTC printed a bullish Spinning Top on 2020-06-30 17:00:00. It confirmed on 2020-07-01 13:00:00 (meaning price closed above entry level). It retested the trade entry level on 2020-07-01 14:00:00. Then it successfully reached the 2:1 R/R target.
The etf GDX printed a bullish Spinning Top on 2018-11-14 18:30:00. It confirmed on 2018-11-15 14:30:00 (meaning price closed above entry level). It retested the trade entry level on 2018-11-15 15:30:00. Then it successfully reached the 2:1 R/R target.
The stock SHW printed a bullish Spinning Top on 2018-11-29 19:30:00. It confirmed on 2018-11-30 15:30:00 (meaning price closed above entry level). It retested the trade entry level on 2018-11-30 17:30:00. Then it successfully reached the 2:1 R/R target.
The stock ES printed a bearish Spinning Top on 2019-02-05 20:30:00. Unfortunately it invalidated on 2019-02-06 16:30:00 before the trade could trigger (it triggered the stop before entering).
The stock NCLH printed a bearish Spinning Top on 2019-12-05 18:30:00. Unfortunately it invalidated on 2019-12-06 14:30:00 before the trade could trigger (it triggered the stop before entering).
The cryptocurrency pair QLC/BTC printed a bullish Spinning Top on 2019-02-02 18:00:00. Unfortunately it invalidated on 2019-02-03 14:00:00 before the trade could trigger (it triggered the stop before entering).
The cryptocurrency pair USDC/USDT printed a bullish Spinning Top on 2019-12-07 07:00:00. Unfortunately it invalidated on 2019-12-08 03:00:00 before the trade could trigger (it triggered the stop before entering).

Looking to learn more about this pattern?
You should take a look at Joe Marwood's online course. In his course, he backtested the 26 main candlestick patterns before to summarize which one is THE best pattern. I really liked his course and you shouldn't miss it!
Click here to signup to his "Candlestick Analysis For Professional Traders" course now!

Russell Crane

Russell Crane

Russell is an Algorithmic & Technical Analyst Trader @ PatternsWizard.
His passion is to share his knowledge about TA, patterns & more. Why hope for your trading to work when you can precisely know the performance stat of every pattern?

Are Candlestick Patterns Reliable

candlesticksWe loved Marwood Research’s course “Candlestick Analysis For Professional Traders“. Do you want to follow a great video course and deep dive into 26 candlestick patterns (and compare their success rates)? Then make sure to check this course!

Want to know which markets just printed a Spinning Top pattern?

Market Timeframe Printed on

Get “Every Candlestick Patterns Statistics”, The Last Trading Book You’ll Ever Need! 📖

PatternsWizard book - Every Candlestick Patterns Statistics

"Every Candlestick Patterns Statistics", the last trading book you'll ever need!

Pre-register now and receive the candlestick patterns statistics ultimate ebook for free before anyone else!

"All you need is one pattern to make a living."
- Linda Raschke

Awesome move! We are giving the last touch to the "Every Candlestick Patterns Statistics" book. We are very excited to send it to you right when it's ready. In the meantime, we'd like to gift you our trading roadmap and its best 55 resources. You'll shortly receive an email with the link. Don't miss it ;) Stay tuned 📈