
 Good Trading requires the Best Charting Tool!
Traders have applied candlestick patterns in analyzing the movement of a market. One of such patterns is the separating lines candlestick pattern. The pattern comes up when there’s an uptrend in the market and when there’s also a pullback.
The separating lines pattern is exhibited by a long black (or red) candle; but the following day opens back up to the same level as it opened the previous day. It has the same open and is the opposite color. This pattern is the exact reverse of the meeting lines candlestick pattern. In other Japanese circles, this is also known as “Furiwake” which means “dividing lines.”
- The Separating Lines candlestick pattern is a 2-bar candlestick pattern.
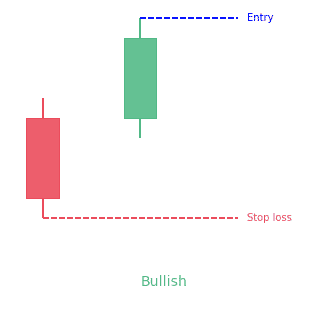
- The bullish separating lines is a red candle and then the price jumps up to create a green candle opening above the previous candle.
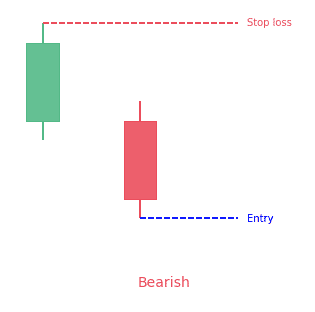
- The bearish separating lines is a green candle and then the price jumps down to create a red candle opening below the previous candle.
Statistics to prove if the Separating Lines pattern really works
Are the odds of the Separating Lines pattern in your favor?
How does the Separating Lines behave with a 2:1 target R/R ratio?
From our research the Separating Lines pattern confirms 78.1% of the time on average overall all the 4120 markets we analysed. Historically, this patterns confirmed within 1.9 candles or got invalidated within 6.6 candles. If confirmed, it reached the 2:1 R/R target 31.7% of the time and it retested it's entry price level 98.6% of the time.
Not accounting for fees, it has an expected outcome of -0.049 $/$.
It means for every $100 you risk on a trade with the Separating Lines pattern you lose $4.9 on average.
Want to account for your trading fees? Have the detailled stats for your favorite markets / timeframes? Or get the stats for another R/R than 2:1?
🚀 Join us now and get fine-tuned stats you care about!
How to handle risk with the Separating Lines pattern?
We analysed 4120 markets for the last 59 years and we found 65 462 occurrences of the Separating Lines pattern.
On average markets printed 1 Separating Lines pattern every 238 candles.
For 2:1 R/R trades, the longest winning streak observed was 24 and the longest losing streak was 172. A trading strategy relying solely on this pattern is not advised. Anyway, make sure to use proper risk management.
Keep in mind all these informations are for educational purposes only and are NOT financial advice.
If you want to learn more and deep dive into candlestick patterns performance statistics, I strongly recommend you follow the best available course about it. Joe Marwood (who's a famous trader with more than 45 000 Twitter followers) created an online course called "Candlestick Analysis For Professional Traders" in his Marwood Research University. There he will take you through the extensive backtesting of the 26 main candlestick patterns. He then summarizes which one is THE best pattern. Do you know which one it is?
Remember, don't trade if you don't know your stats. Click here to signup to the course now!
What is Separating Lines pattern?
The Separating Lines candlestick pattern is a continuation pattern that forms when a bullish candle pattern is followed by a bearish candle pattern which opens at the start of the previous bar in a downtrend, or when a bullish bar follows a bearish candle which opens below the open of the previous candle in an uptrend.
This is a two-candle continuation pattern that can either be bullish or bearish, depending on the previous trend direction. It happens when lines move in opposite directions.
Bullish Separating Lines
Bullish separating lines pattern is a two-candle bullish continuation candlestick pattern that comes up in the middle of a bullish trend. It indicates that the current bullish trend is about to continue after a temporary pullback.
The most common interpretation is that a bullish separating line shows that the current bullish trend will continue after a small pullback. The pattern is made up of two candles, with the first being bearish and the second bullish. It has these qualities:
- The first candle is bearish
- The second candle gaps above the body of the previous candle, or opens right at its open
- The second candle closes higher than it opened
Bearish Separating Lines
The bearish separating line is known as a bearish continuation pattern. The first line is a white candle that comes up as a long line in a downtrend. The second line is made up of a black candle that comes up as a long line. Both bars will open at the same price, and then the prices are separating. For a bearish pattern to form,
- The first candle has to be positive, and form in a negative trend
- The second candle has to be negative, and open below the open of the previous candle
How to identify the Separating Lines pattern?
Criteria
- A day occurs when there’s an uptrend, and it is the opposite color of the current trend
- The second day begins at the open of the previous day
- The second day should open on its low for the day and then go higher
Pattern Psychology
During the uptrend a black or red body forms. This leads to some concern for the bulls, but the next day the prices gap back up to the open of the previous. When it happens, the bulls get confident that the trend still has movement so they jump back in and drive the prices higher. Confidence is renewed, and the trend continues.
Candlestick signals detect where money is flowing in and out of stocks. Being able to identify and understand the trader psychology that makes the candlestick signals offers a great advantage. It makes it possible for a trader to participate in stock investments that have an extremely high probability of moving in the right direction.
When traders learn how to utilize the candlestick signals correctly they’ll now have the knowledge to improve their trading techniques for those trading entities they want to trade. You do not have to rely on canned programs that sometimes work and sometimes don’t, and you do not have to buy or sell stock recommendations blindly based on a research recommendation of an analyst.
Learn more about candlestick patterns to see how it can greatly improve your profits! Primary candlestick patterns should be understood first (such as the hanging man and the doji patterns). Once you understand the major signals, move onto the secondary bar signals and then eventually the continuation pattern such as this upside tasuki gap pattern.
What does the Separating Lines tell traders?
Bullish Separating Lines
After an established uptrend, that sees the bulls dominating the market, the bears take control for a time. The price goes down significantly during the bears’ reign, but their time in power is short. On the second day, the price goes sharply upward, so that the day opens at the same place the previous day opened. Relishing their recovery of the market, the bulls drive the price significantly upward. The uptrend can be expected to go on.
Even though the signal starts with a major drop, the remainder is a steady upward climb. Between the close of the first day and the open of the second, the market completes one huge jump. The second jump occurs during the next day, forming a long white candle. With two great leaps, the bullish separating lines candlestick pattern shows that the trend already underway is expected to continue. It also relays the strength of the trend, proving that even after a setback, the bulls will come back with full force and take control. The longer the candles in the bullish separating line, the more reliable the pattern.
Although scarce, traders can depend on the bullish separating lines signal as a strong continuation pattern. But before making any trades based on the presence of the signal, check for confirmation by waiting for a white candle that will continue the uptrend. You can also look for a gap up or a higher close.
Bearish Separating Lines
The bears are in control, establishing a strong downtrend until the bulls take the wheel. Although the price significantly rises during the bulls’ time in control, this period of ascendance is soon curbed by the bears. They seize control again on the second day, which opens at the same price that the previous day opened. Then, under the influence of the bears, the price drops again. This downtrend should be expected to continue.
Even though this signal starts with a climbing price on day one, the descent echoes the downtrend that preceded the pattern. Between the close of the first day and the open of the second, there is a huge leap down in price. The second day has another downward leap. When you combine these two drops, it is easy to see why the downtrend is expected to go on. The strength of the bears is apparent, and a small setback won’t stand in their way. The longer the two candles are, the more reliable the bearish pattern is.
How to trade when you see the Separating Lines pattern?
A lot of traders believe that if they just read enough about different patterns, they’ll be able to trade profitably. However, they will realize with time that candlestick patterns aren’t enough on their own to take a trade. It’s important that you include other types of technical analysis to support your prediction of where prices are headed. Also, you’ll have to ensure that you apply the pattern to a market and timeframe where it makes sense.
Some things to consider include in your trading plan:
- Volatility: It plays an important role in anything that moves, which includes all markets. Some patterns may only work well with high or low volatility.
- Momentum: The momentum of a market will mostly have an important impact on the performance of many strategies.
- Seasonality: In most markets you’ll discover that there are some types of bullish or bearish tendencies that can be found by analyzing the time such as day of week, part of the month, and time of day.
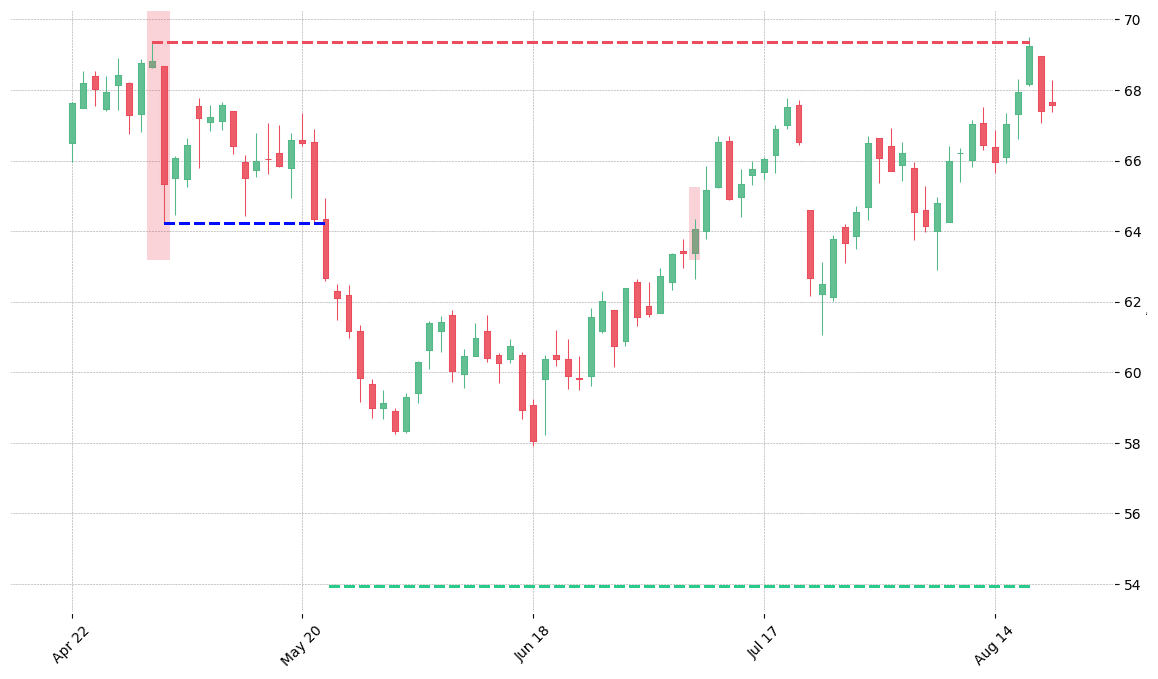
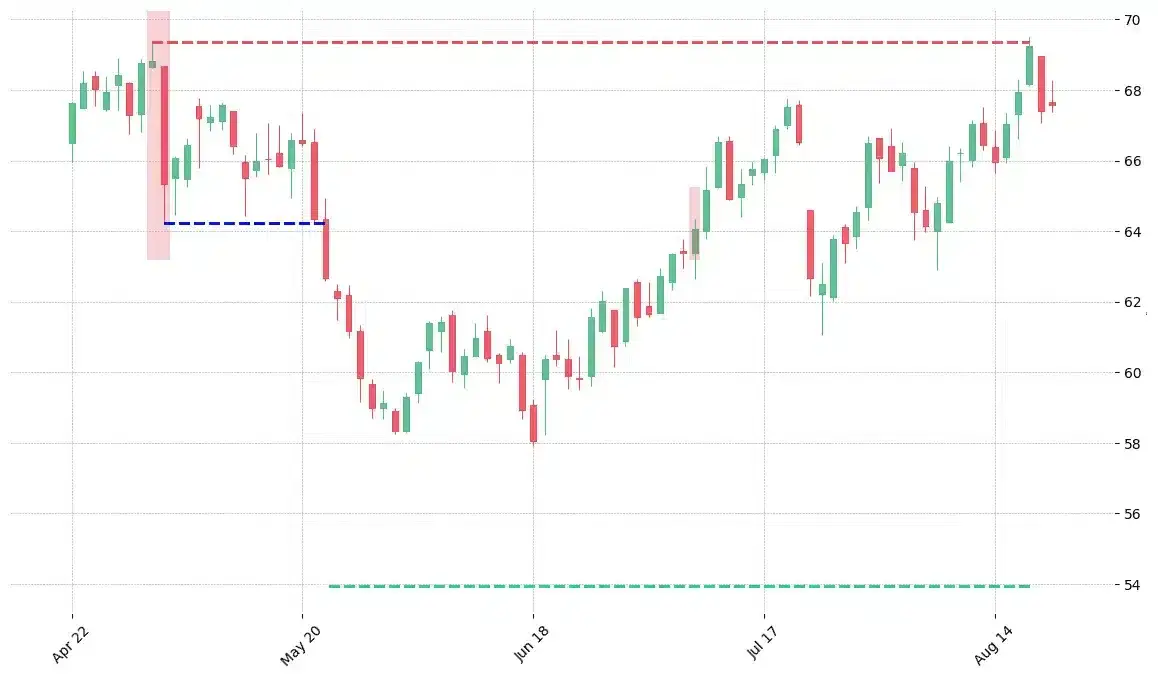
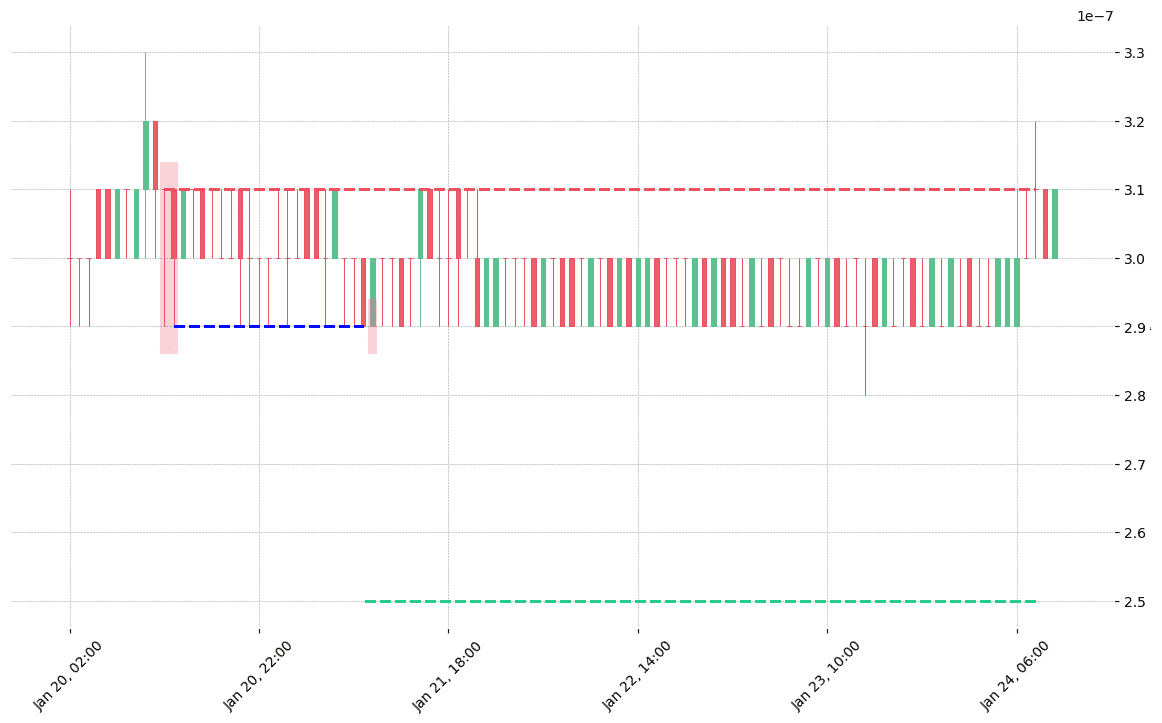
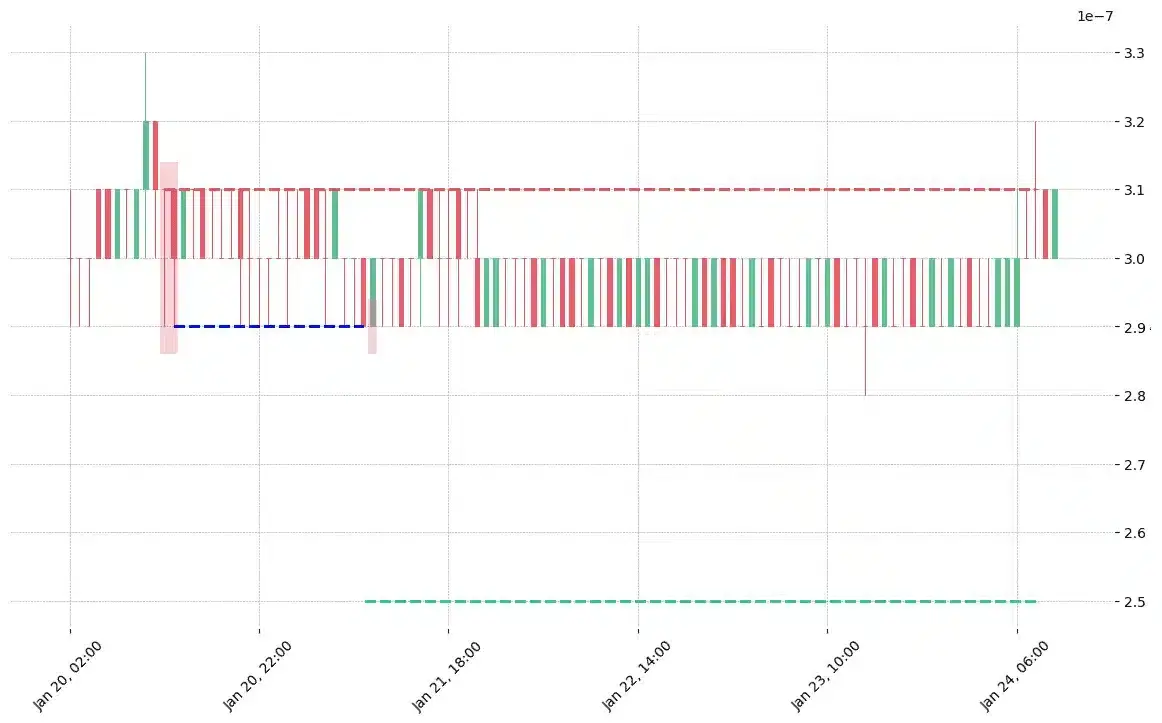
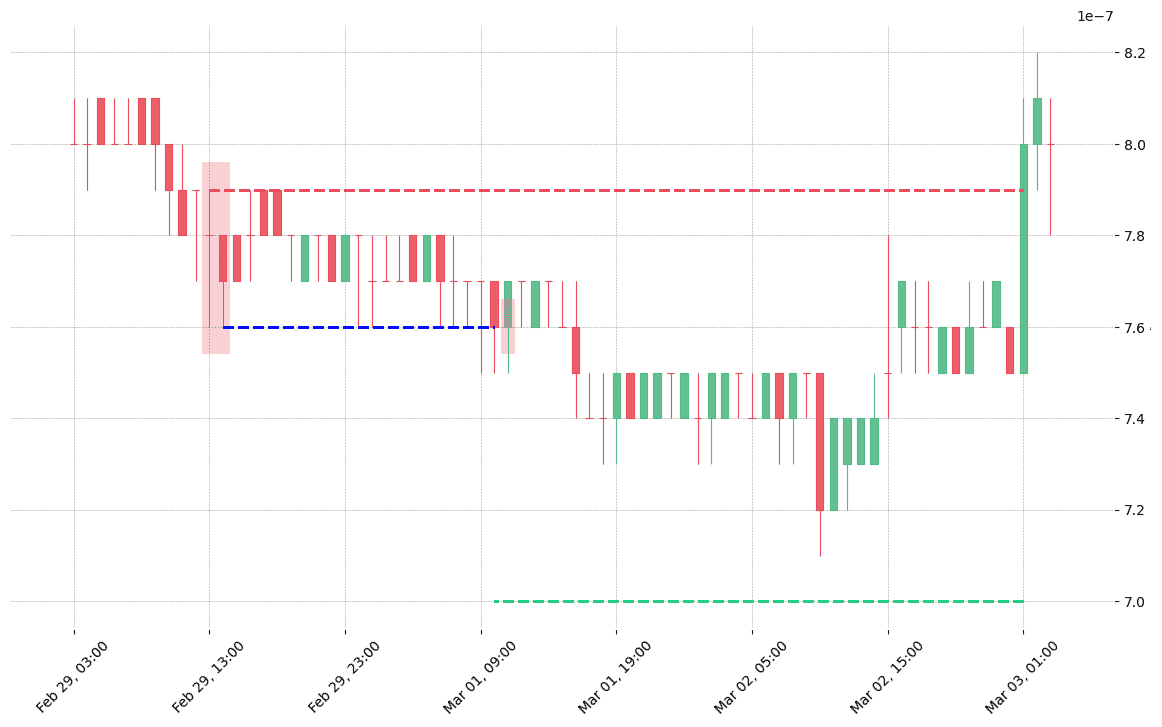
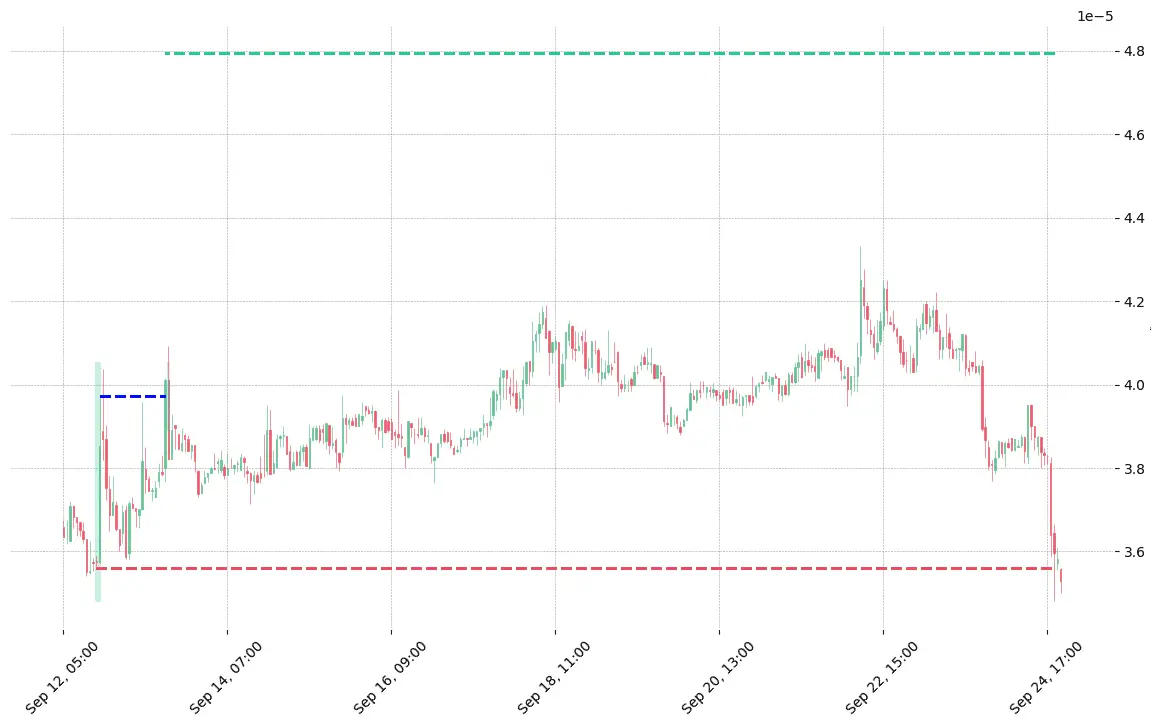
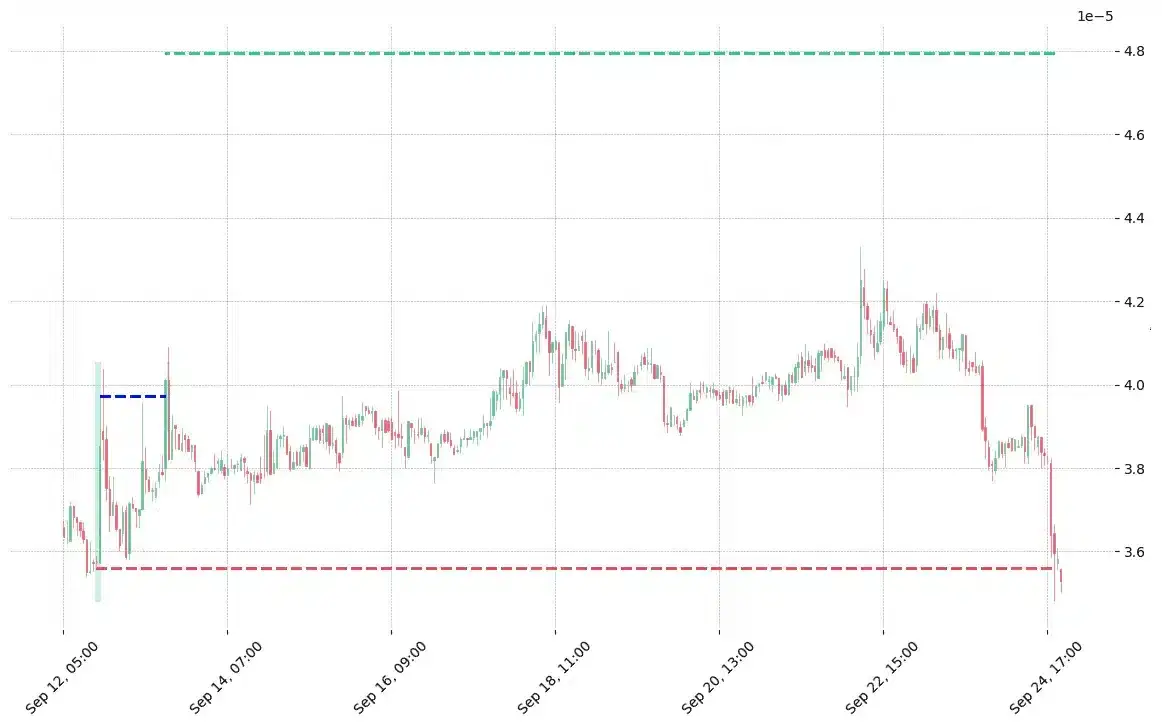
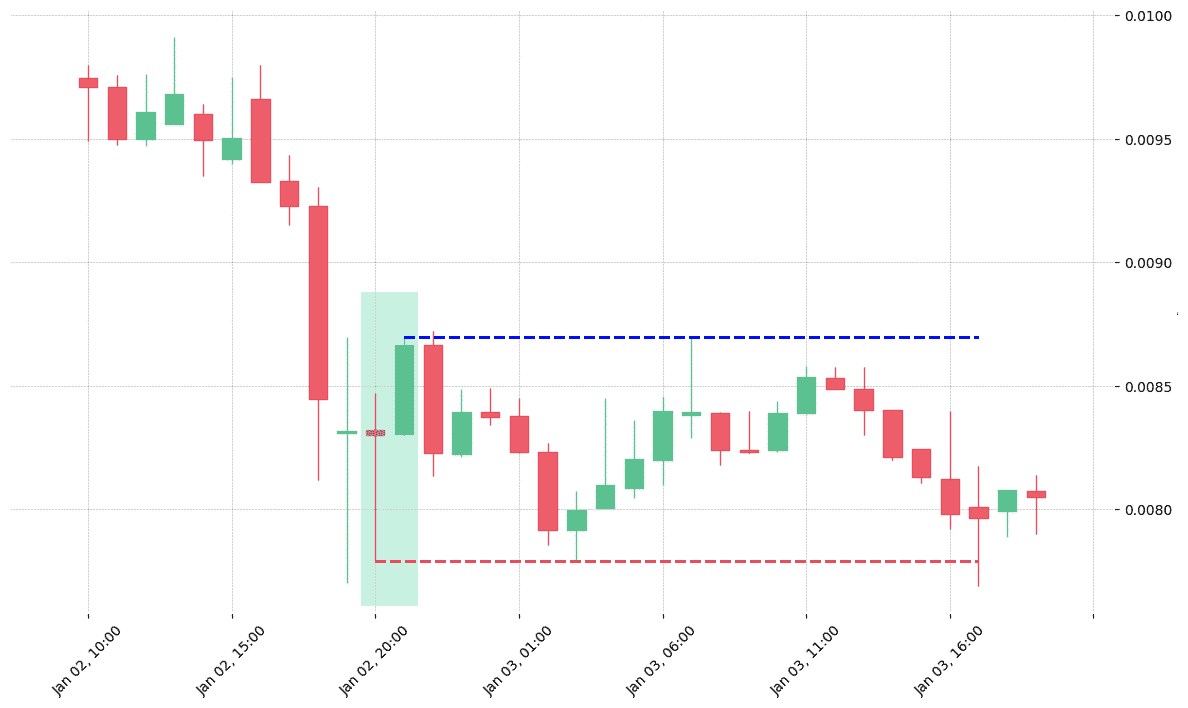
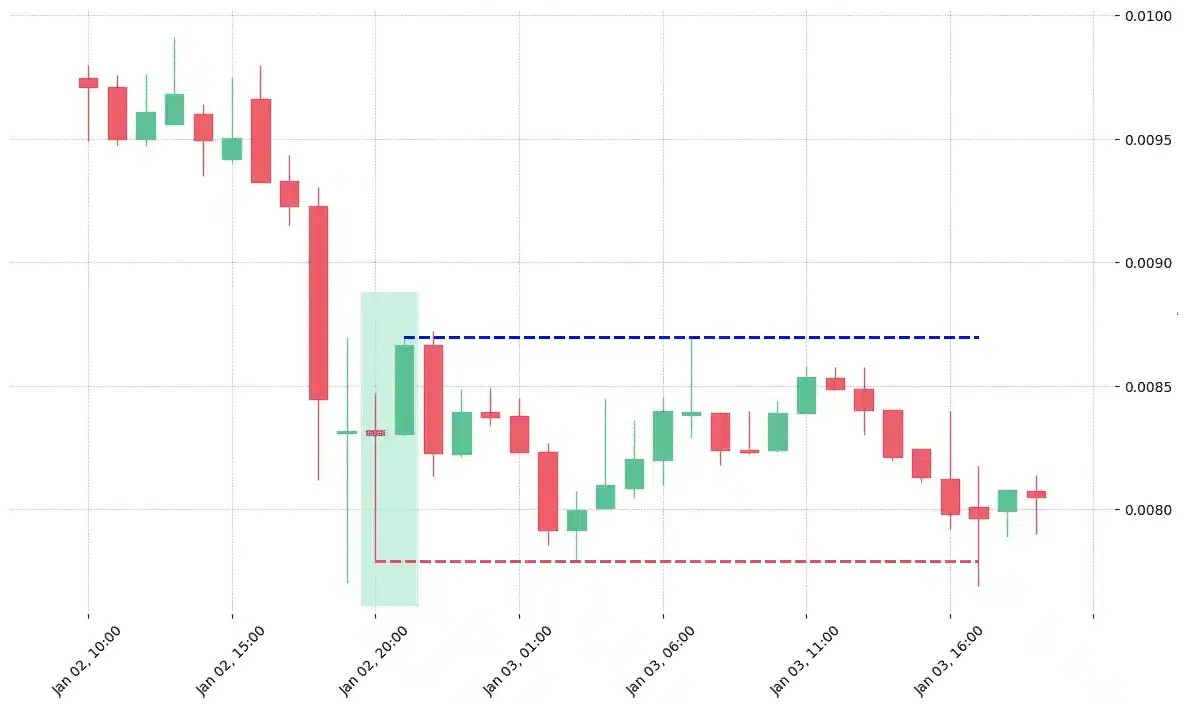
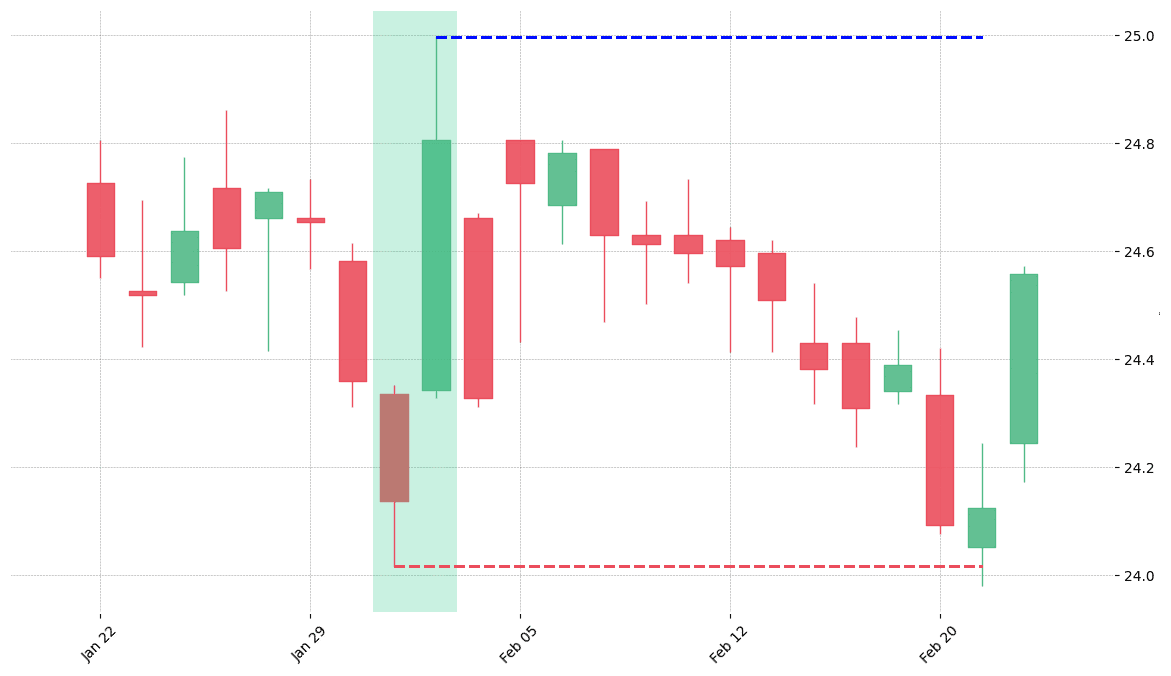
How does the Separating Lines pattern look in real life?


Looking to learn more about this pattern?
You should take a look at Joe Marwood's online course. In his course, he backtested the 26 main candlestick patterns before to summarize which one is THE best pattern. I really liked his course and you shouldn't miss it!
Click here to signup to his "Candlestick Analysis For Professional Traders" course now!


 We loved Marwood Research’s course “Candlestick Analysis For Professional Traders“. Do you want to follow a great video course and deep dive into 26 candlestick patterns (and compare their success rates)? Then make sure to check this course!