
 Good Trading requires the Best Charting Tool!
The Rickshaw Man candlestick pattern is very similar to the Long-Legged Doji pattern. A Long-Legged Doji pattern is the one that has a closing and opening price happening at or in the middle of the shadows. The high and low prices are far apart and make very long wicks. When opening and closing are almost similar, it creates a Doji. Hence, the Rickshaw Man pattern appears on the chart as a Doji body with a long candle.
The difference between the Rickshaw Man and the Long-Legged Doji is that a Rickshaw Man pattern has the body near the midpoint of the candle. The Rickshaw Man pattern appears when bears and bulls try and control market prices at different times but during the same period. This creates a long trading range that is exhibited by the long candle of the pattern.
It must be remembered that the Rickshaw Man only alludes towards indecision in the market. It shows that supply and demand are in a state of equilibrium. Technical experts and analysts consider this pattern not a highly reliable pattern unless used with other technical indicators.
- The Rickshaw man pattern is a candlestick pattern with long wick and tail and a small body in the middle.
- It shows indecision in the market.
Statistics to prove if the Rickshaw Man pattern really works
Are the odds of the Rickshaw Man pattern in your favor?
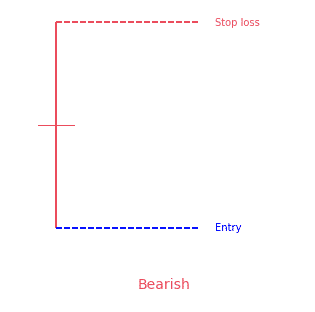
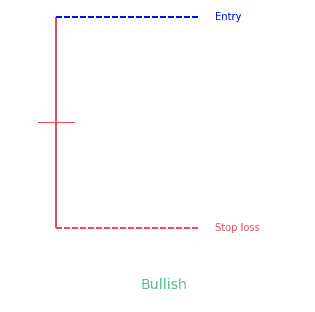
How does the Rickshaw Man behave with a 2:1 target R/R ratio?
From our research the Rickshaw Man pattern confirms 41.2% of the time on average overall all the 4120 markets we analysed. Historically, this patterns confirmed within 3.1 candles or got invalidated within 2.5 candles. If confirmed, it reached the 2:1 R/R target 43.5% of the time and it retested it's entry price level 85.4% of the time.
Not accounting for fees, it has an expected outcome of 0.304 $/$.
It means for every $100 you risk on a trade with the Rickshaw Man pattern you make $30.4 on average.
Want to account for your trading fees? Have the detailled stats for your favorite markets / timeframes? Or get the stats for another R/R than 2:1?
🚀 Join us now and get fine-tuned stats you care about!
How to handle risk with the Rickshaw Man pattern?
We analysed 4120 markets for the last 59 years and we found 555 203 occurrences of the Rickshaw Man pattern.
On average markets printed 1 Rickshaw Man pattern every 28 candles.
For 2:1 R/R trades, the longest winning streak observed was 30 and the longest losing streak was 157. A trading strategy relying solely on this pattern is not advised. Anyway, make sure to use proper risk management.
Keep in mind all these informations are for educational purposes only and are NOT financial advice.
If you want to learn more and deep dive into candlestick patterns performance statistics, I strongly recommend you follow the best available course about it. Joe Marwood (who's a famous trader with more than 45 000 Twitter followers) created an online course called "Candlestick Analysis For Professional Traders" in his Marwood Research University. There he will take you through the extensive backtesting of the 26 main candlestick patterns. He then summarizes which one is THE best pattern. Do you know which one it is?
Remember, don't trade if you don't know your stats. Click here to signup to the course now!
How does the Rickshaw Man candlestick pattern form?
As we have discussed earlier that security’s price is controlled by both bears and bulls at different times but during the same period. This disparity creates a very long leg of the Rickshaw Man pattern. The opening and closing prices remain almost at the same level forming a Doji.
How to identify a Rickshaw Man candlestick pattern?
It is not that easy to identify the Rickshaw Man pattern because the price trend leading to the pattern is not mandatory. You should look for a single candle line with a small Doji-like body and long wicks at either side of the body. The body of the candle is near the midpoint of the candlestick. You should also look for opening and closing prices that are within the pennies of each other.
What does the pattern tell traders?
The behavior of the Rickshaw Man pattern amounts to indecision. It behaves just like the Doji patterns that show the indecision and state of equilibrium in the market. Similar opening and closing prices illustrate the reason behind the inability of traders to take decisions. When expert traders see the Rickshaw Man pattern, they cannot decide their move. They are compelled to sit on the side-line and wait.
How to trade a Rickshaw Man candlestick pattern?
Technical analysts and experts suggest that the Rickshaw Man candlestick pattern must be used with other technical indicators, chart patterns, or price action analysts to observe a changing trend or continuation. They do not consider this pattern reliable to be used in isolation. Let us try to understand the trading of a Rickshaw Man pattern. For example, during a current uptrend, the prices begin to fall. In this scenario, the Rickshaw Man pattern in conjunction with an oversold stochastic signal that the low of the downtrend is near. When the prices begin to move up, the Rickshaw Man pattern and signals of other indicators are confirmed.
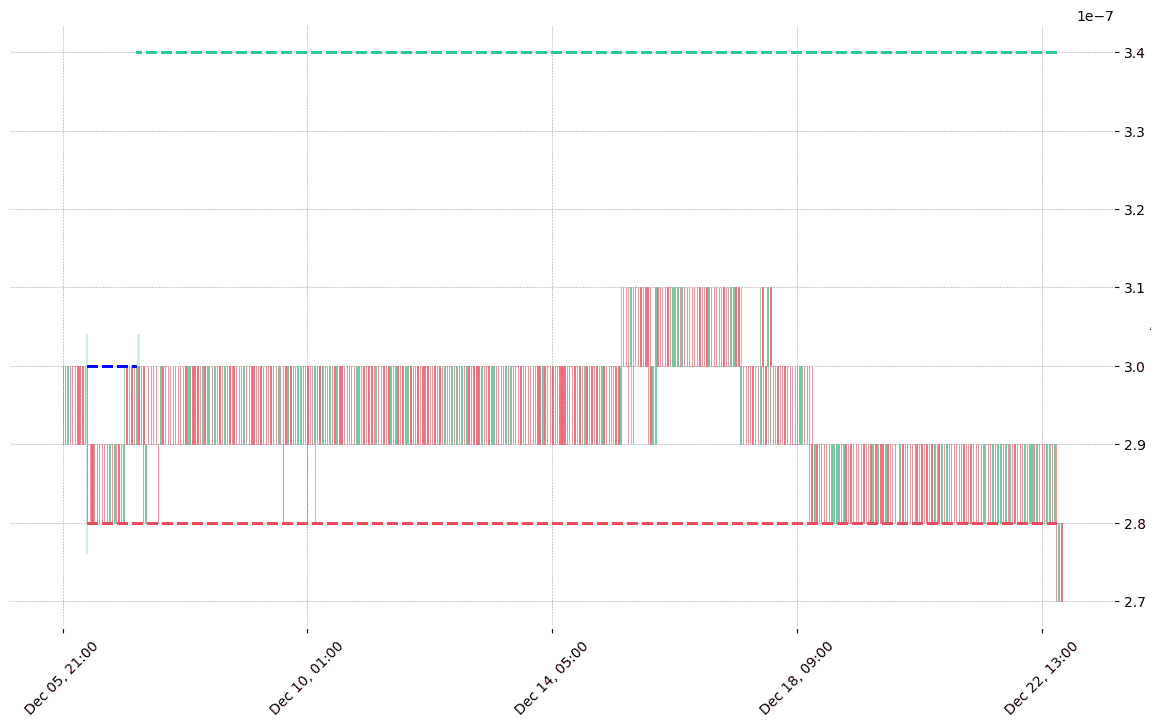
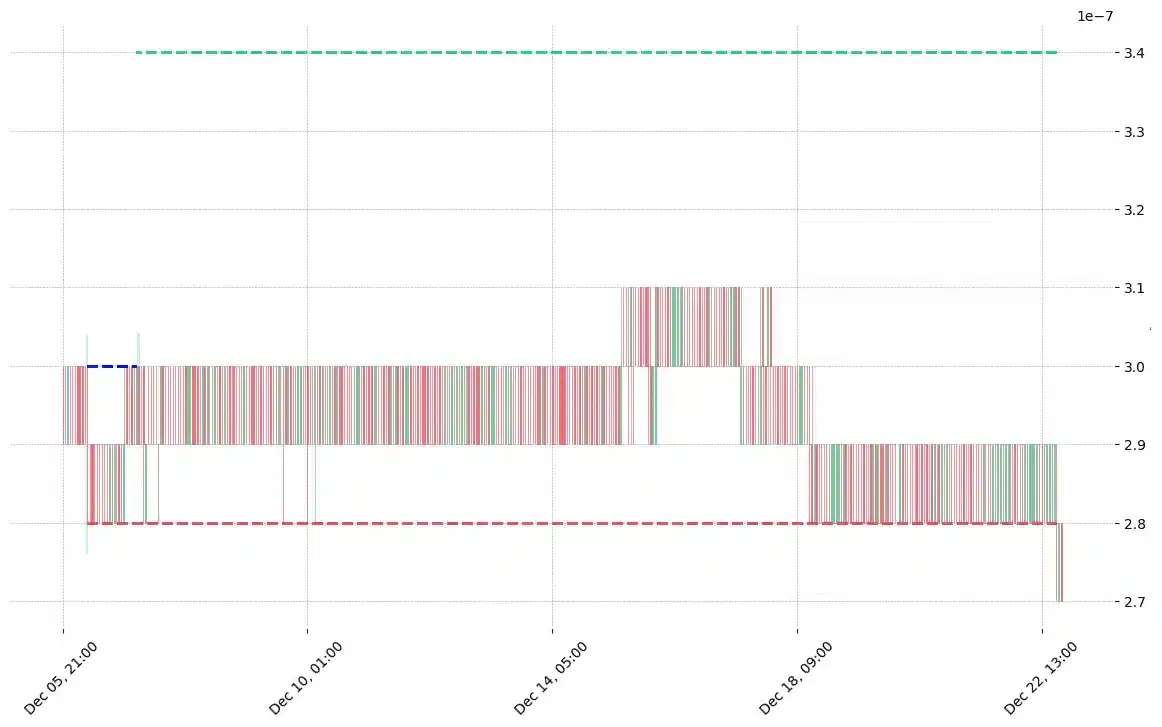
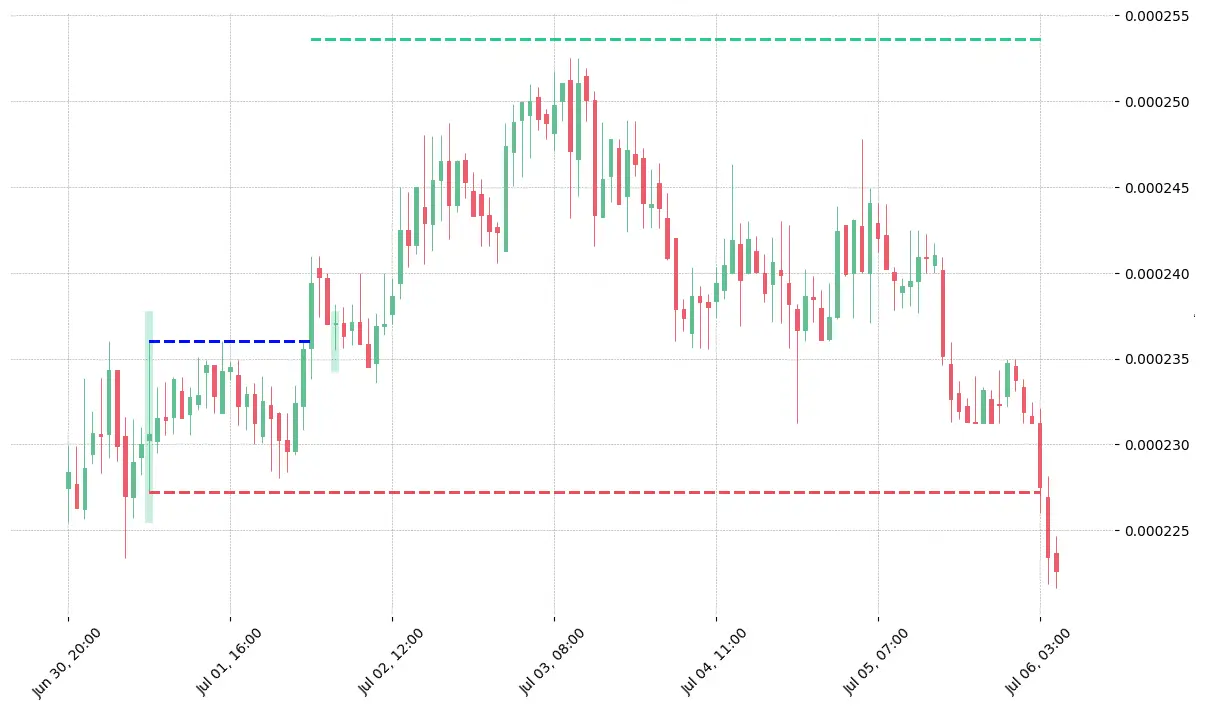
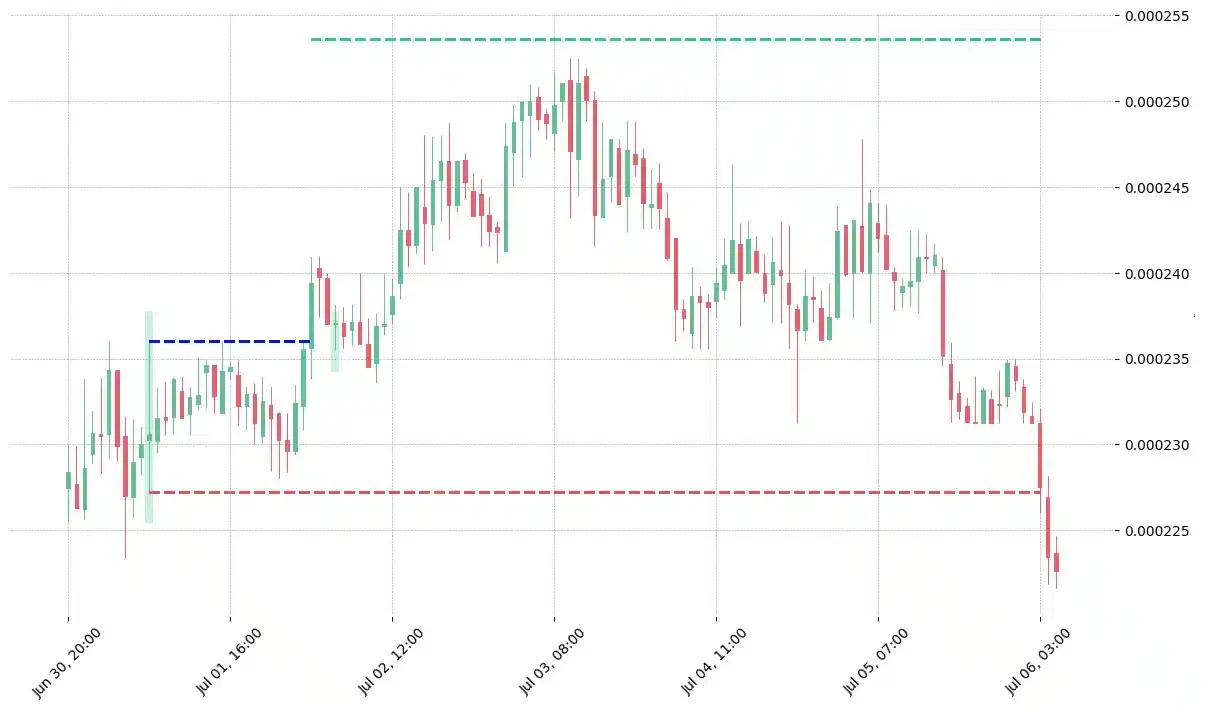
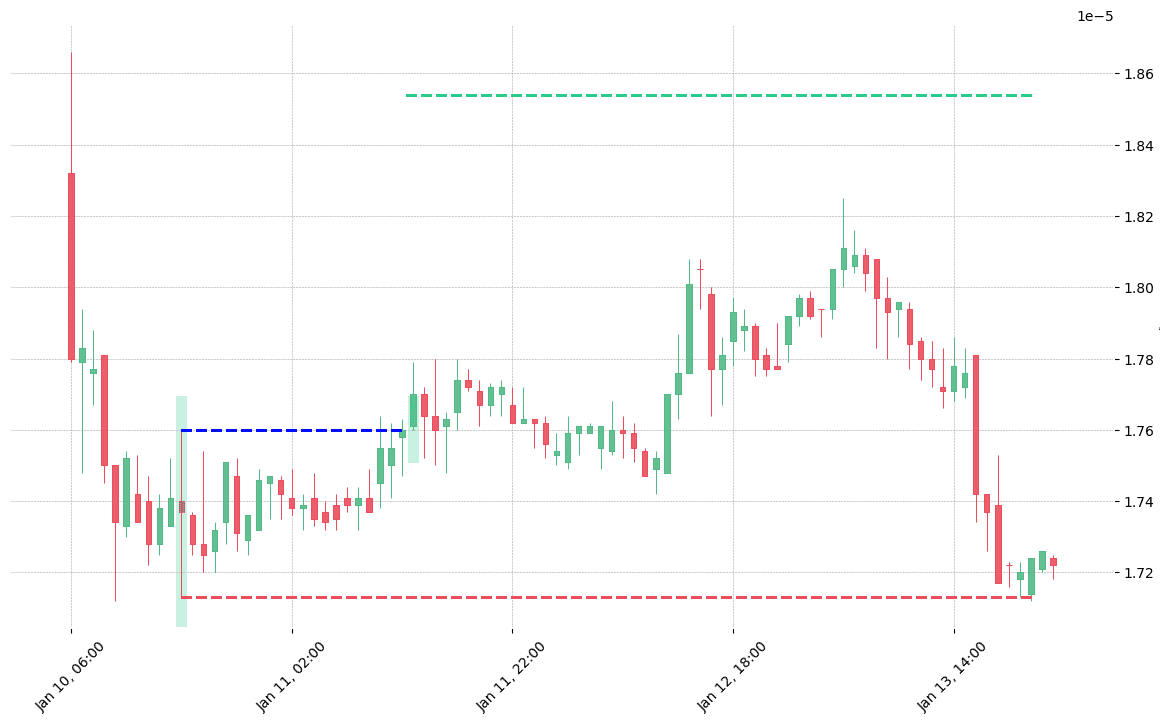
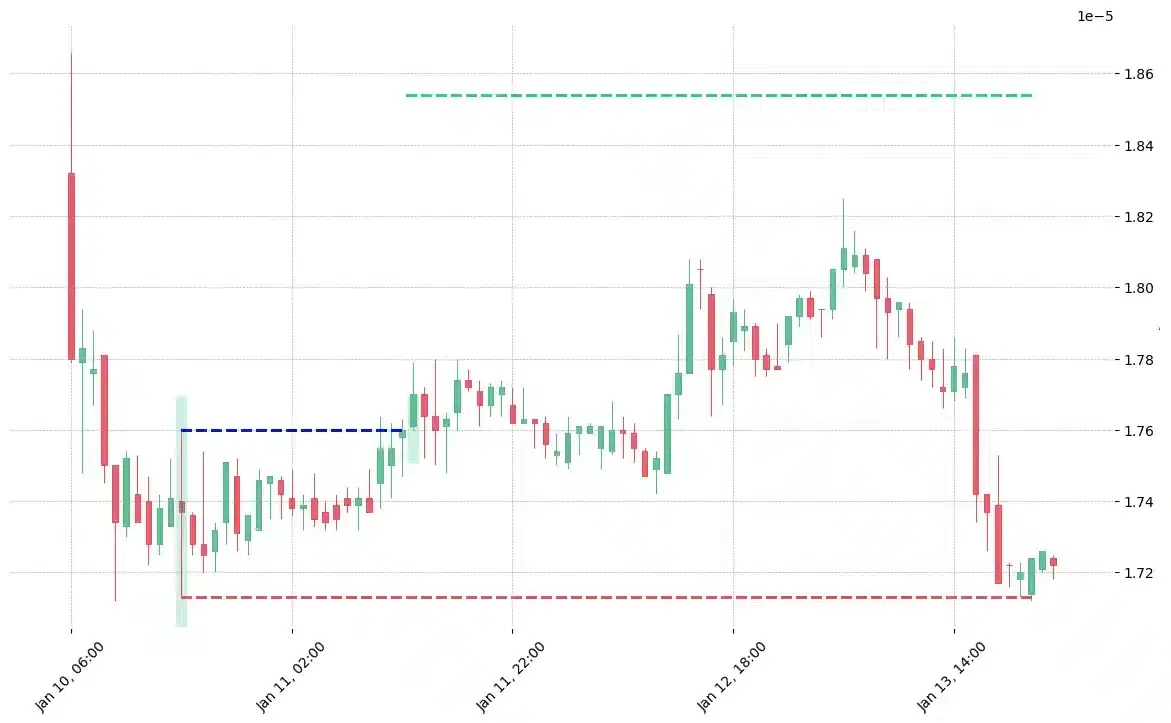
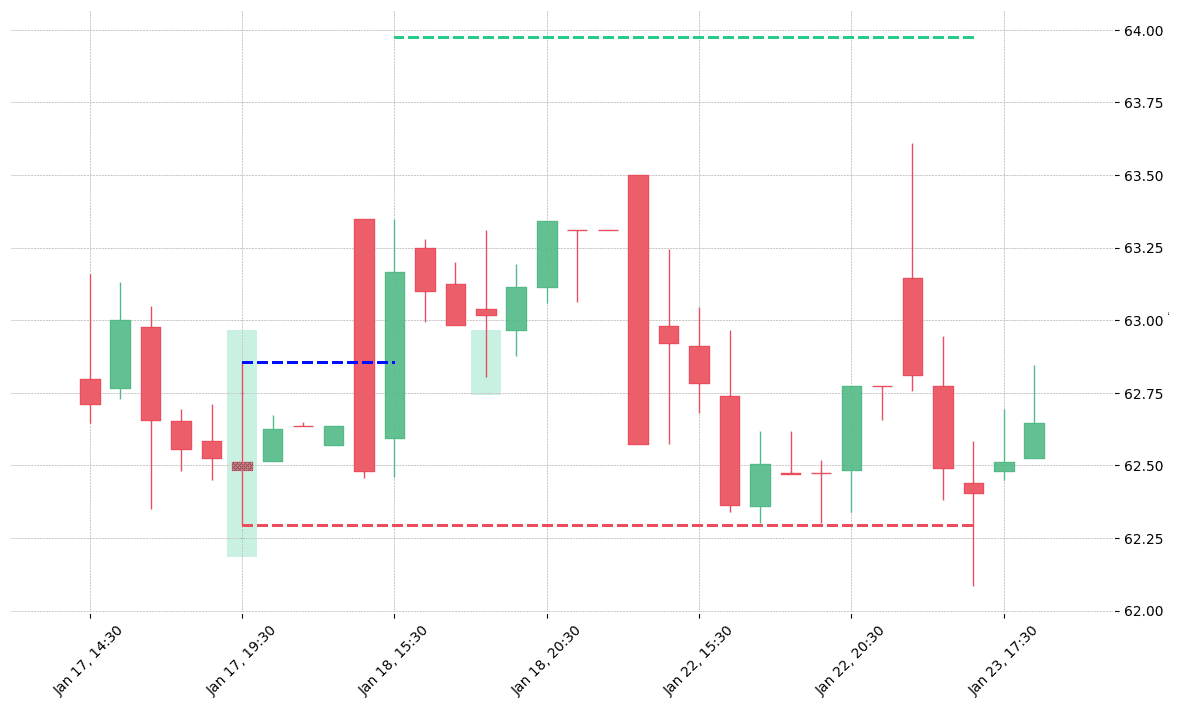
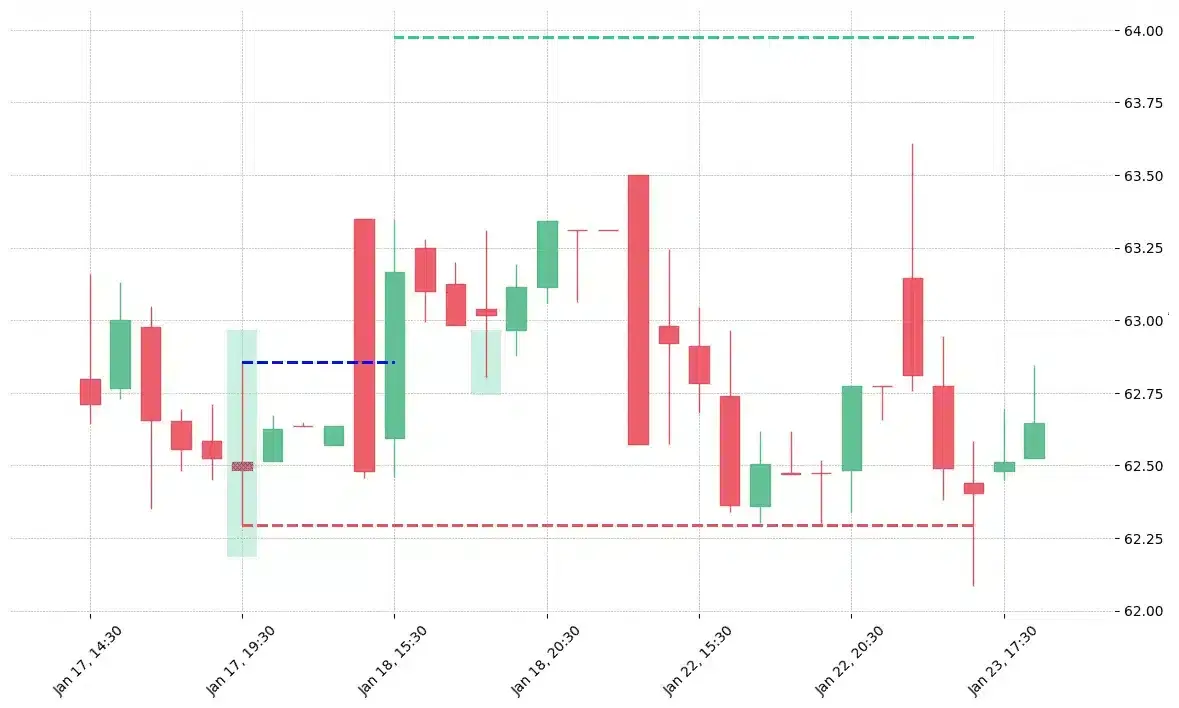
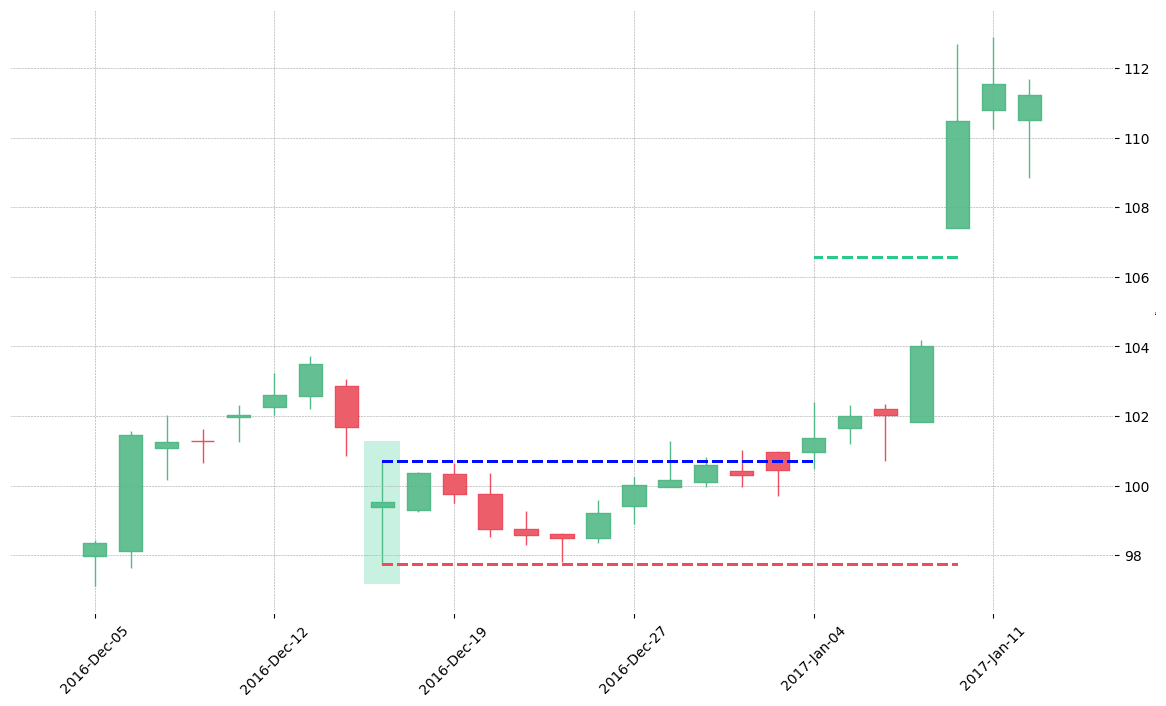
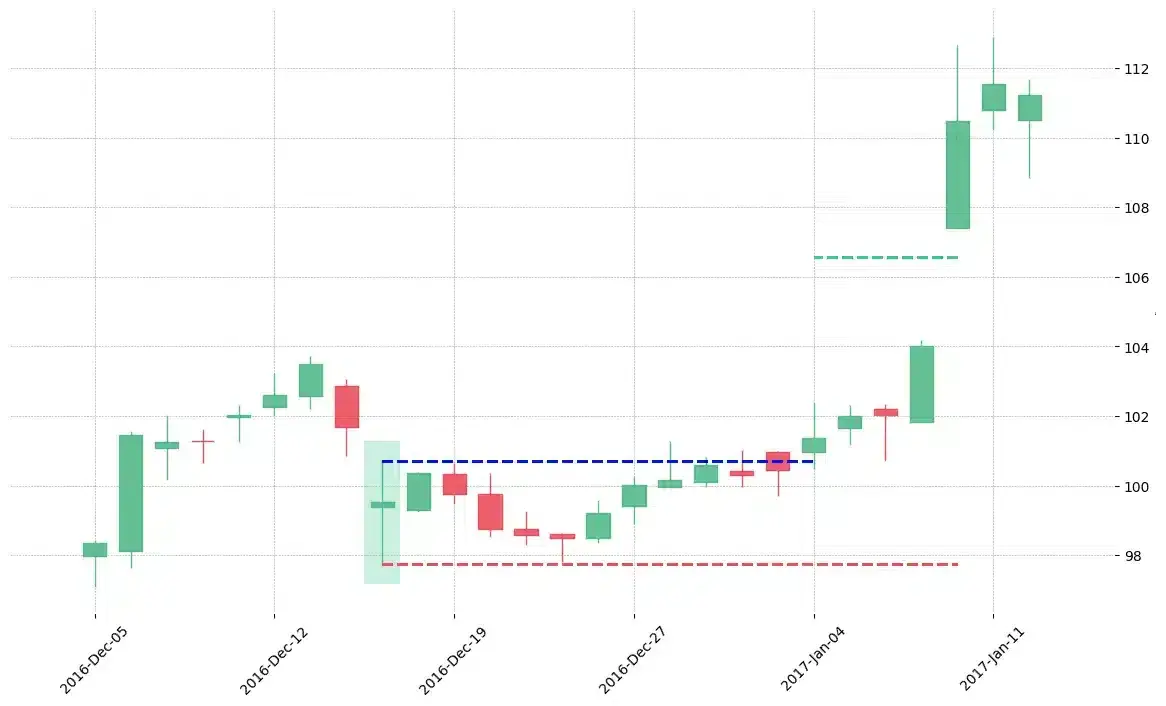
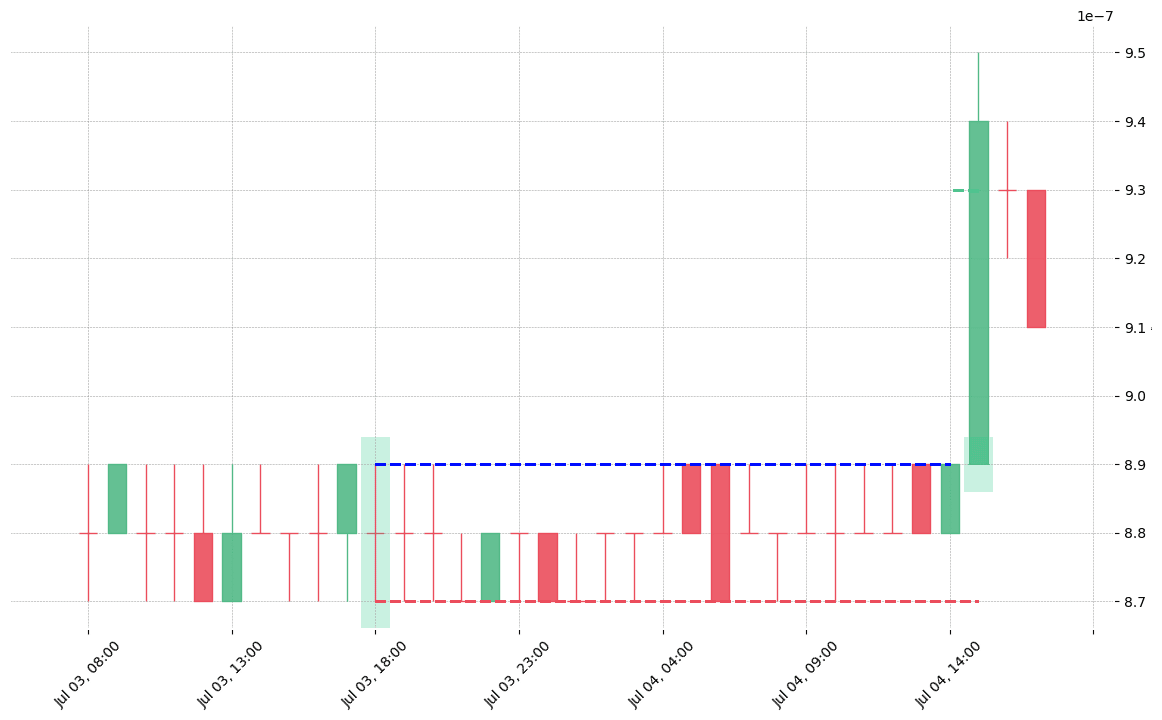
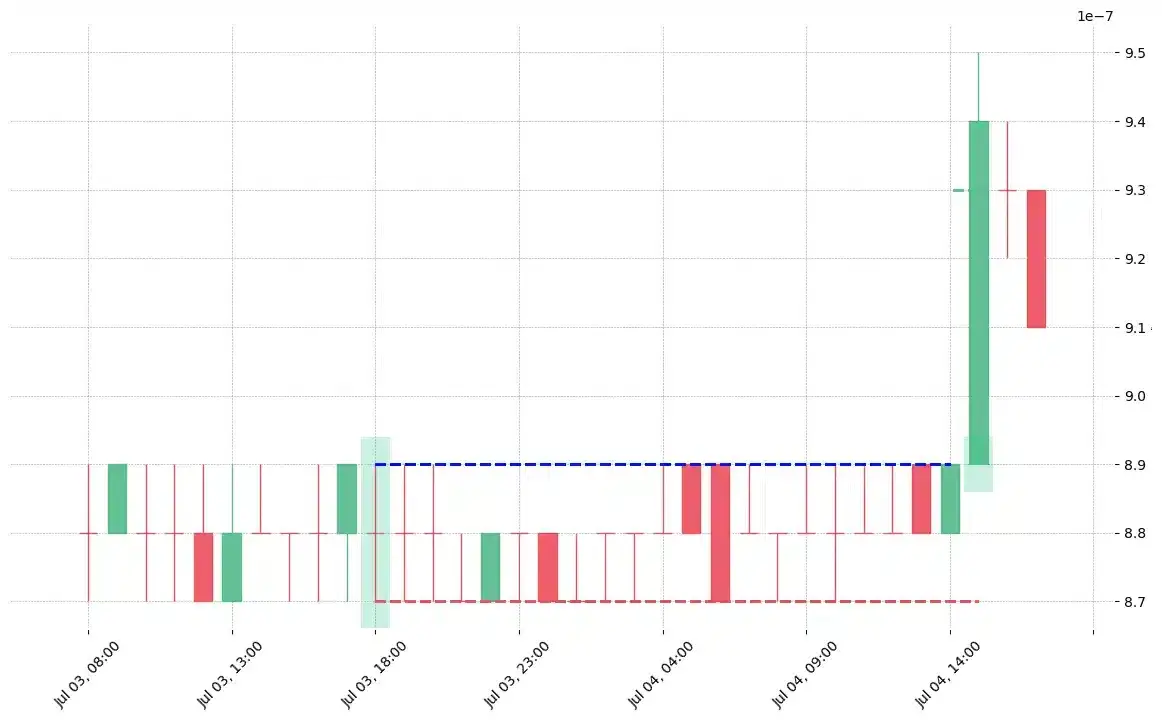
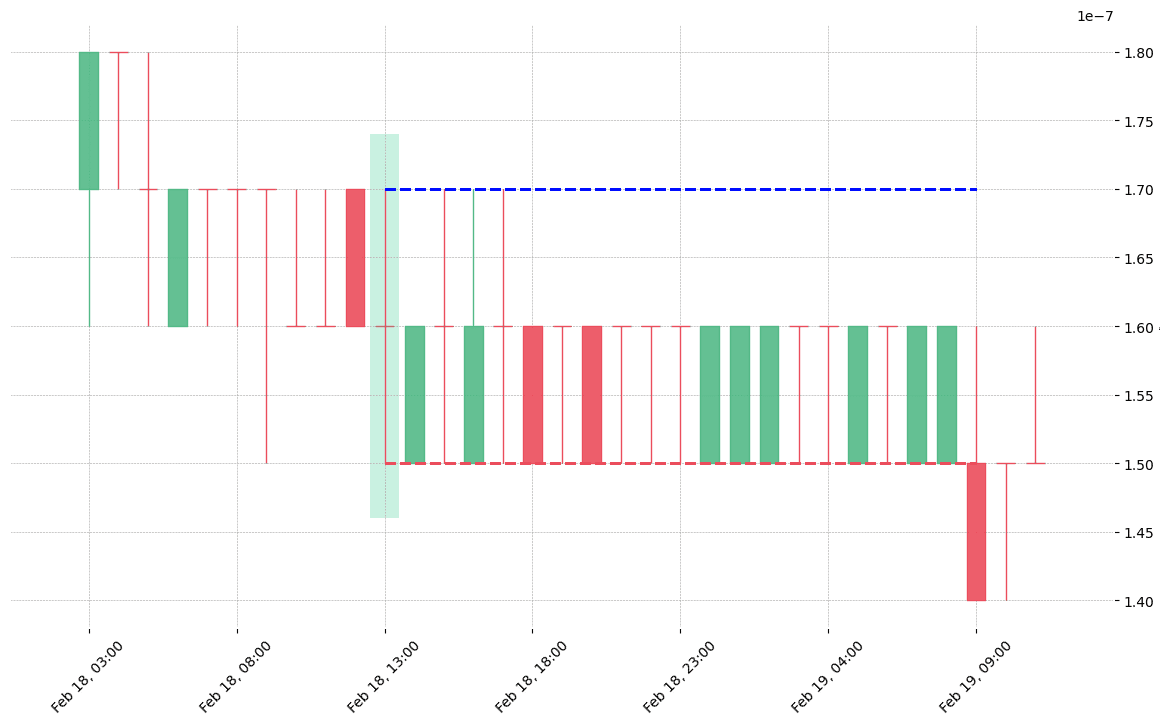
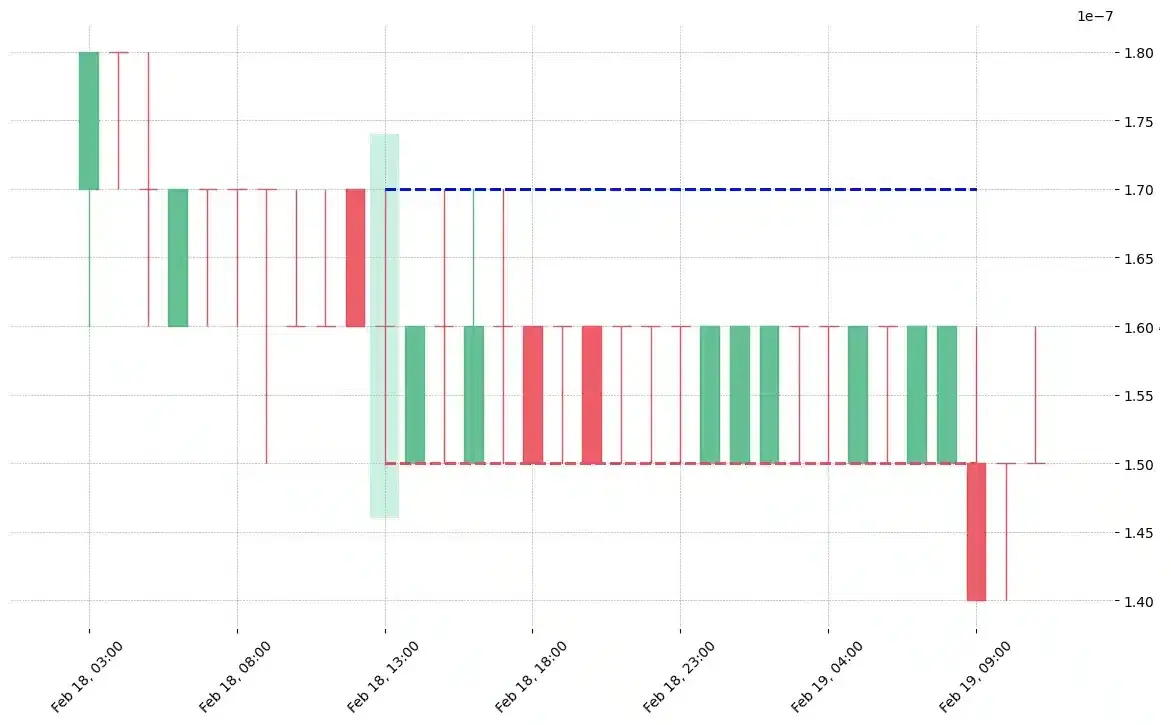
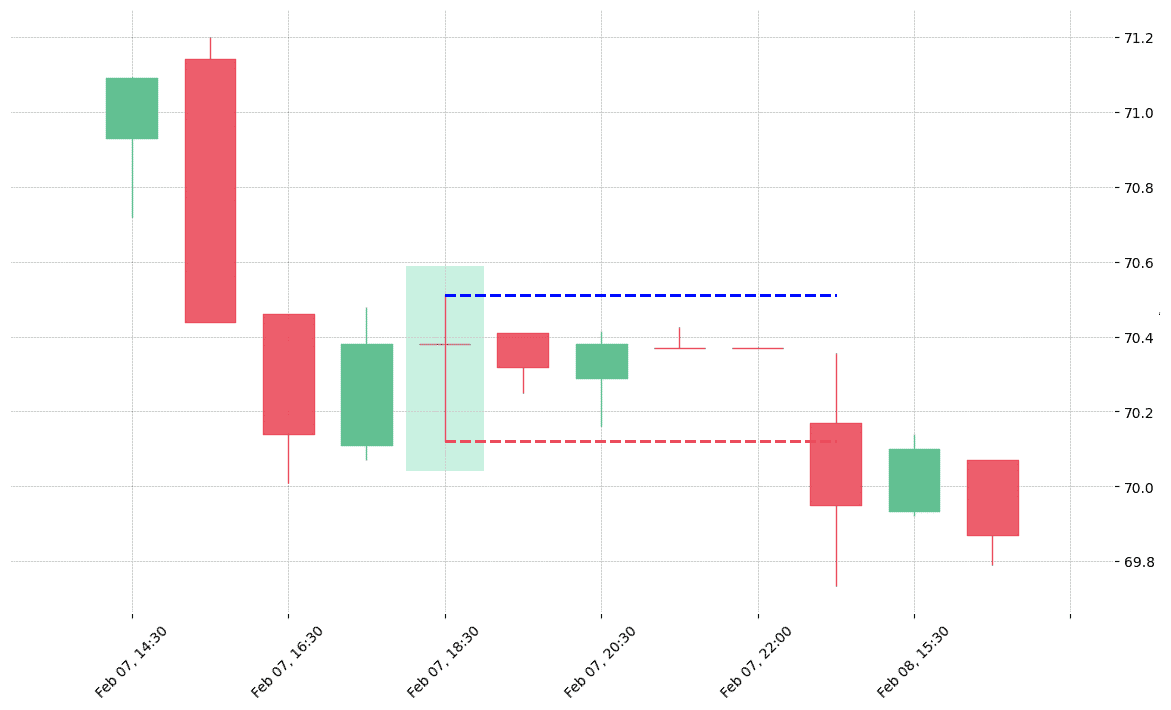
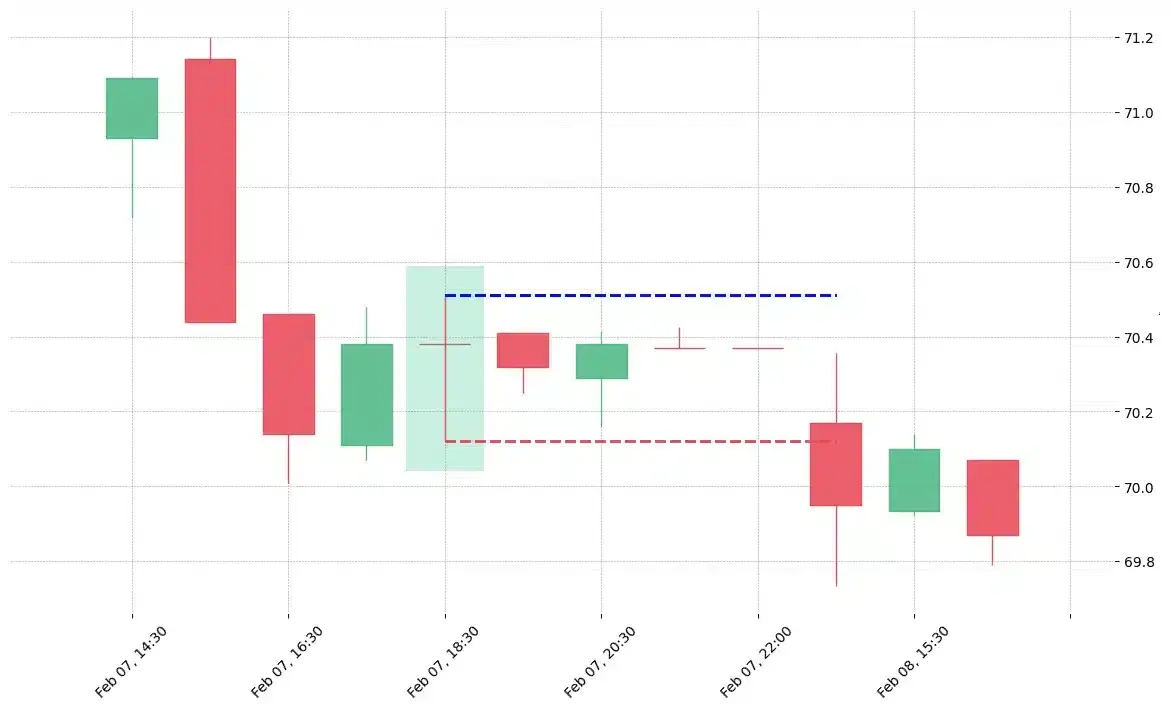
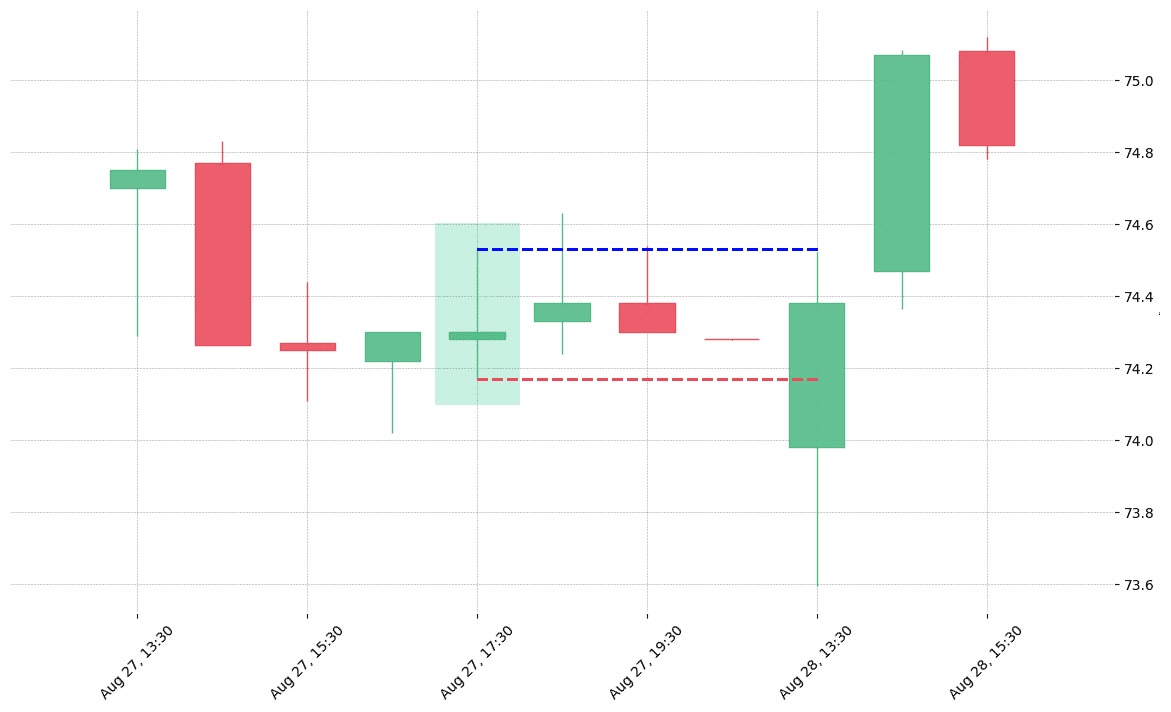
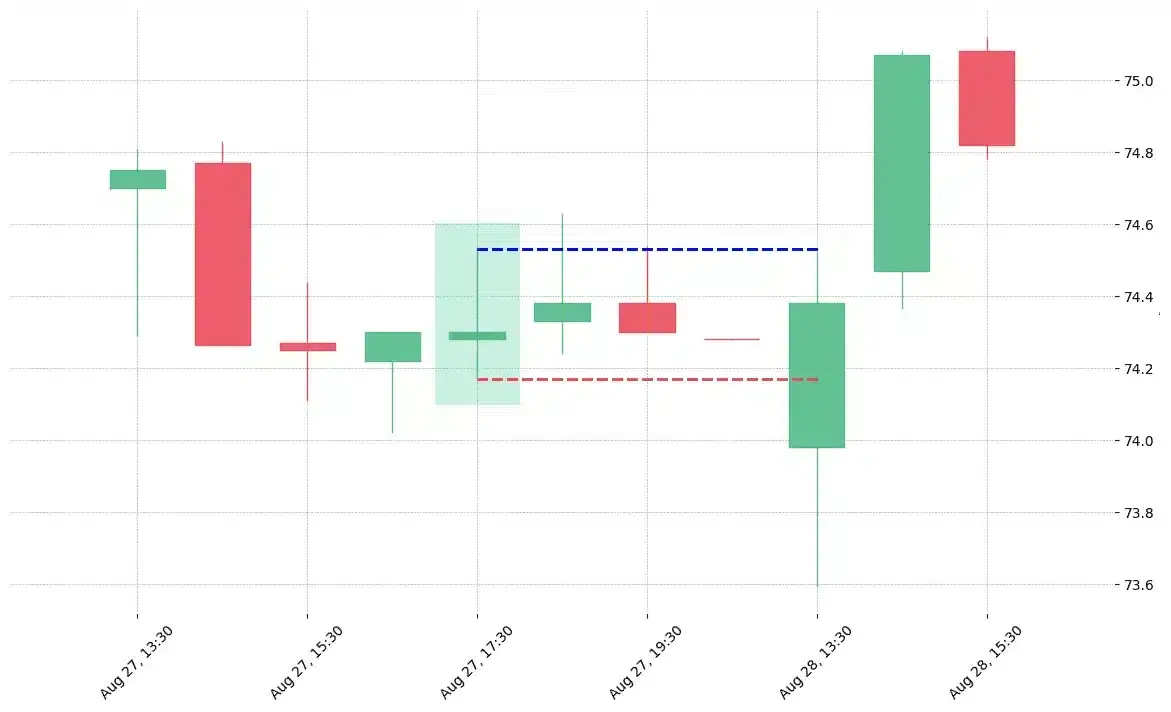
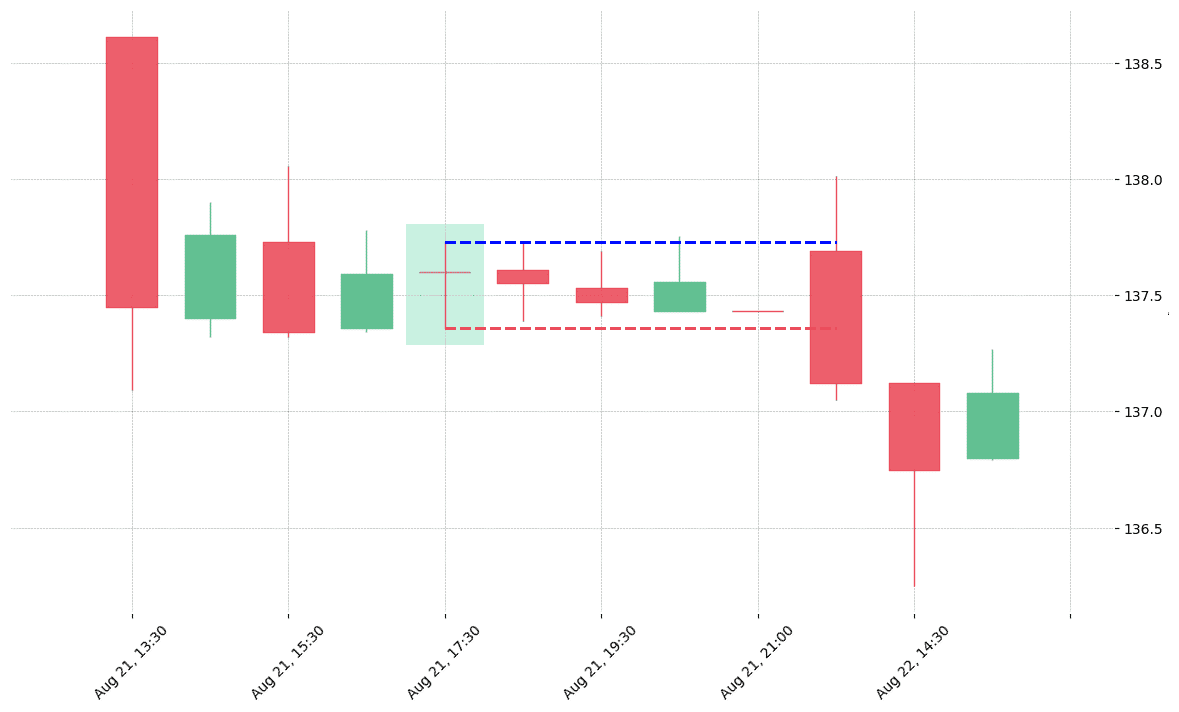
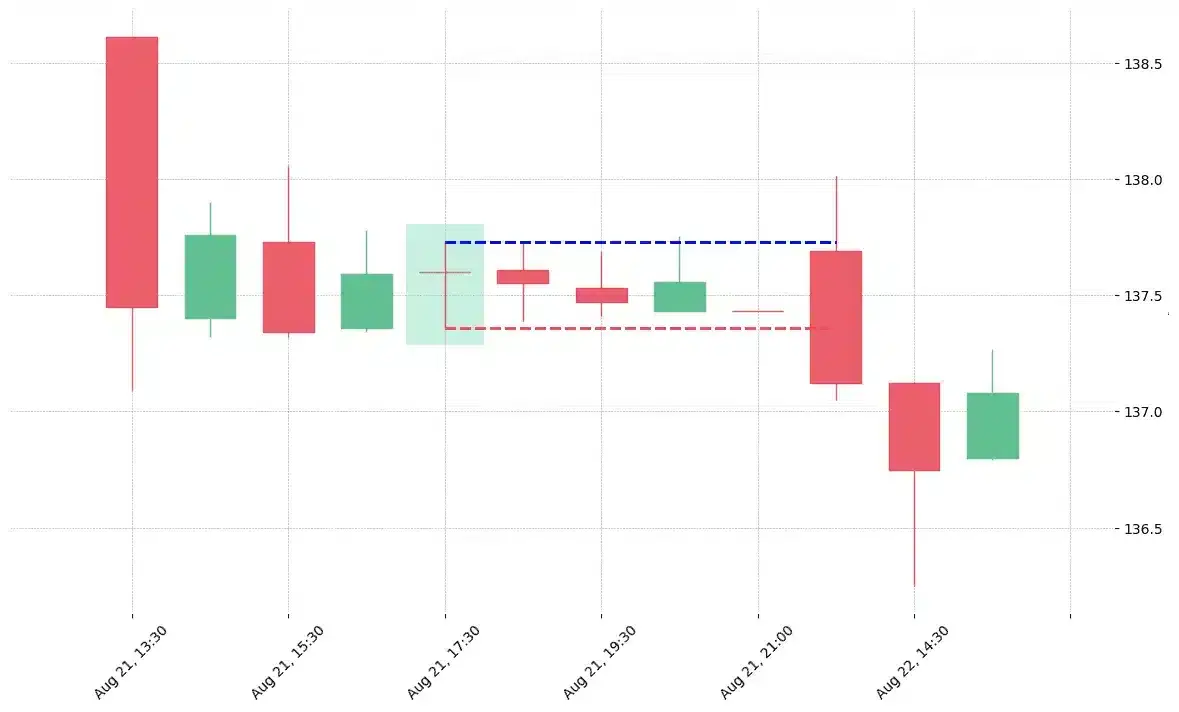
How does the Rickshaw Man pattern look in real life?
Looking to learn more about this pattern?
You should take a look at Joe Marwood's online course. In his course, he backtested the 26 main candlestick patterns before to summarize which one is THE best pattern. I really liked his course and you shouldn't miss it!
Click here to signup to his "Candlestick Analysis For Professional Traders" course now!


 We loved Marwood Research’s course “Candlestick Analysis For Professional Traders“. Do you want to follow a great video course and deep dive into 26 candlestick patterns (and compare their success rates)? Then make sure to check this course!