
 Good Trading requires the Best Charting Tool!
- The Rectangle pattern is bullish or bearish depending on the direction of the breakout
- It forms when price oscillates between a horizontal support and resistance.
What is the Rectangle pattern?
The rectangle formation is a classical technical analysis pattern shown by horizontal lines describing important support and resistance. Traders can successfully trade it by buying at support and selling at resistance levels. They can also wait for a breakout from the formation and making use of the measuring principle.
This continuation pattern forms as a trading range during a pause in the current trend. It is easy identifying the pattern because it has two comparable highs and two comparable lows. The highs and lows can be joined to make two parallel lines that form the top and bottom of a rectangle. Sometimes, rectangles are known as trading ranges, congestion areas or consolidation zones.
A rectangle formation shows a period of indecision between sellers and buyers as they take turns throwing punches but neither has taken over.
The price will test the support and resistance levels many times before breaking out eventually. From that point, the price could trend in the direction of the breakout, whether it is to the downside or upside.
They are more powerful if utilized as a continuation pattern. In this case, you have the force of the trend working for you. One thing to keep in mind is that this is one of the best methods to start trading your favorite market(s) with a breakout strategy.
Remember that this trading system does not have a bullish or a bearish bias as they are neutral patterns when they form. Traders will not know which way it’s going to break until it does. But the high chance trade will always be in the direction of the current trend.
Types of rectangles
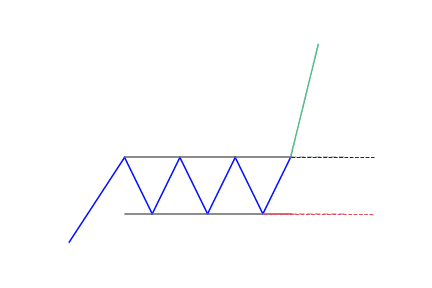
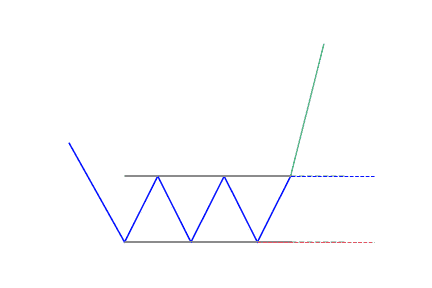
Bullish rectangle pattern
This is a continuation pattern that is seen during an uptrend, where traders look to enter into long positions once price breaks support and closes inside the breakout zone. When the pattern forms, a break to the upside would mean a continuation of the bullish trend.
Bearish rectangle pattern
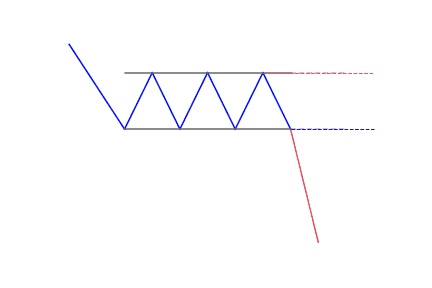
The bearish rectangular pattern is the total opposite of the bullish pattern. This pattern occurs during a downtrend, where traders look to enter into short positions when price breaks support and closes in the breakout zone. If you notice a confirmed bearish rectangle, you should open a short position when the stock breaks the bottom of the range.
Benefits of trading with rectangle patterns
There are a lot of reasons why most traders use the rectangle patterns as a breakout strategy, such as:
- They are easy to distinguish support and resistance levels in the rectangle
- Can be used in various markets
- The concept is easy to understand for new traders – identifying a consolidation pattern within a pre-existing trend and then trading the breakout
- Entry, stop and limit-levels are simple to notice and apply within the trade
- It can be used as a breakout strategy or range-bound trading strategy
How to identify the Rectangle pattern?
A confirmation candle that closes outside of the lower or upper bound shows an end to the rectangle formation and indicates the breakout direction of the continuing trend. Traders have to always know potential reversals in trend by looking at the general chart, which may show bigger macro patterns.
What does the Rectangle pattern tell traders?
The battle between the bears and the bulls is shown by the double-bottom reversal pattern. Inside the rectangle chart pattern, there is a consolidation that indicates that no one is in control of the market, neither the bears nor the bulls.
Most traders like this chart pattern because they understand why it works. This method makes use of psychology in trading because you can see when other traders are in emotional and financial pain.
The main mistake some traders make is to trade the consolidation price and put their protective stop-loss below/above. As more stops build-up above/below the chart pattern, the more important these levels become for the experienced traders who need the liquidity provided by these orders to execute their important trades.
How to trade when you see the Rectangle pattern?
The wonderful thing about this particular trading method is that there is a very simple way of determining how high or how low it will send the price of the currency.
1. Identify the pattern
To identify the rectangle pattern, traders will need to locate a trending stock that is having a period of consolidation.
Traders should also see a minimum of two tops and two bottoms that are horizontal with one another. These two tops and bottoms will make the support and the resistance levels of the rectangular range.
The pause in a trend makes the first top. The next three price swings make a bottom, a second top, and a second bottom respectively. This stock behavior shows that the price is locked inside a box. When the price action hesitates or bounces for a second time from the lower level, then the pattern is confirmed.
2. Spot a Rectangle breakout
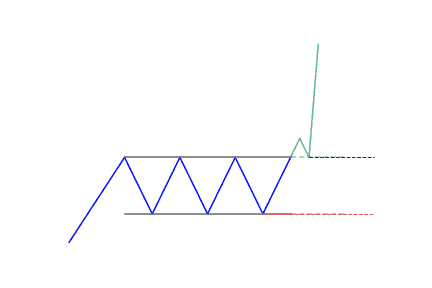
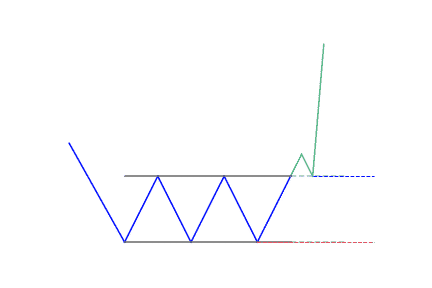
For a bullish rectangle, you would need to notice a breakout through the upper level of the pattern. This will confirm that the bullish move is coming back.
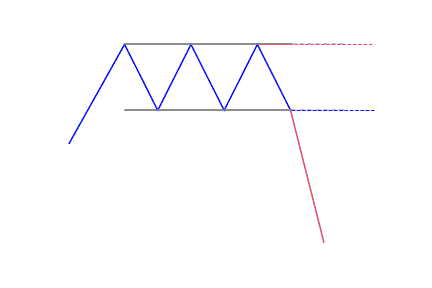
For a bearish rectangle, the price would need to break the lower level of the figure to confirm its presence. In this instance, you will notice a signal on the chart that the price could initiate a new bearish move.
3. Enter the trade
To enter the trade, traders need to first spot a rectangle breakout in the direction of the paused chart movement. Then purchase the commodity if the rectangle is bullish, or sell if you notice a bearish rectangle.
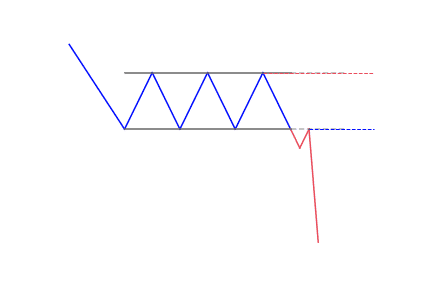
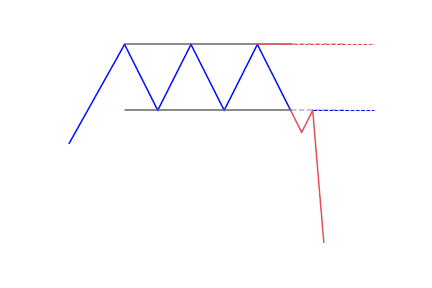
Generally, for a sell order, it is best to see a break below support to get an entry confirmation. But before getting to this point, we also want to see a false breakout above the line of resistance.
The false breakout is important because:
- It stops traders who went short in the direction of the current trend and put their stop-loss above the most current resistance level.
- It also traps some buyers who take the resistance breakout trade.
4. Having a stop-loss
Just like any other trading formation, never leave your rectangle trades to chance – always use a stop-loss for managing your trading positions.
When you notice a rectangle breakout, measure the distance between the support and resistance, then you should place your stop-loss in the middle of this length. By doing this, your trade will be secured then you’ll know that the maximum you can lose from this trade is equal to half the size of the pattern.
After buying a security on a rectangle breakout pattern, the stop-loss should be placed at the midpoint because the breakout will likely have a shakeout before continuing the trend. Thus, if you put the stop right at the breakout point, the smart money will probably hit your stop to get more shares, before beginning the run higher.
5. Exiting the trade
When trading the rectangle pattern, there is a clearly stated rule about the minimum target. You should remain in your trade for a minimum price move equal to the size of the pattern.
This entails that the distance between the support and the resistance of the rectangle should be placed on the chart beginning from the breakout moment. Since the stop-loss is in the midpoint of the rectangle range, it means that the target equals twice the size of the stop. This enables a win-loss ratio of 2:1.
Conclusion
The main reason why most traders make use of the rectangle top chart pattern is that it is simple to detect on a price chart. It is also a real-time tool when an indicator is lagging. This makes the rectangle chart pattern important in comparison with indicator trading and is a great tool in technical analysis.


 We loved Marwood Research’s course “Candlestick Analysis For Professional Traders“. Do you want to follow a great video course and deep dive into 26 candlestick patterns (and compare their success rates)? Then make sure to check this course!