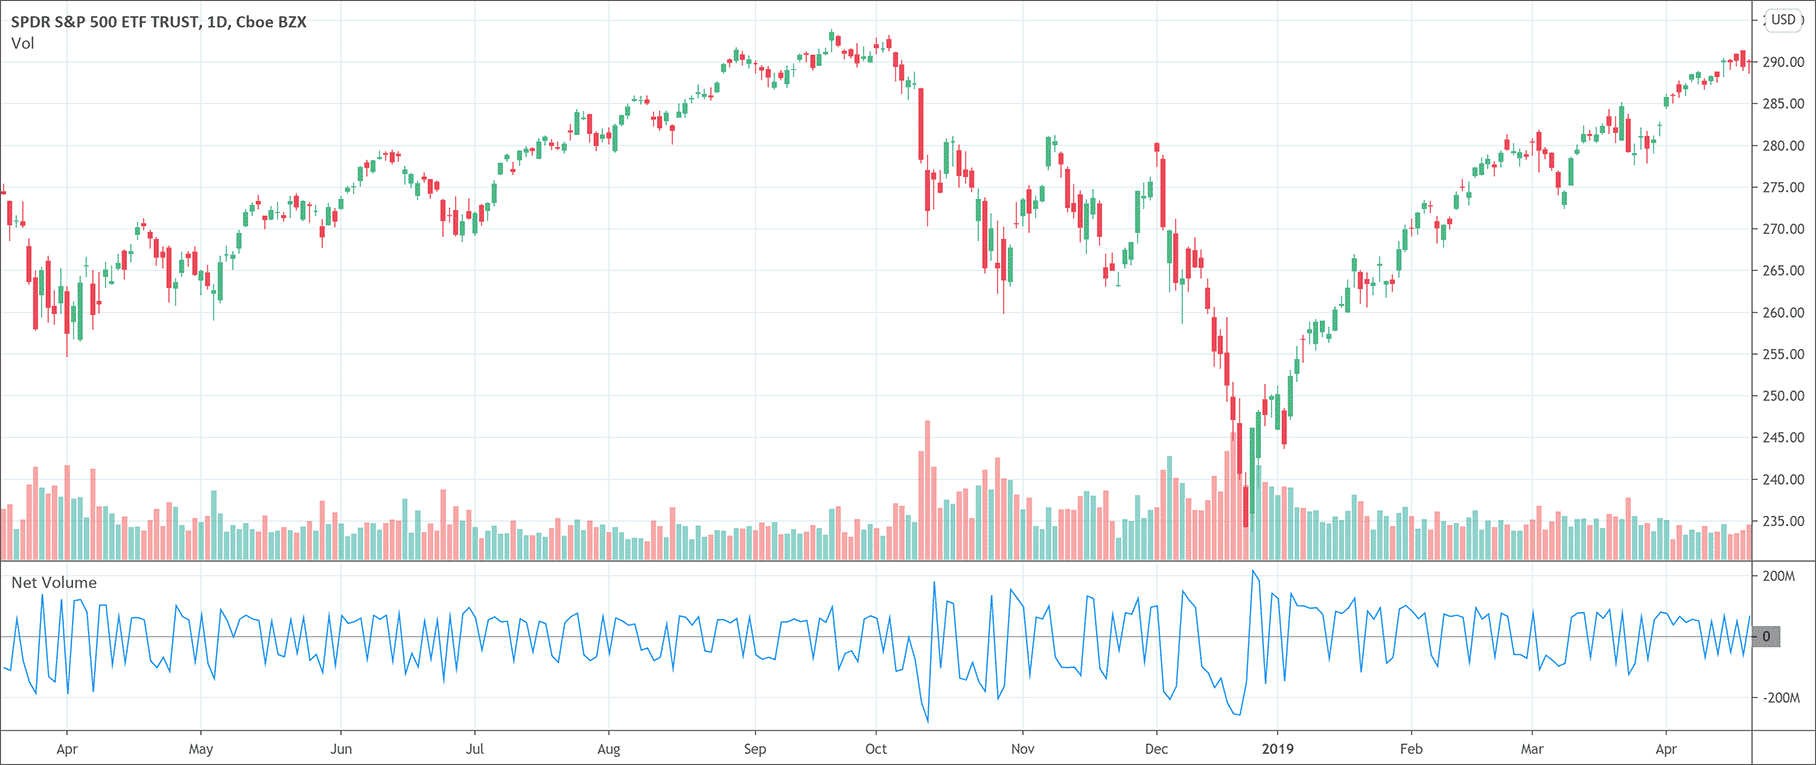
- Net volume indicator is a simple technical analysis tool that works on a simple calculation.
- It is the difference between a security’s uptick volume and its downtick volume.
- A positive value indicates that volume uptick and buying pressure is greater than the volume downtick and the selling pressure (it’s the opposite for a negative value).
Many of the market players often neglect a very important piece of information and that is volume. Volume is the second most important factor in forex trading after price action. It is important to note that learning to interpret volume offers great advantages. It brings considerable help for the traders and technical analysts as far as analysis of the market is concerned. This article will tackle the net volume indicator.
Apart from the volume itself, there are many indicators that work on the basis of volume. The use of these indicators has always helped traders and technical analysts to observe what is happening and what is about to happen in the market. Therefore, volume and volume indicators are very important in trading and technical analysis of the market. Among so many volume indicators, the net volume indicator is also a very useful indicator.
What is the net volume indicator?
Net volume indicator is a simple technical analysis tool that works on a simple calculation. It is the difference between a security’s uptick volume and its downtick volume. It is the working principle of the indicator. The formula of the net volume indicator is the following.
Net volume = Security’s uptick volume – Security’s downtick volume
The indicator is significantly different from other volume indicators because it clearly indicates whether a market is bearish or bullish. The indicator usually displays the net volume below the price chart while the bars exhibit its value for each selected period of time that gets plot on the chart.
How does the net volume indicator work?
The working of the indicator is so simple. It aggregates the total positive and negative movements of the prices over the given period of time. When the total rise of the movement is greater than the total fall in movements, the net volume indicator gives a positive net volume and vice versa.
What does the indicator tell traders?
The indicator is a simple indicator and yet it tells many things to traders. It is distinct and far superior to many other volume indicators only because of its many advantages. It is distinctive because it clearly indicates whether the market is bullish or bearish. Traders also use it to find out the market direction and sentiment apart from just discovering the net volume values.
A positive net volume value indicates that volume uptick and buying pressure is greater than the volume downtick and the selling pressure. On the other hand, a negative net volume indicates just the opposite of the positive net volume scenario. The indicator, in the simplest of terms, can easily gauge for the traders the selling or buying pressure of a security during a specified period of time.
Bottom line
Net volume indicator is a simple technical analysis tool that works by subtracting the downtick volume of security from the uptick volume over a specified period of time. It helps to understand the market direction, its sentiment, and gauges the selling or buying pressure of an asset. Although it is a simple indicator, yet it has the potential to serve traders is in multiple ways.

 Good Trading requires the Best Charting Tool!

 We loved Marwood Research’s course “Candlestick Analysis For Professional Traders“. Do you want to follow a great video course and deep dive into 26 candlestick patterns (and compare their success rates)? Then make sure to check this course!