 Good Trading requires the Best Charting Tool!
Key takeaways
- A marubozu candle only has a body. It doesn’t have wick or tail.
- Bullish marubozu is a long green body candle
- Bearish marubozu is a long red body candle
Statistics to prove if the Marubozu pattern really works
Are the odds of the Marubozu pattern in your favor?
How does the Marubozu behave with a 2:1 target R/R ratio?
From our research the Marubozu pattern confirms 88.3% of the time on average overall all the 4120 markets we analysed. Historically, this patterns confirmed within 0.6 candles or got invalidated within 4.2 candles. If confirmed, it reached the 2:1 R/R target 30.5% of the time and it retested it's entry price level 98.6% of the time.
Not accounting for fees, it has an expected outcome of -0.085 $/$.
It means for every $100 you risk on a trade with the Marubozu pattern you lose $8.5 on average.
Want to account for your trading fees? Have the detailled stats for your favorite markets / timeframes? Or get the stats for another R/R than 2:1?
🚀 Join us now and get fine-tuned stats you care about!
How to handle risk with the Marubozu pattern?
We analysed 4120 markets for the last 59 years and we found 538 662 occurrences of the Marubozu pattern.
On average markets printed 1 Marubozu pattern every 29 candles.
For 2:1 R/R trades, the longest winning streak observed was 13 and the longest losing streak was 598. A trading strategy relying solely on this pattern is not advised. Anyway, make sure to use proper risk management.
Keep in mind all these informations are for educational purposes only and are NOT financial advice.
If you want to learn more and deep dive into candlestick patterns performance statistics, I strongly recommend you follow the best available course about it. Joe Marwood (who's a famous trader with more than 45 000 Twitter followers) created an online course called "Candlestick Analysis For Professional Traders" in his Marwood Research University. There he will take you through the extensive backtesting of the 26 main candlestick patterns. He then summarizes which one is THE best pattern. Do you know which one it is?
Remember, don't trade if you don't know your stats. Click here to signup to the course now!
What is the Marubozu candlestick pattern?
Marubozu means “bald head” or “shaved head” in Japanese, and this is shown in the absence of wicks or shadow on the candlestick, meaning that the opening or closing price will be the same as the maximum prices of the candle. The absence of shadow indicates that the trading session opened at a high price and close at a low price at the end of the day (or the opposite). The Marubozu candlestick pattern can provide analytical insight into the future direction of the price of a stock.
How to identify the Marubozu candlestick pattern?
It is fairly easy to identify a marubozu pattern because it is a single candlestick having a real body without any kind of shadows. Typically, when bullish, they are white or green on stock charts and when bearish, they are red or black. In bearish marubozu, the open price is equal to the high price and the close price is equal to the low price. For bullish marubozu, the open price is equal to the low price and the close price is the same as the high price.
The identification mark for an ideal spinning top will be:
- A large real body
- There will be no shadow at either sides of the candle
- The color of the candle will be of a significant meaning
In actual market conditions, a perfect marubozu is rare. Therefore, there is a minor difference sometimes – usually less than 0.01 percent of the candle range, between the open/close prices with high/low price is neglected when identifying a marubozu.
What does the Marubozu pattern tell traders?
Marubozu candlesticks can be found on all stock charts and all time frames. Depending on who controlled the day, they can either be bullish or bearish. They are used with technical analysis to show how a stock traded for the day. Usually, stock trading is a competition between buyers and sellers. There are days when one side wins by far, therefore the formation of the marubozu candlestick pattern.
It is a single candlestick pattern that can give insight into the sentiments of the market at a given time. Basically, its appearance means that the market traded to the close without any lasting retracement.
How to trade when you see the Marubozu pattern?
The color of the candlestick shows that either the sellers or buyers have full control of the market. The style of trading will vary depending on the type of marubozu. Before entering a trade, it is advisable for you to wait for another confirmation pattern or candle.
Trading with Bullish Marubozu
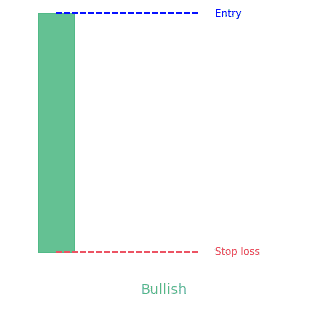
The absence of a lower and upper shadow in a bullish marubozu indicates that the low price is the same as the open price and the high price is equal to the close price. Therefore, when you see a candle with open=low and close=high, that is called a bullish marubozu.
This kind of candlestick shows that there is so much buying interest in the stock or the market participants are willing to buy the stock at any price during that trading session. Hence, the price of the stock closed near the high point for that session. If the bullish marubozu is shown at an uptrend, this strongly implies a trend continuation. But when it appears in a downtrend, it shows a trend reversal, that the sentiment of the market has changed and the stock is now bullish.
It is expected that when this sharp change happens, there will be a surge of bullish patterns that are likely to persist over the next trading sessions. Therefore, a trader should look for buying opportunities after the occurrence of a bullish marubozu. It is suggested that the buy price is slightly above the closing price of the bullish marubozu.
Trading with Bearish Marubozu
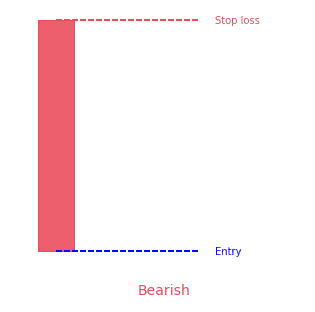
A bearish marubozu shows that the high price is equal to the open price and the low price is equal to the close price. Therefore, when you see a candle with open=high and close=low, that can be called a bearish marubozu.
This shows that the sellers are in total control of the market. There is so much selling pressure on the stock that the participants of the market are willing to sell the stock at any point during the trading session. Hence, the price of the stock closed near the low point for the session. If the bearish candlestick appears in a downtrend, it means a strong trend continuation. But if it appears in an uptrend, it works as a trend reversal pattern, that is, the sentiment of the market has changed and the stock is now bearish.
It is expected that with this sharp sentiment change there will be a surge of bearishness and it will continue over the next few trading sessions. Therefore, a trader should look for opportunities to sell after the occurrence of a bearish marubozu. The suggested selling price is slightly below the closing price of the marubozu.
How to avoid false Marubozu signals and setting stop-loss
In most instances, the stop-loss for any trade taken on the basis of a marubozu candlestick should be low or high of the candle. Although marubozu is a strong candlestick pattern, it is wise to avoid extremely small (less than 0.5 percent range) or long candle (over 5 percent range).
A candle that is extremely small means a reduced trading activity and therefore it may be a false signal. At the same time, a long candle indicates extreme activity and in that case, the stop-loss for the trade will be deep. Because of this, avoid trading on candles that are either too long or too short. Also, take additional confirmation from another pattern or technical analysis before going into a trade.
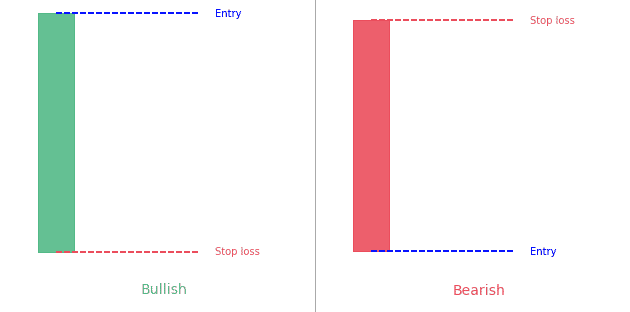
Basically, when trading marubozu candlesticks,
- Watch for bullish or bearish candlesticks to form
- If bullish, take a long when price breaks above
- Place stop below candlesticks
- If bearish, take a short when price falls below
- Place a stop above candlestick
Summary
Marubozu candlesticks can be seen in all chart time frames. One signal alone is not enough to justify a trade. It is necessary to see what the technical analysis is indicating as well as the patterns they are part of. It might seem easy for you to trade during the day using marubozu candlestick patterns, since one side is in control of the day. Take time to study the candlesticks to sharpen your trading skills.
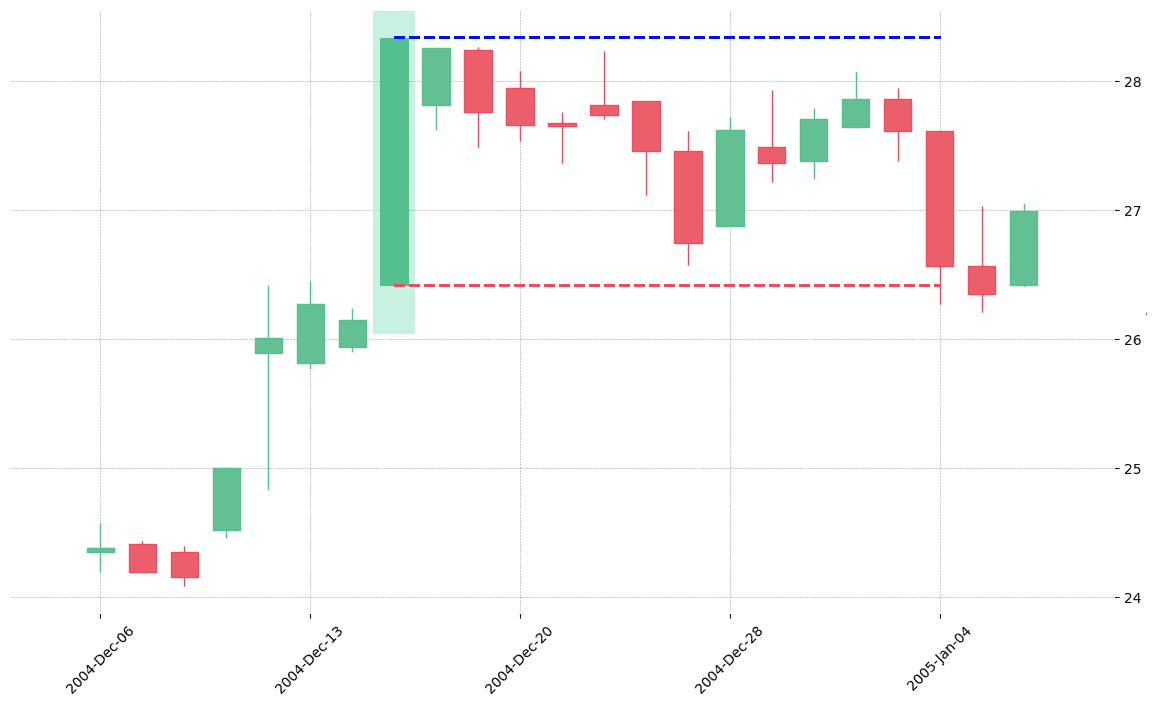
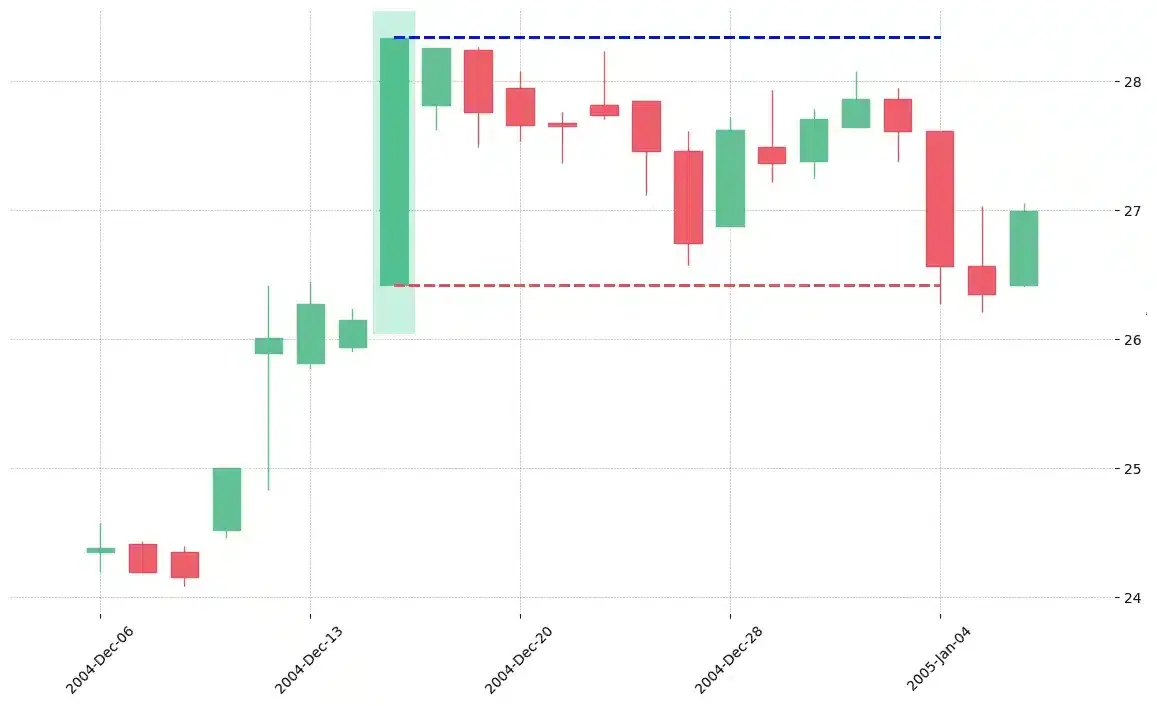
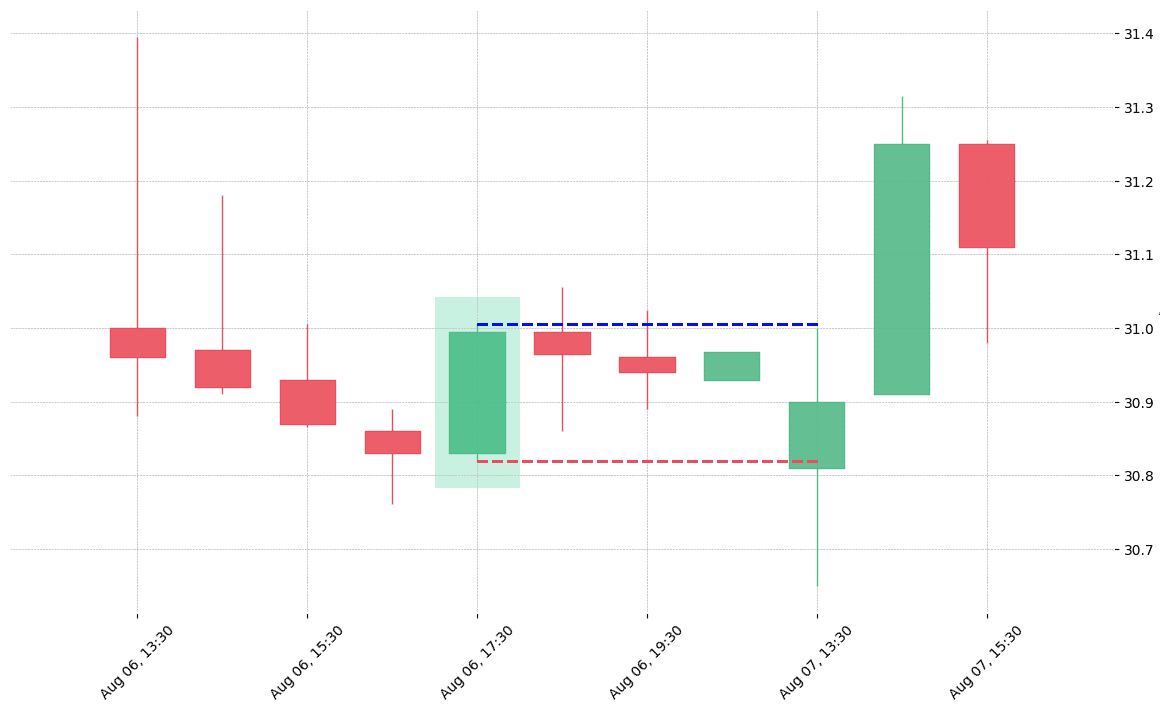
How does the Marubozu pattern look in real life?


Looking to learn more about this pattern?
You should take a look at Joe Marwood's online course. In his course, he backtested the 26 main candlestick patterns before to summarize which one is THE best pattern. I really liked his course and you shouldn't miss it!
Click here to signup to his "Candlestick Analysis For Professional Traders" course now!


 We loved Marwood Research’s course “Candlestick Analysis For Professional Traders“. Do you want to follow a great video course and deep dive into 26 candlestick patterns (and compare their success rates)? Then make sure to check this course!