
 Good Trading requires the Best Charting Tool!
- The kicking candlestick pattern is a 2-bar reversal pattern.
- It is made of two opposite side marubozus separated by a price gap.
Statistics to prove if the Kicking pattern really works
Are the odds of the Kicking pattern in your favor?
How does the Kicking behave with a 2:1 target R/R ratio?
From our research the Kicking pattern confirms 92.4% of the time on average overall all the 4120 markets we analysed. Historically, this patterns confirmed within 0.4 candles or got invalidated within 4.5 candles. If confirmed, it reached the 2:1 R/R target 29.4% of the time and it retested it's entry price level 99.7% of the time.
Not accounting for fees, it has an expected outcome of -0.117 $/$.
It means for every $100 you risk on a trade with the Kicking pattern you lose $11.7 on average.
Want to account for your trading fees? Have the detailled stats for your favorite markets / timeframes? Or get the stats for another R/R than 2:1?
🚀 Join us now and get fine-tuned stats you care about!
How to handle risk with the Kicking pattern?
We analysed 4120 markets for the last 59 years and we found 1 517 occurrences of the Kicking pattern.
On average markets printed 1 Kicking pattern every 10 285 candles.
For 2:1 R/R trades, the longest winning streak observed was 5 and the longest losing streak was 17. A trading strategy relying solely on this pattern is not advised. Anyway, make sure to use proper risk management.
Keep in mind all these informations are for educational purposes only and are NOT financial advice.
If you want to learn more and deep dive into candlestick patterns performance statistics, I strongly recommend you follow the best available course about it. Joe Marwood (who's a famous trader with more than 45 000 Twitter followers) created an online course called "Candlestick Analysis For Professional Traders" in his Marwood Research University. There he will take you through the extensive backtesting of the 26 main candlestick patterns. He then summarizes which one is THE best pattern. Do you know which one it is?
Remember, don't trade if you don't know your stats. Click here to signup to the course now!
The kicking candlestick pattern is a two-bar trading pattern that signals an upcoming reversal of the current trend in the market. It signals a sudden change in the market. The kicking candlestick pattern often appears after a surprise event or news announcement before or after market hours. The gap between the two candles of the kicking pattern sets the significance of the signal. The kicking pattern is one of the most popular trading patterns because it is among the strongest and most influential trading patterns that cannot be overlooked. However, the kicking candlestick pattern is a very rare pattern. Moreover, traders simply do not change their opinion about a stock so quickly and dramatically.
There are two variants of the kicking pattern, bearish and bullish depending on the trend in which the kicking pattern appears.
The bullish kicking candlestick pattern
How to identify the pattern?
The bullish kicking candlestick pattern appears during a downtrend and it signals an upcoming bullish reversal of the current bearish trend in the market. It consists of two candlesticks. The first day’s candle is a black Marubozu and the second day’s candle is a white marubozu with an upward gap between them. These two Marubozu candles of the bullish kicking pattern are enough to successfully identify the pattern. However, it is important to note that both of the candles must be Marubozu candles without any shadows.
What does it tell traders?
The bullish kicking pattern tells traders about an upcoming trend reversal. The formation of the first candle indicates the current downtrend in the market. But some major event occurs and moves prices high that causes the second candle to gap up. The price moves upward at a great pace with remarkable bullish enthusiasm. It is not only a sudden appearance of a bullish candle after a bearish candle, the strength of the transition is so significant that it causes a gap between the two candles.
The bearish kicking candlestick pattern
How to identify the pattern?
The bearish kicking candlestick pattern appears during an uptrend and it signals an upcoming bearish reversal of the current bullish trend in the market. It consists of two candlesticks. The first day’s candle is a white Marubozu and the second day’s candle is a black marubozu with a downward gap between them. The downtrend continues and prices finally close at the low of the trading session. The length of the candles is important as they define the extent of the reversal. The gap is important because larger gaps mean the more remarkable reversal.
What does it tell traders?
The bearish kicking candlestick pattern tells traders about an upcoming downtrend. The formation of the first candle indicates the current bullish sentiment in the market. Greater the length of the candle, greater is the strength of the bulls in the market. The appearance of the second candle creates a gap low indicating the reversal of the uptrend to a downtrend. The occurrence of the second candle also signifies the happening of some major event that causes prices to dramatically fall. The prices now decline at a significant pace with remarkable bearish enthusiasm.
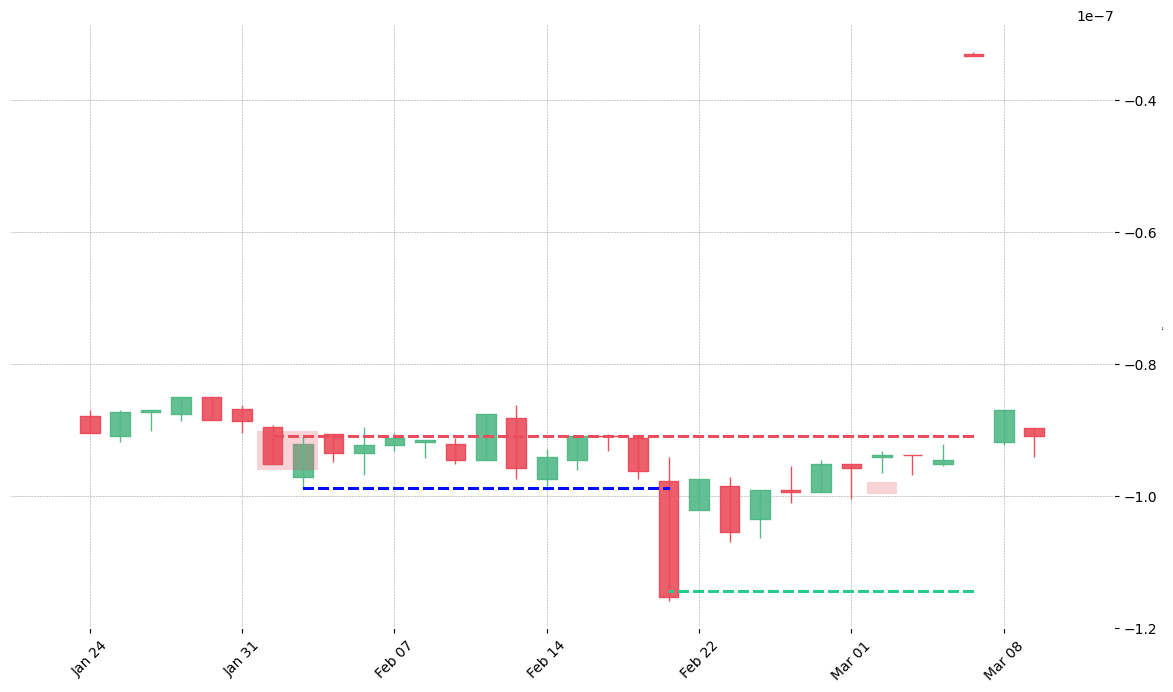
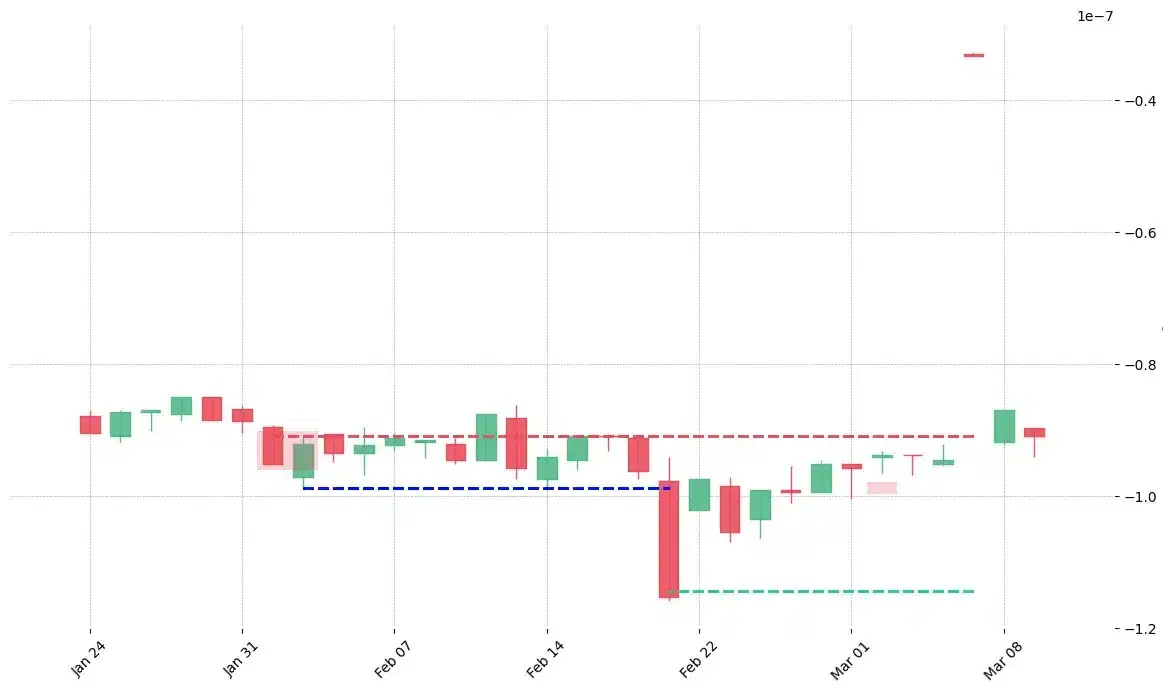
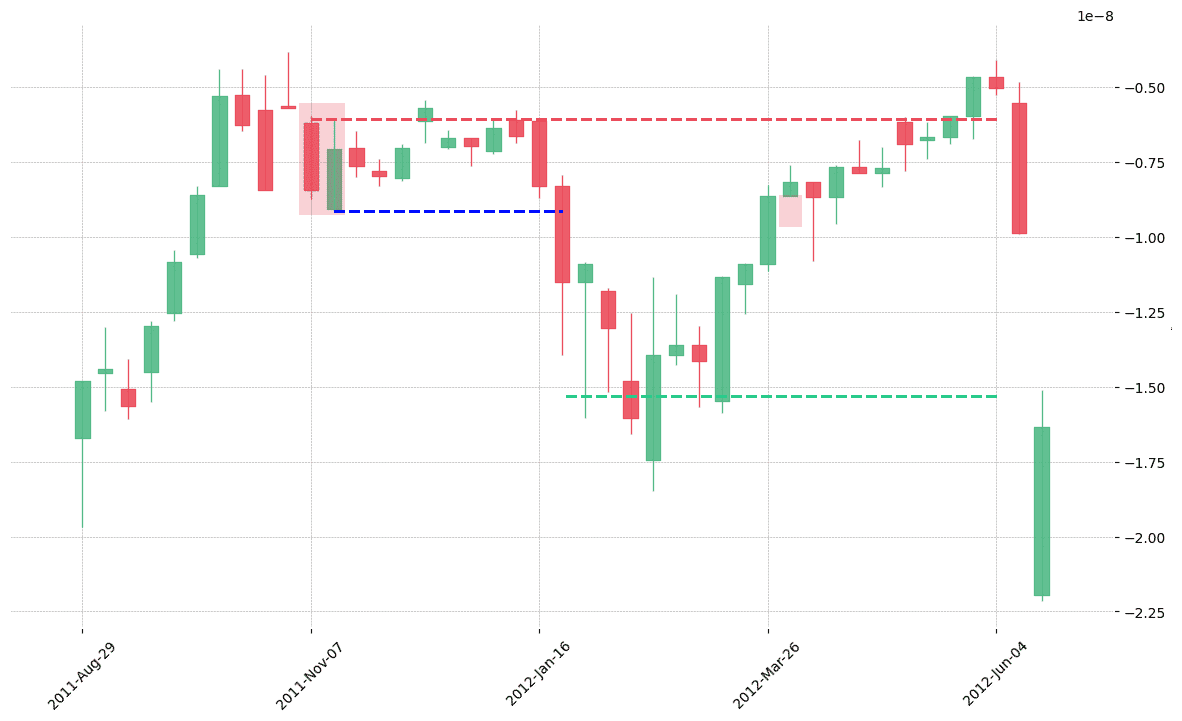
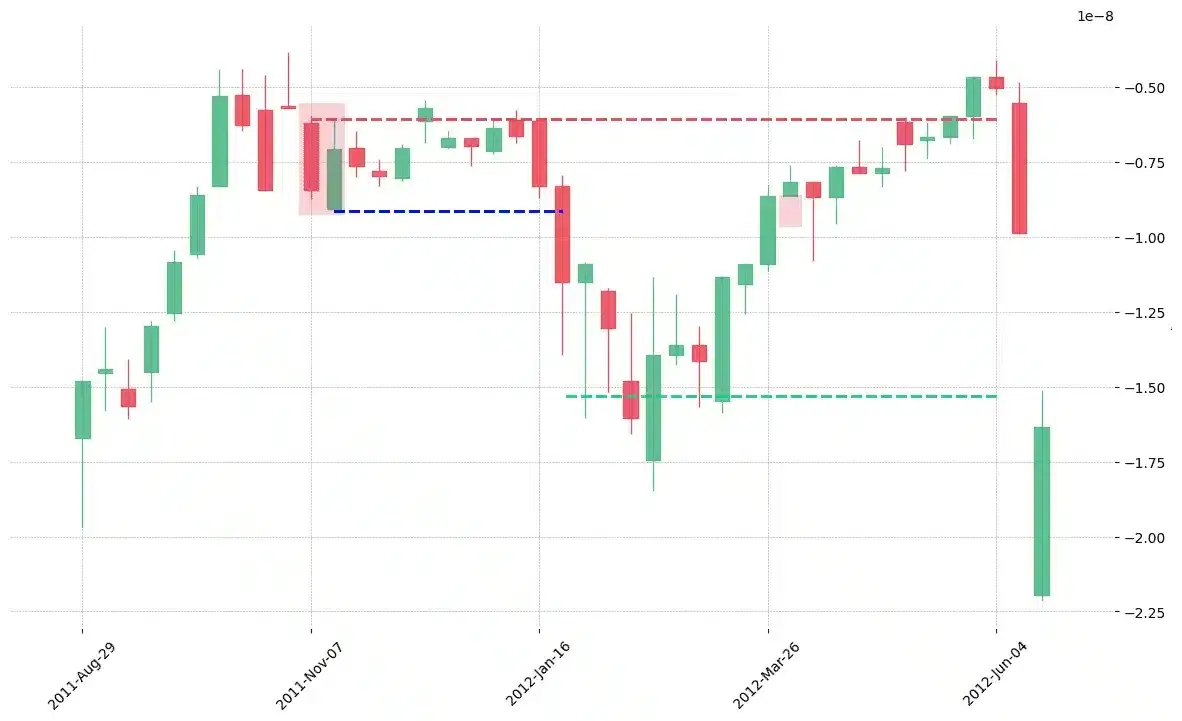
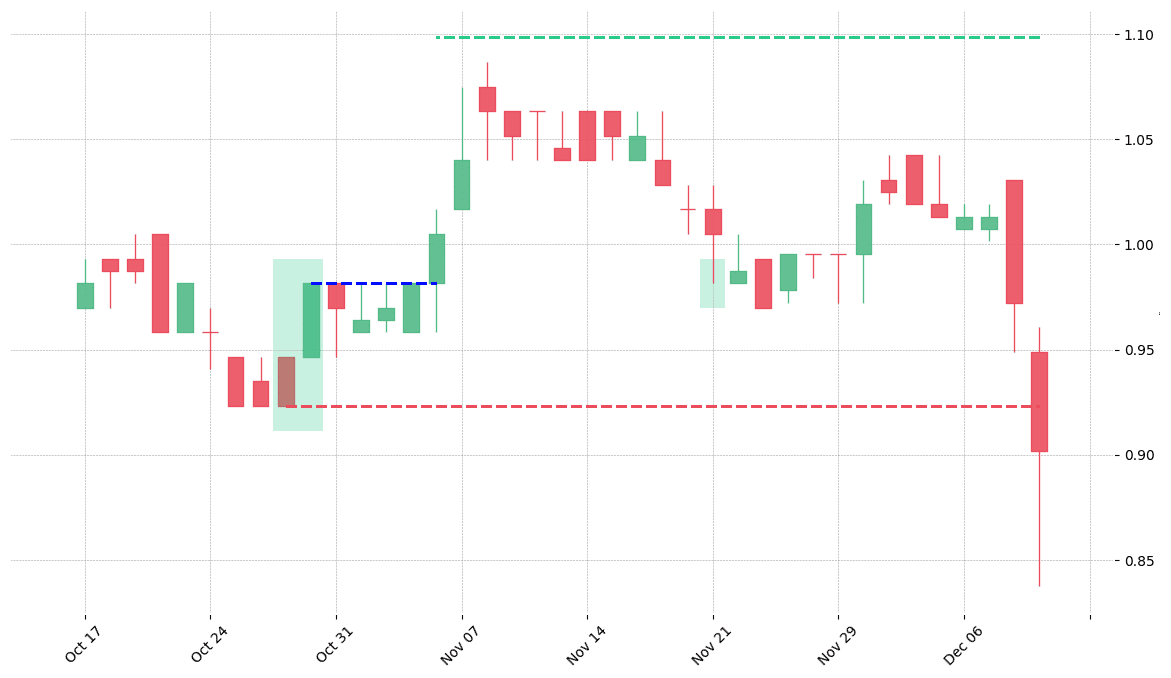
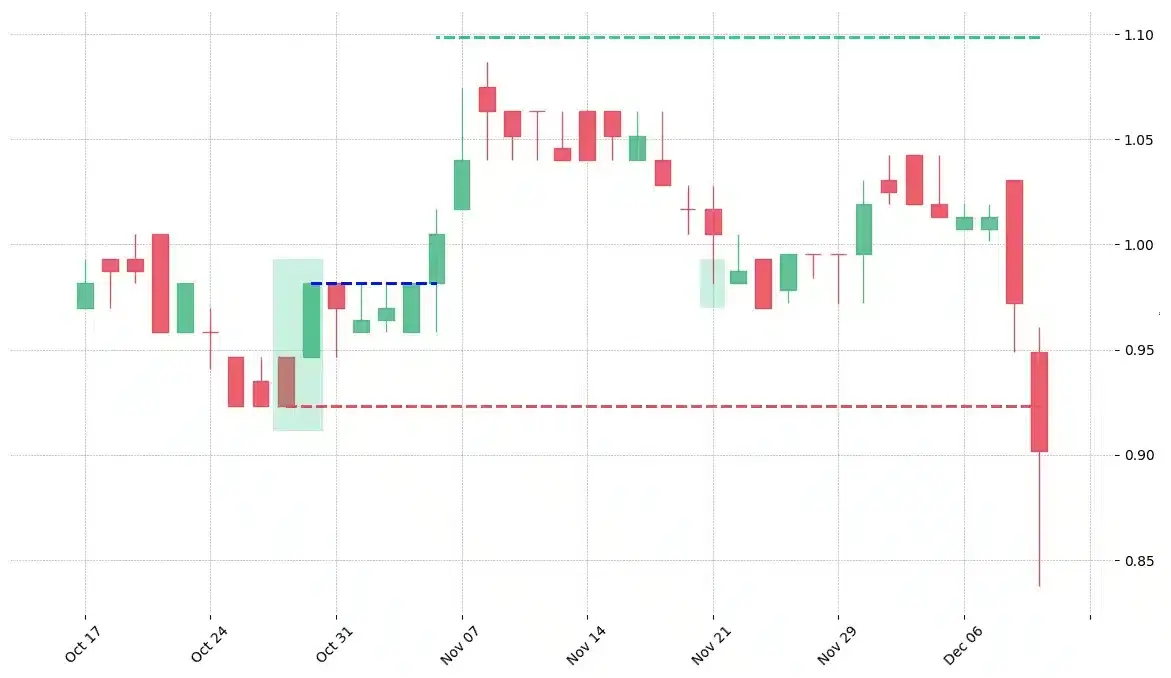
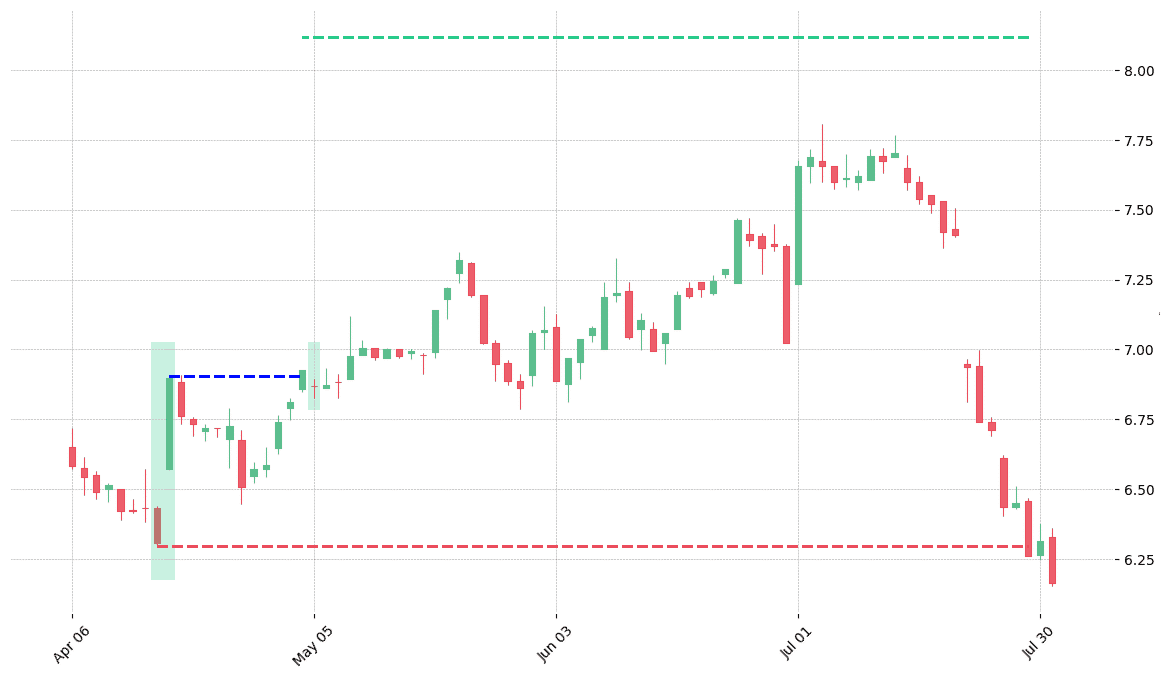
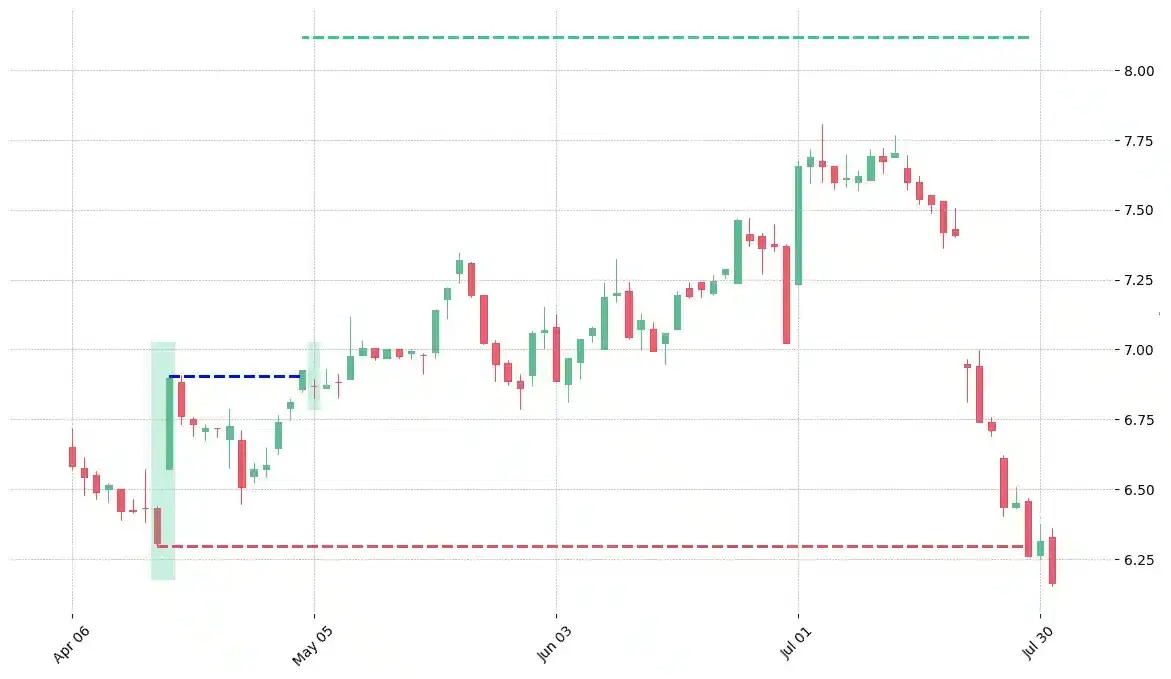
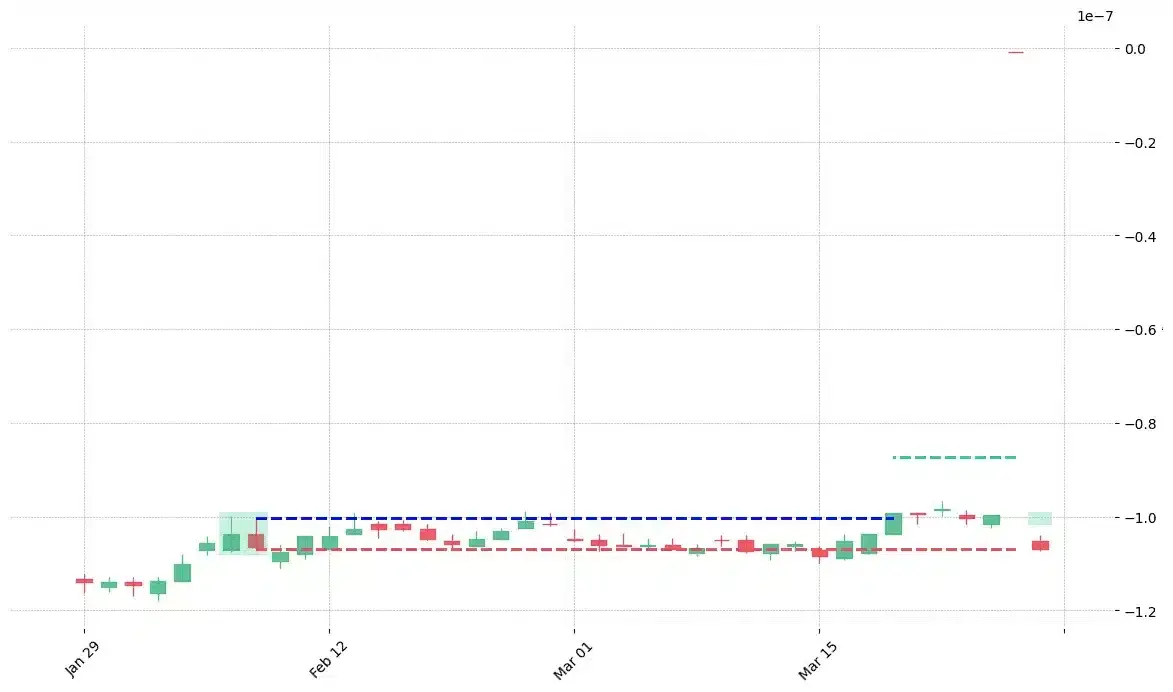
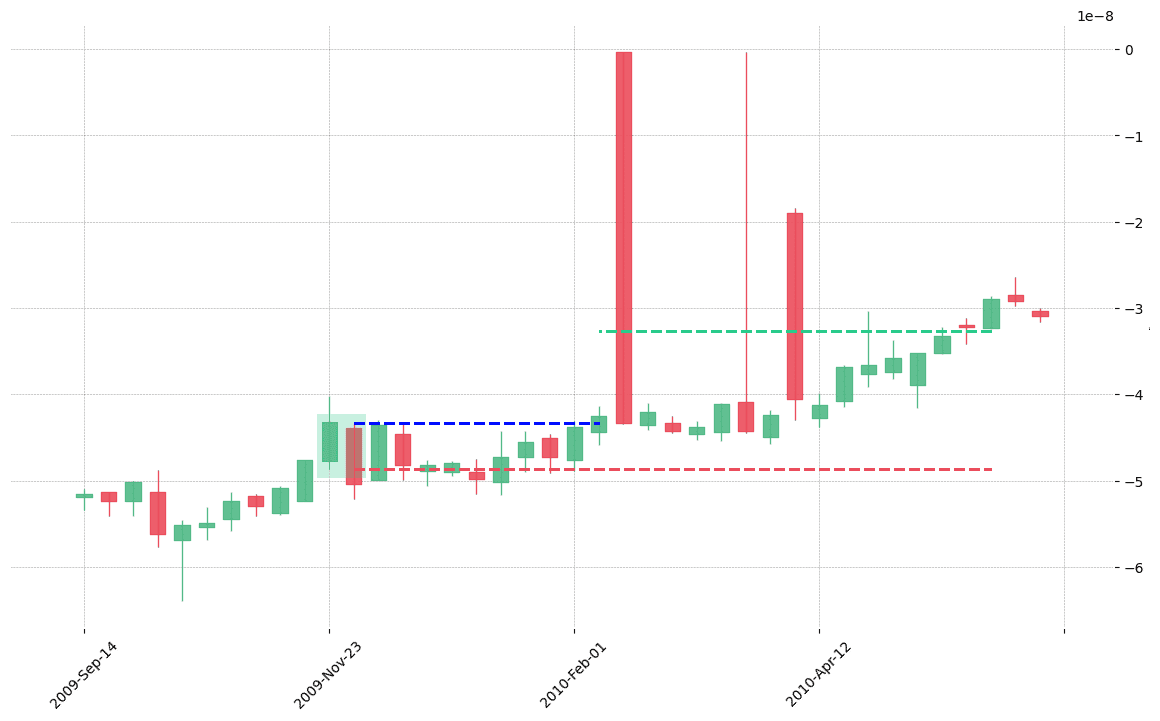
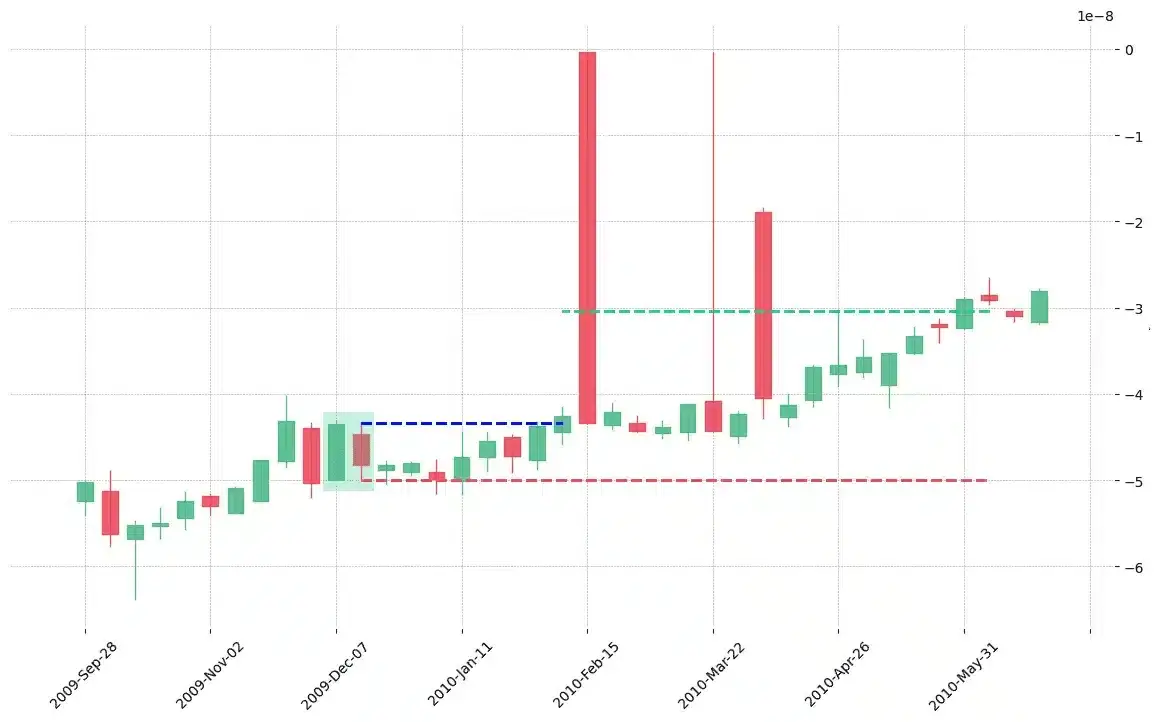
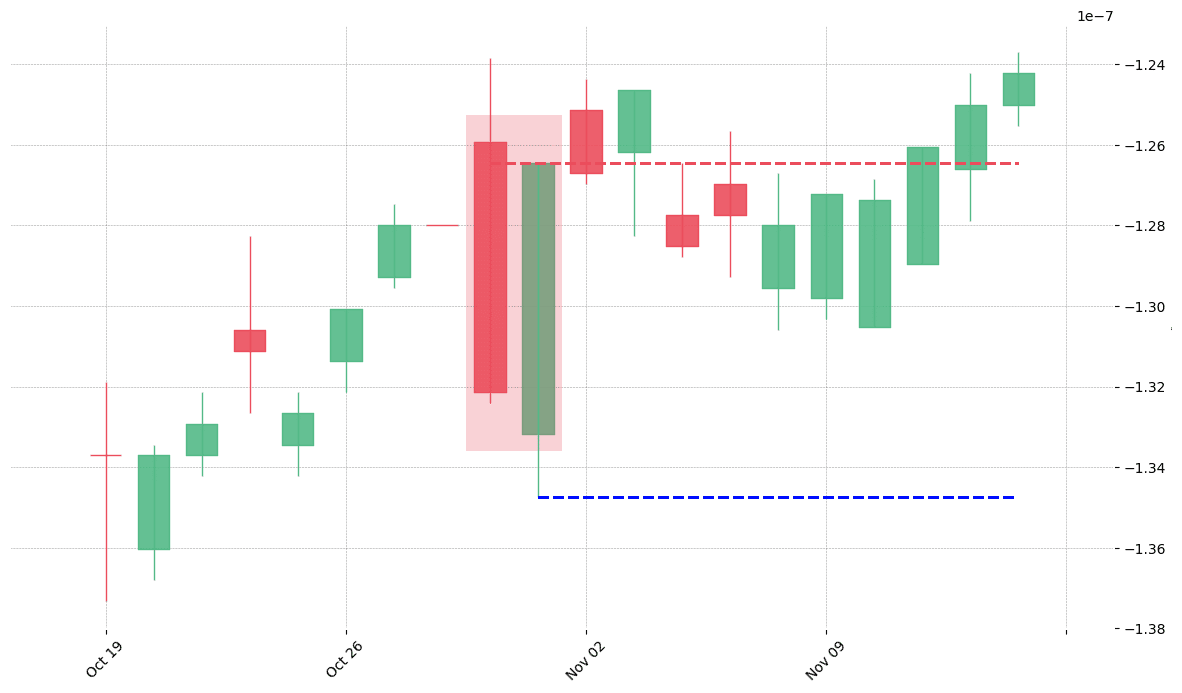
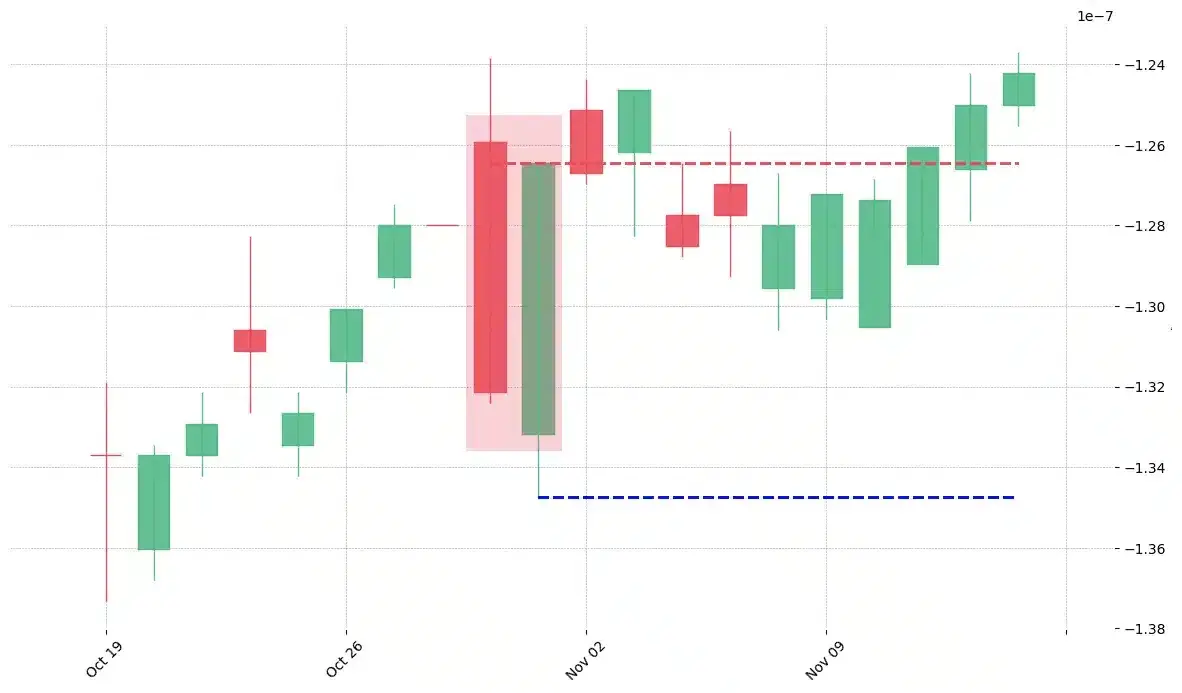
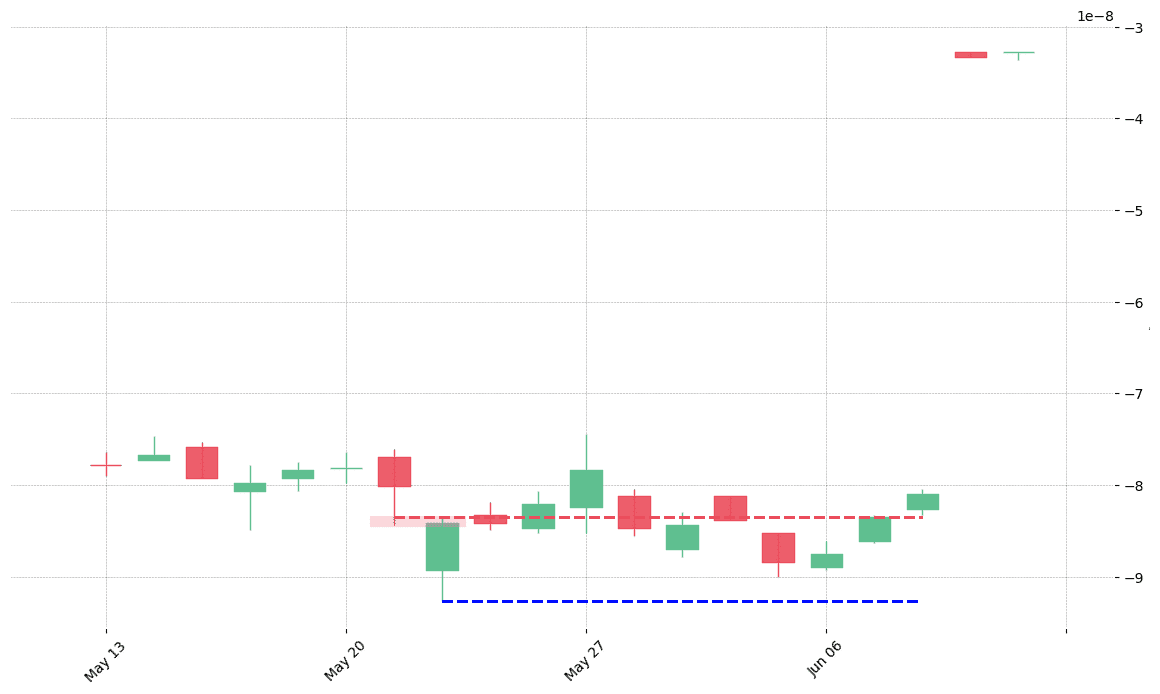
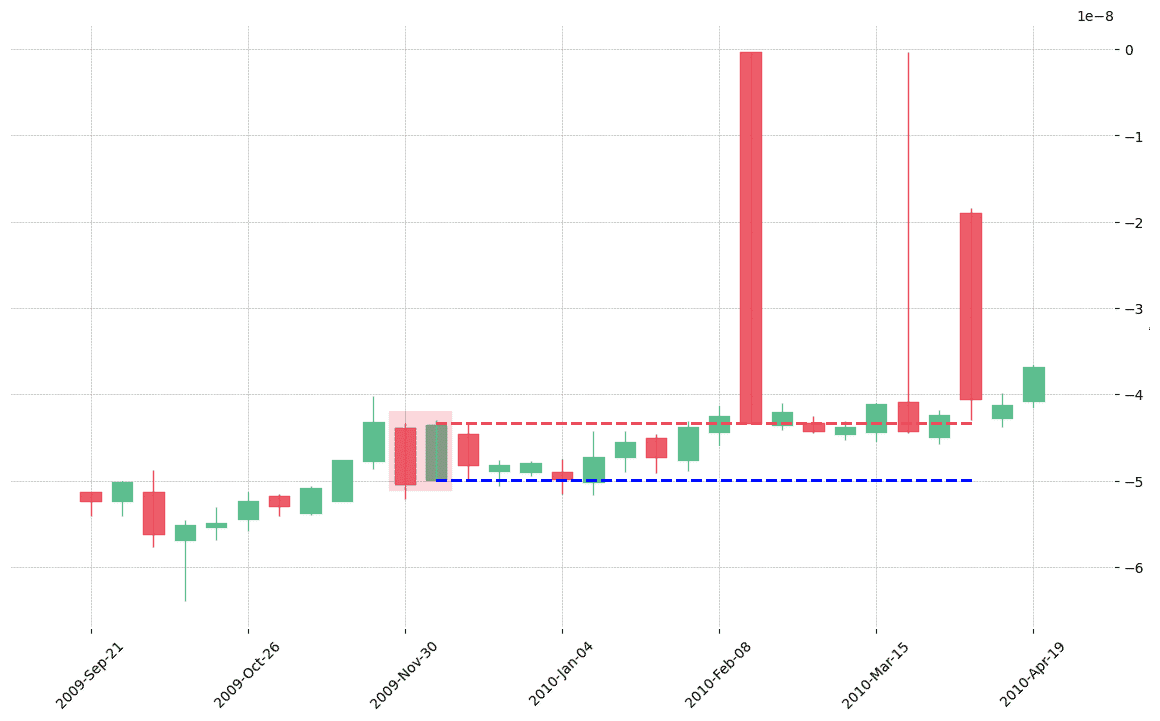
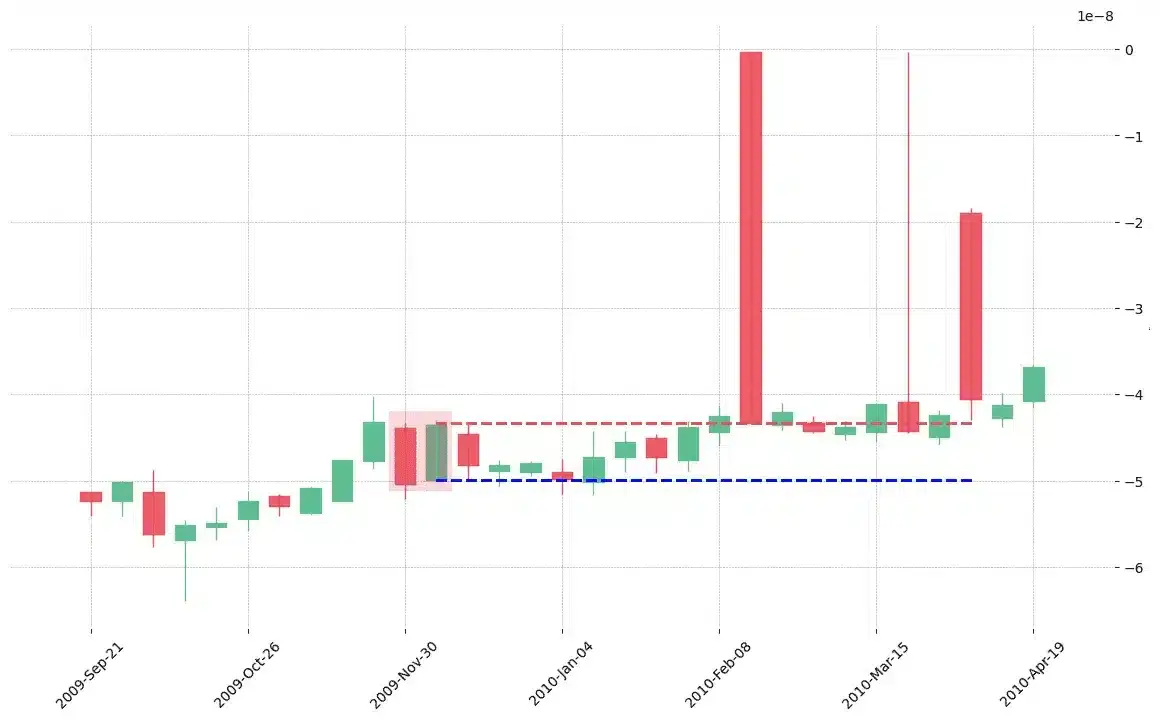
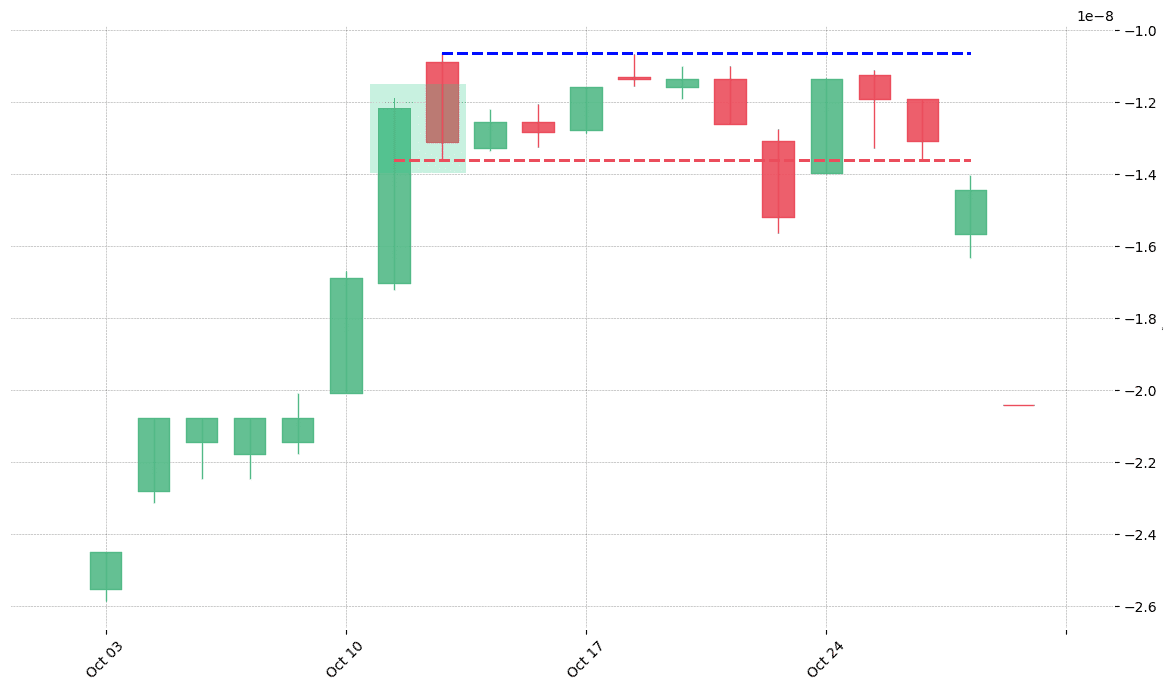
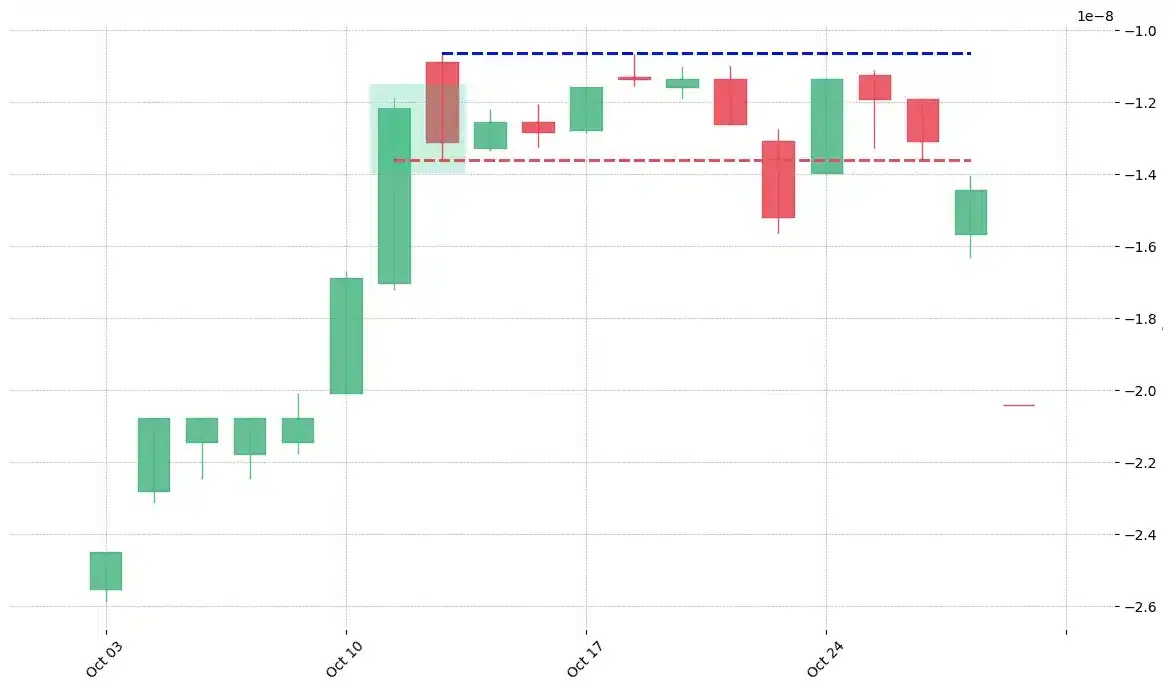
How does the Kicking pattern look in real life?


Looking to learn more about this pattern?
You should take a look at Joe Marwood's online course. In his course, he backtested the 26 main candlestick patterns before to summarize which one is THE best pattern. I really liked his course and you shouldn't miss it!
Click here to signup to his "Candlestick Analysis For Professional Traders" course now!


 We loved Marwood Research’s course “Candlestick Analysis For Professional Traders“. Do you want to follow a great video course and deep dive into 26 candlestick patterns (and compare their success rates)? Then make sure to check this course!