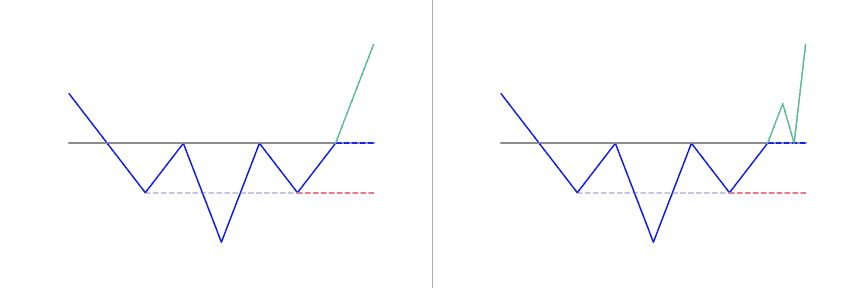
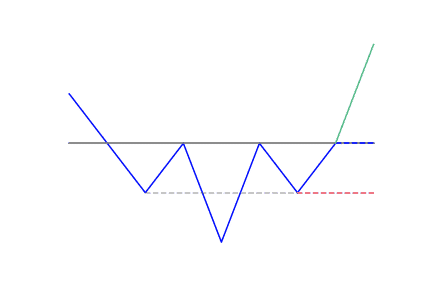
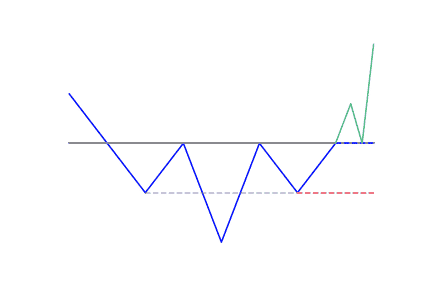
Traders apply charts when studying various patterns in market trends, including the inverse head and shoulders pattern. This pattern is characterized by three troughs (both the upward head and shoulders have peaks), with the middle trough being the deepest. An inverse head and shoulders pattern can appear in all markets, all the time. It is linked with the reversal of a downward trend.
- The Inverse Head and Shoulders (iH&S) bottom pattern is composed of three peaks.
- The two outside peaks are about the same height, and the middle one is the lowest.
- It is a reversal pattern, from bearish to bullish.
What is the Inverse Head and Shoulders pattern?
An inverse head and shoulders (iH&S), also called upside-down head and shoulder pattern or head and shoulders bottom, is similar to the head and shoulders pattern, but inverted. The head and shoulders top used to predict downtrend reversals. This pattern is a trend reversal chart pattern. IH&S confirms when the price action of a security meets these qualities:
- It falls to a trough and then rises
- It falls below the former trough and then rises again
- The price falls again but not as far as the second trough.
Once the third and final trough is made, the price heads upward toward the resistance found near the top of the previous troughs (called the neckline). The iH&S is a bullish chart pattern that indicates that buyers are in control.
How to identify the Inverse Head and Shoulders?
Inverse Head and Shoulders prepares a bullish trend reversal
The inverse head and shoulders pattern is an indicator. It shows a reversal of a downward trend in price. It is one of the most common trend reversal indications.
As the price goes downward, it reaches a low point (a trough) and then starts to recover and move upward. Market resistance then drags it back down into another trough.
3 troughs proves sellers’ exhaustion
Price drops to a point where the market cannot support lower prices and the price starts to rise again. Again, market resistance forces the price back down, and the price declines one last time. If the market is unable to support a lower price, it doesn’t get to the prior low. This causes a higher low before prices rise again. This swings creates three low points, or troughs. They called the left shoulder, head, and right shoulder.
- Left Shoulder: This is a pullback against the downtrend because of profit-taking or eager buyers stepping into the market.
- Head: Means sellers are still in control as they push the price lower. However, buyers are also stepping in, which explains the “stronger” pullback to re-test the previous swing high.
- Right Shoulder: Indicates that sellers are getting weak as they’re unable to push the price lower. Rather, the buyers are getting stronger as they continue to push the price higher, re-testing the area of resistance (which was the initial swing high).
Neckline breakout signifies buyers won
The inverse head and shoulders pattern is confirmed if the price breaks above resistance, thus the market could continue higher. It represents a possible exhaustion point in the market, where traders can start looking for buying opportunities as the market establishes a bottom and starts to climb higher.
You will notice two rallies or pullbacks occurring during this pattern. One occurs after the left shoulder and the other occurs after the head. The high points of these pullbacks connect with a trend line, and extend out to the right. This trend line is referred to as the neckline, or resistance line.
What does the Inverse Head and Shoulders tell traders?
Inverse Head and Shoulders offers clear guidelines
Typically, traders enter into long positions when the price increases above the resistance of the neckline. The first and third troughs are seen as shoulders and the second peak makes up the head. A move over the resistance, also called the neckline, is used as an indication of a sharp move higher. Most traders observe for a large spike in volume to confirm the authenticity of the breakout. This pattern is the opposite of the popular head and shoulders pattern but is used to predict shifts in a downtrend rather than an uptrend.
A suitable profit target can be confirmed by determining the distance between the bottom of the head and the neckline of the pattern and making use of that same distance to determine how far price may move in the breakout direction. For instance, if the distance between the head and neckline is 10 points, the profit target is set 10 points above the neckline of the pattern. An aggressive stop-loss order can be placed below the breakout price bar or candle. On the other hand, a conservative stop-loss order can be placed below the right shoulder of the inverse head and shoulders pattern.
3 distincts parts
This pattern is comprised of three parts:
- After long bearish trends, the price falls to a trough and then rises to make a peak.
- Again, the price falls to form a second trough below the previous low and increases yet again.
- The price falls for a third time, but only to the level of the first trough, before rising once more and reversing the trend.
How to trade when you see the Inverse Head and Shoulders?
The neckline is the point of interest
Since the inverse head and shoulders are bottoming patterns after completion, traders are advised to focus on buying, or taking long positions (owning the asset). The pattern completes when the price of the asset rallies over the neckline of the pattern, or breaks through the line of resistance.
When the price rallies above the neckline following the right shoulder, traders refer to this as a breakout, and that signals a completion of the inverse head and shoulders.
Traditionally, you should trade the inverse head and shoulders by going into a long position when the price moves above the neckline. You should also put a stop-loss order just below the low point of the right shoulder.
What to focus on to increase the odds of success?
The neckline works well as an entry point if the two retracements (the short intervals in the trend, or the smaller trough) in the pattern got to similar levels, or the second retracement hits slightly lower than the first.
If the right shoulder is above the first, the trend line will angle upwards, and therefore won’t provide a good entry point (too high). In this instance, buy or enter long when the price moves above the high of the second retracement.
Also, make use of this entry point if the second retracement high is much lower than the first. Use it as an entry point if the neckline trend gradually descends. If the neckline shows a steep angle, either up or down, apply the high of the second retracement as an entry point.
There are two ways of trading the inverse head and shoulders, which are:
Aggressive trading an Inverse Head and Shoulders
Traders can set a stop-buy order just above the neckline of the inverse head and shoulders pattern. This ensures a trader enters on the first break of the neckline, gaining upward momentum. Disadvantages of this strategy include the possibility of a false breakout and higher slippage to order execution.
Conservative trading an Inverse Head and Shoulders
A trader can wait for the price to close above the neckline; this is effectively waiting for confirmation that there’s a valid breakout. By applying this strategy, a trader can enter on the first close above the neckline. Alternatively, a limit order can be placed at or just below the broken neckline, attempting to get an execution on a retrace in price. Waiting for a retrace is likely to result in less slippage; however, there is the possibility of missing the trade if a pullback does not occur.

 Good Trading requires the Best Charting Tool!


 We loved Marwood Research’s course “Candlestick Analysis For Professional Traders“. Do you want to follow a great video course and deep dive into 26 candlestick patterns (and compare their success rates)? Then make sure to check this course!