
 Good Trading requires the Best Charting Tool!
Trading price action usually brings about surprise and excitement at the same time. Price is commonly used as a base for any technical analysis, and the hikkake trading strategy takes in consideration three price action bars to identify the pattern.
The pattern looks like a three inside up pattern but without constraints. The pattern doesn’t need a downtrend nor does the direction of the candles matter. They are both in the three inside up candlestick patterns. It can indicate both a continuation of the trend or a reversal. The biais depends on the direction of the breakout (above or below a previous low or high).
- The Hikkake candlestick pattern is a (quite) complex 5-candles pattern.
- Depending on how it forms it can be bullish or bearish.
- It is built with an inside day, a fake out move and then a reversal-and-breakout move.
Statistics to prove if the Hikkake pattern really works
Are the odds of the Hikkake pattern in your favor?
How does the Hikkake behave with a 2:1 target R/R ratio?
From our research the Hikkake pattern confirms 53.9% of the time on average overall all the 4120 markets we analysed. Historically, this patterns confirmed within 4.6 candles or got invalidated within 5.2 candles. If confirmed, it reached the 2:1 R/R target 37.1% of the time and it retested it's entry price level 95.5% of the time.
Not accounting for fees, it has an expected outcome of 0.114 $/$.
It means for every $100 you risk on a trade with the Hikkake pattern you make $11.4 on average.
Want to account for your trading fees? Have the detailled stats for your favorite markets / timeframes? Or get the stats for another R/R than 2:1?
🚀 Join us now and get fine-tuned stats you care about!
How to handle risk with the Hikkake pattern?
We analysed 4120 markets for the last 59 years and we found 784 462 occurrences of the Hikkake pattern.
On average markets printed 1 Hikkake pattern every 20 candles.
For 2:1 R/R trades, the longest winning streak observed was 20 and the longest losing streak was 32. A trading strategy relying solely on this pattern is not advised. Anyway, make sure to use proper risk management.
Keep in mind all these informations are for educational purposes only and are NOT financial advice.
If you want to learn more and deep dive into candlestick patterns performance statistics, I strongly recommend you follow the best available course about it. Joe Marwood (who's a famous trader with more than 45 000 Twitter followers) created an online course called "Candlestick Analysis For Professional Traders" in his Marwood Research University. There he will take you through the extensive backtesting of the 26 main candlestick patterns. He then summarizes which one is THE best pattern. Do you know which one it is?
Remember, don't trade if you don't know your stats. Click here to signup to the course now!
What is the Hikkake Candlestick Pattern?
The hikkake candlestick pattern is a price pattern used by traders and technical analysts. The goal is to detect a short-term move in the direction of the market. The pattern has two different setups, one stating a short-term downward movement in price action, and a second setup showing a short-term upward trend in price.
The hikkake pattern is also used for determining market continuations and turning-points. It is a simple pattern that can be seen in market price data, using point and figure charts, traditional bar charts, or Japanese candlestick charts. The pattern does not belong to traditional candlestick chart patterns.
Though some have referred to the hikkake pattern as a “fakey pattern” or an “inside day false breakout”. These are just distractions from the real name given to the pattern by Daniel L. Chesler, CMT, and are not popularly used to explain the pattern. For instance, the name “hikkake pattern” has been chosen over “fakey pattern” or “inside day false breakout” by most professionals who have covered the subject.
Bullish Hikkake Pattern
The bullish hikkake pattern looks like a three inside down candle pattern but without the constraints. The bullish hikkake doesn’t require a rising price trend nor is candle color necessary. They both are in the three inside down candlestick. Theoretically, the hikkake is supposed to be a bullish candlestick, but it can either act as a reversal or continuation of an existing price trend.
Bearish Hikkake Pattern
The bearish hikkake candlestick pattern looks like a three inside up candle pattern but has no constraints. The bearish hikkake doesn’t need a falling price trend nor is candle color important because they both are in the three inside up candlestick. In theory, the bearish hikkake is meant to be a bearish candlestick. It can either act as a continuation or reversal of an existing price trend.
How to identify the Hikkake pattern?
The pattern is a complex bar or candle pattern that starts to move in one direction but quickly reverses and establishes a forecast for a move in the opposite direction. The pattern has four important points.
- The first two or bars of the pattern are of declining size. These are known as inside-day patterns or harami candlestick patterns. It doesn’t matter if this day closes lower or higher than it opened, so long as the body of the first candle completely overshadows the body of the second.
- The third candle ends below the low in the first setup or above the high in the second setup of the second candle.
- The next candles will drift below or above the third candle and may start reversing direction.
- The last candle will end above the high of the second candle.
After achieving the fourth characteristic, the pattern shows a continuation in the direction of the last candle.
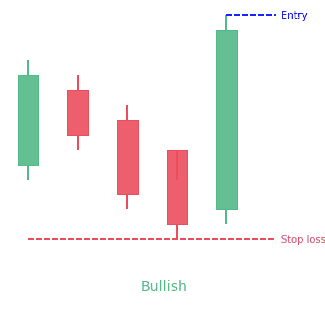
Identifying the bullish Hikkake
Configuration: Observe for an inside day (higher low and lower high compared to the previous day), then a lower high and lower low. Candle color is not necessary for identification.
Confirmation: Price has to rise above the high of the inside day, the second candle of the pattern, in three days or less, after the end of the candle. The red candle confirms the pattern on the third day when the high of that day increases above the blue line.
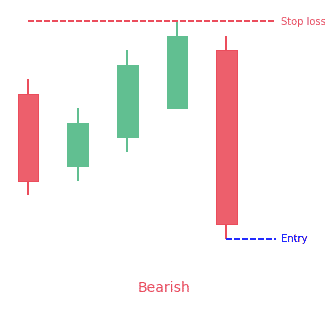
Identifying Bearish Hikkake
Configuration: Notice for an inside day (lower high and higher low compared to the previous day) followed by a high low and higher high. The color of the candle is not vital for identification.
Confirmation: Price has to drop below the low of the inside day the second candle of the pattern in three days or less, after the candle ends. The red candle confirms the pattern on the third day when the low of that day declines below the blue line. The blue line touches the bottom of the inside day.
What does the Hikkake pattern tell traders?
From a conceptual basis, the hikkake pattern is made up of short-term decline in market volatility. It then shows a breakout move in price action. This move will tend to entice traders into thinking a breakout has appeared. Traders enter the market and set a stop in the opposite direction of their trade.
If the price pattern reverses, then the stop-loss order of the traders kicks in. It may give a boost to the price as it reverses past the boundary of the second bar in the formation. It’s where the stop orders will likely be found.
An inside bar is a price bar that is totally within the range of the previous price bar. Inside bars are typical on price charts of a lot of timeframes.
While you’ll mostly see inside bars in congested markets, they also give a low-risk entry point for price action traders. The contracted range of an inside bar gives a natural tight stop-loss position.
Therefore, inside bar breakouts appear attractive. However, if you are patient enough and focus on detecting false breakouts, you might find more reliable trading setups in the form of hikkakes. In a nutshell, the hikkake candlestick pattern gives a systematic approach to trading false inside bar breakouts.
The name of this pattern originates from a Japanese word meaning “catch, hook, or ensnare”. When the pattern was first described, the founder was looking to describe a pattern he had noticed that seemed to trap traders investing in the market only to see it move away from what they expected.
How to trade when you see the Hikkake pattern?
Rules for long setups
Following clear rules is important to traders success. Initiate a buy order if the following chart patterns or indicators are displayed:
- An inside bar
- The next bar has a lower high and a lower low (the breakout bar showing a bearish breakout of the inside bar)
- Place a stop-buy order at the high of the inside candlestick
- Cancel the order if it does not triggered after three bars
Rules for short setups
Place a buy order if the following chart patterns or indicators are displayed:
- An inside bar is formed
- The next bar has a higher high and a higher low (the breakout bar showing a bullish breakout of the inside bar)
- Put a sell-stop at the low of the inside candlestick
- Cancel the order if it does not trigger after three bars
A modified Hikkake pattern
This pattern is a less frequent variant of the basic hikkake pattern and is seen as a reversal pattern. The concept of the modified version of the hikkake is similar to the basic version. The difference is that a context bar is applied prior to the inside price candle/bar. Thus, the modified version is made up of a context bar, a fake move, an inside bar, followed by a move above (bullish) or below (bearish) the low or high of the inside.
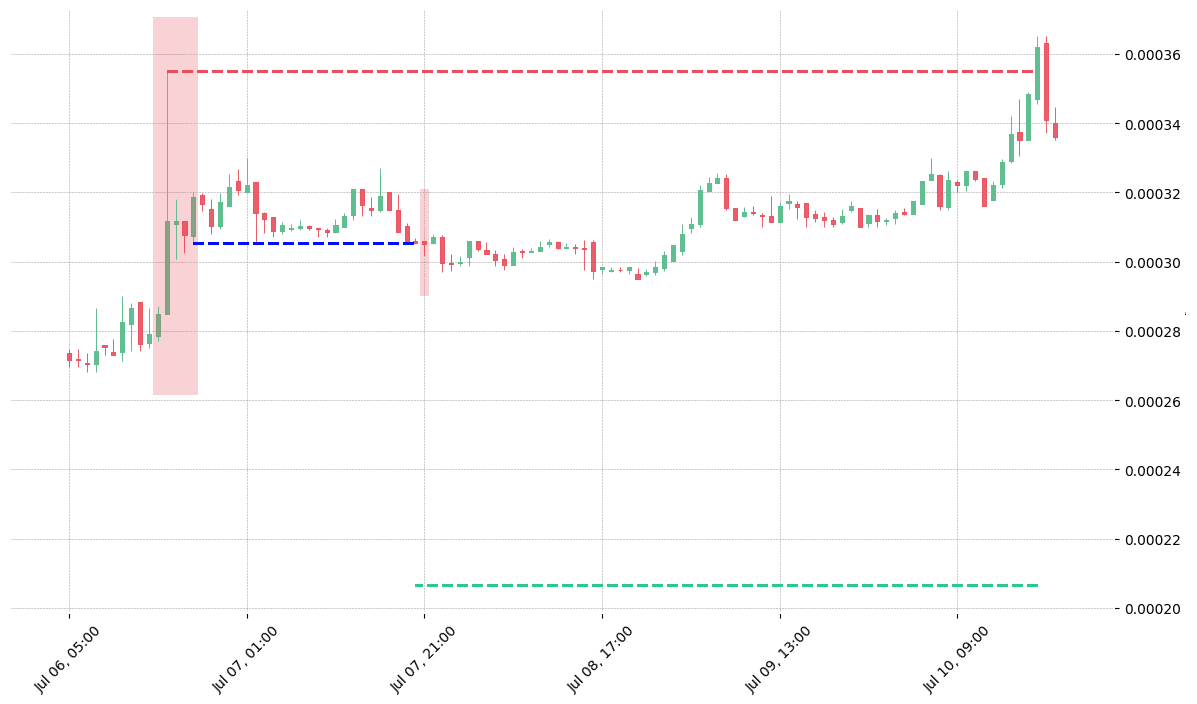
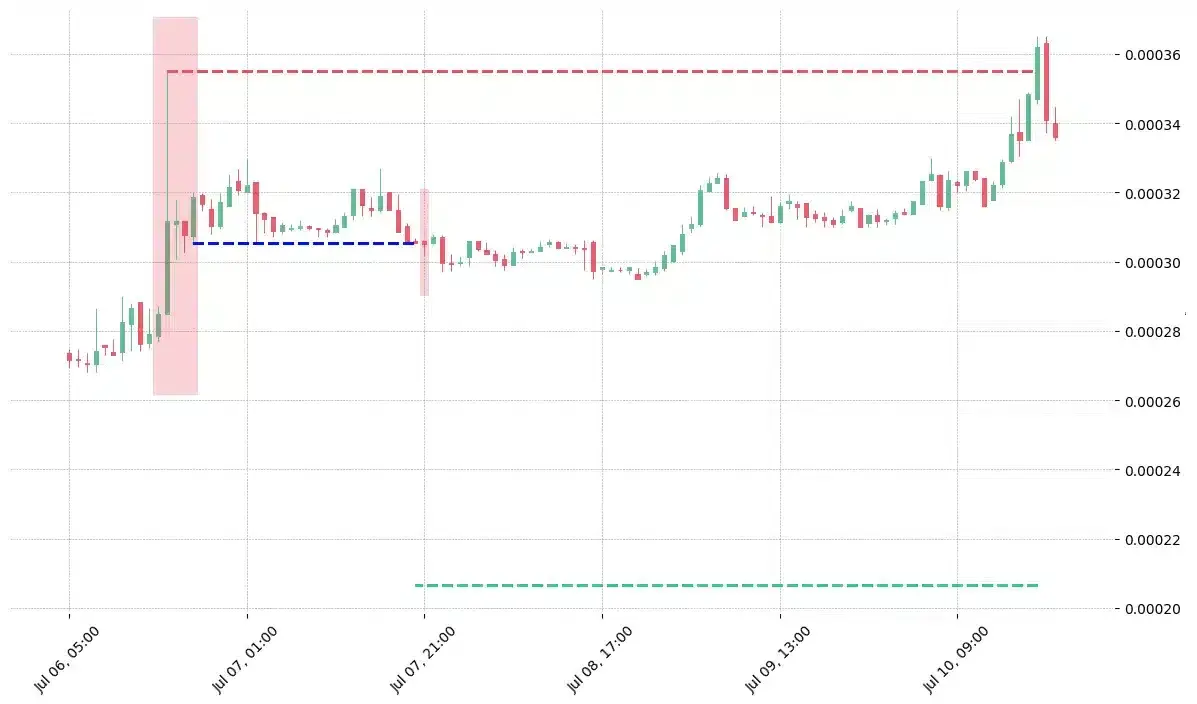
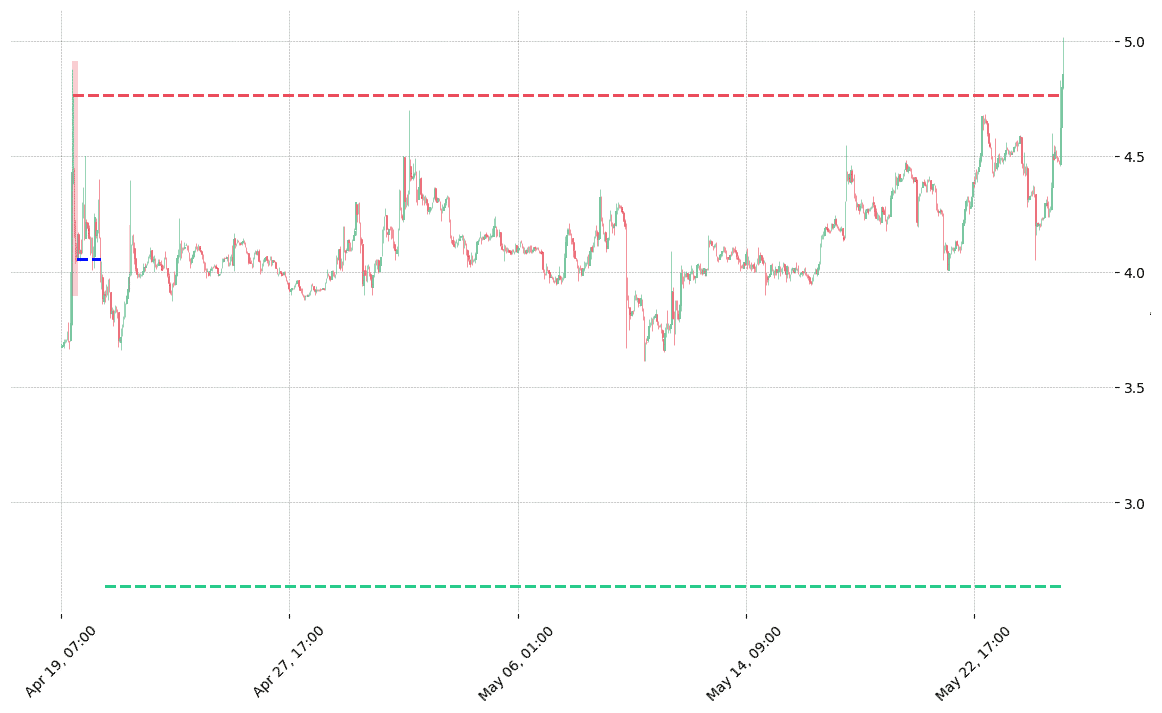
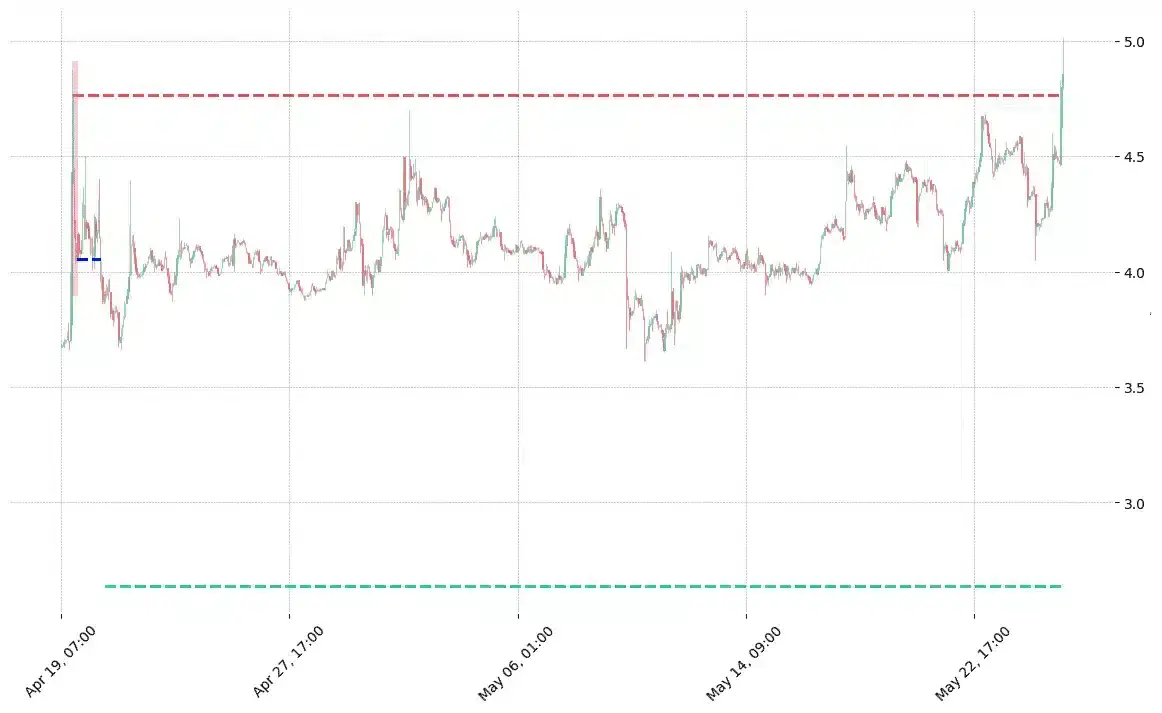
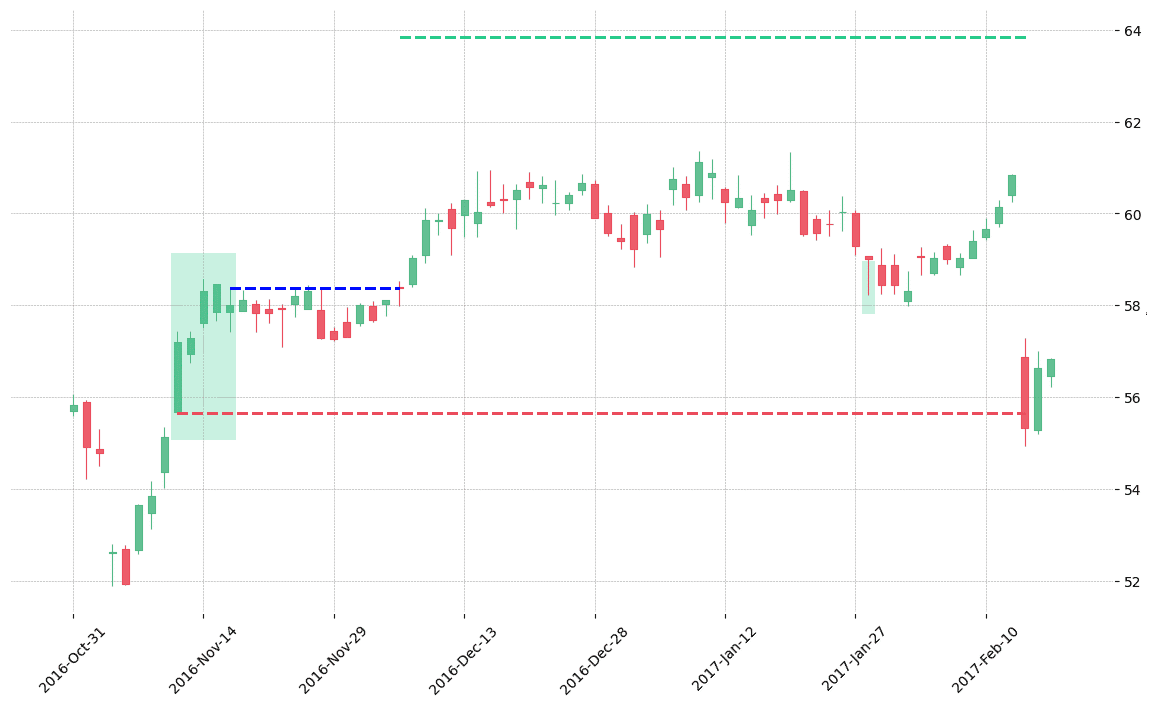
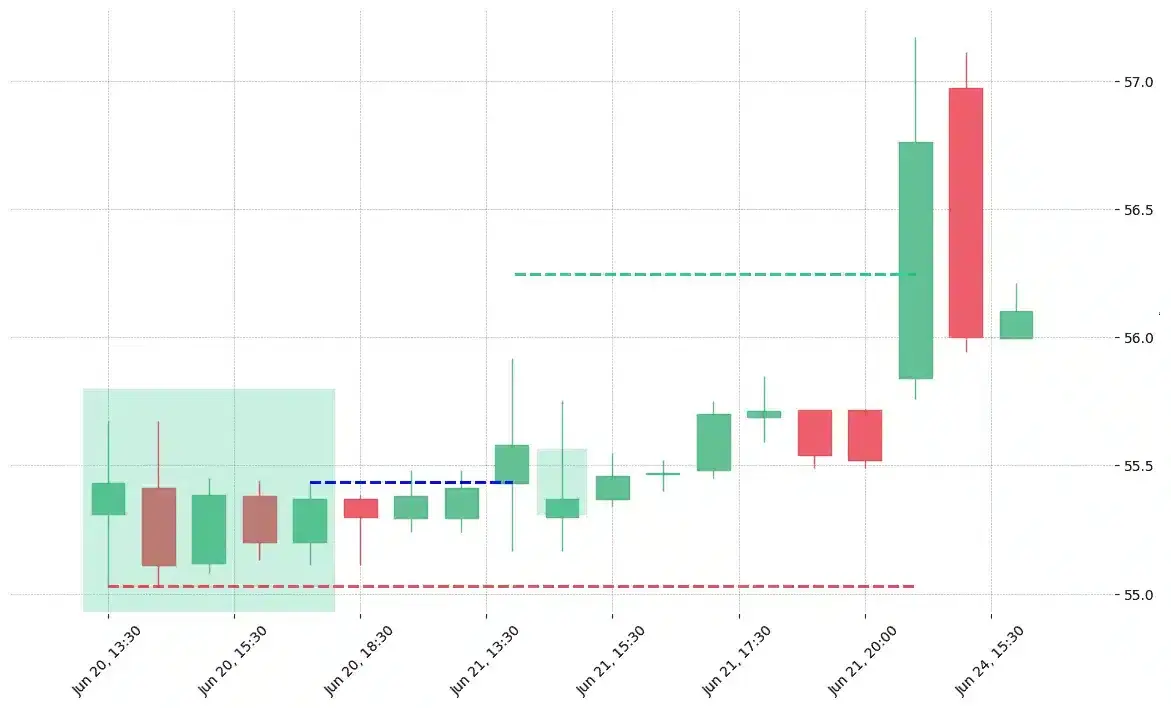
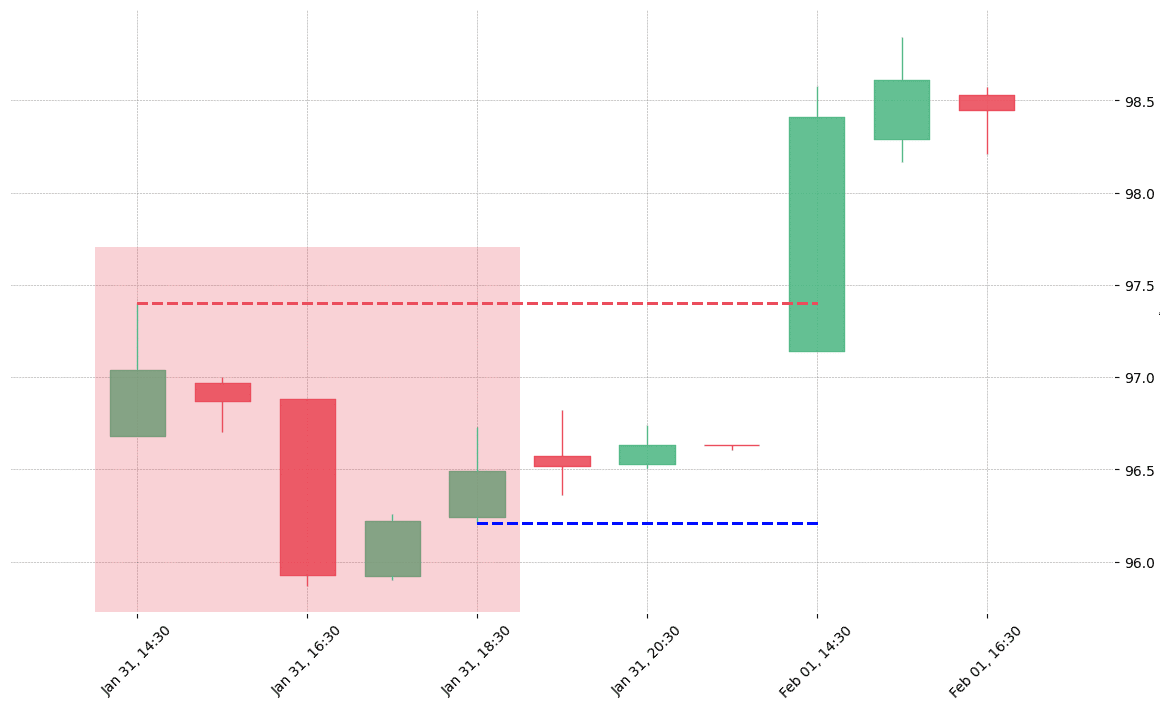
How does the Hikkake pattern look in real life?


Looking to learn more about this pattern?
You should take a look at Joe Marwood's online course. In his course, he backtested the 26 main candlestick patterns before to summarize which one is THE best pattern. I really liked his course and you shouldn't miss it!
Click here to signup to his "Candlestick Analysis For Professional Traders" course now!


 We loved Marwood Research’s course “Candlestick Analysis For Professional Traders“. Do you want to follow a great video course and deep dive into 26 candlestick patterns (and compare their success rates)? Then make sure to check this course!