 Good Trading requires the Best Charting Tool!
The Hammer candlestick pattern is a bullish reversal pattern that indicates a potential price reversal to the upside. It appears during the downtrend and signals that the bottom is near. After the appearance of the hammer, the prices start moving up.
Hammer candlestick has a unique shape. It has a lower shadow of at least twice the size of the body. It has a very little body and a very tiny or non-existent upper shadow. The long lower shadow of it illustrates that sellers were able to push the prices lower but buyers will be able to overpower the selling pressure. Hence, the closing prices remain near to opening prices. The formation of Hammer in the downtrend does not mean to automatically place a buying order. It is imperative to have more bullish confirmations before taking any decisions.
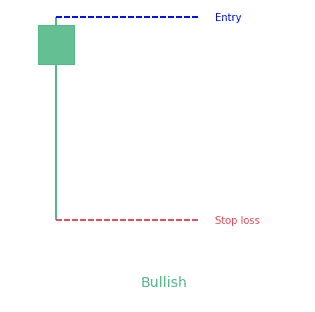
- The Hammer pattern is a 1-bar bullish reversal candlestick pattern.
- It looks like the letter “T” and has a small body and a long lower shadow.
Statistics to prove if the Hammer pattern really works
Are the odds of the Hammer pattern in your favor?
How does the Hammer behave with a 2:1 target R/R ratio?
From our research the Hammer pattern confirms 61.9% of the time on average overall all the 4120 markets we analysed. Historically, this patterns confirmed within 2 candles or got invalidated within 3 candles. If confirmed, it reached the 2:1 R/R target 40.8% of the time and it retested it's entry price level 92.9% of the time.
Not accounting for fees, it has an expected outcome of 0.225 $/$.
It means for every $100 you risk on a trade with the Hammer pattern you make $22.5 on average.
Want to account for your trading fees? Have the detailled stats for your favorite markets / timeframes? Or get the stats for another R/R than 2:1?
🚀 Join us now and get fine-tuned stats you care about!
How to handle risk with the Hammer pattern?
We analysed 4120 markets for the last 59 years and we found 173 198 occurrences of the Hammer pattern.
On average markets printed 1 Hammer pattern every 90 candles.
For 2:1 R/R trades, the longest winning streak observed was 18 and the longest losing streak was 57. A trading strategy relying solely on this pattern is not advised. Anyway, make sure to use proper risk management.
Keep in mind all these informations are for educational purposes only and are NOT financial advice.
If you want to learn more and deep dive into candlestick patterns performance statistics, I strongly recommend you follow the best available course about it. Joe Marwood (who's a famous trader with more than 45 000 Twitter followers) created an online course called "Candlestick Analysis For Professional Traders" in his Marwood Research University. There he will take you through the extensive backtesting of the 26 main candlestick patterns. He then summarizes which one is THE best pattern. Do you know which one it is?
Remember, don't trade if you don't know your stats. Click here to signup to the course now!
What does the Hammer candlestick pattern mean?
Hammer is a bullish candlestick pattern that means the rejection of the lower prices. When the market opens, the prices begin to fall because the sellers take control. When the selling pressure is at the peak, a buying pressure intervenes and pushes the prices high. This buying pressure indicated by the Hammer strongly drives the closing prices above the opening prices.
How to identify it?
The identification of a Hammer candlestick pattern is easy because of its unique shape. There are specific conditions that must be there for a candle to be a Hammer candlestick.
- The long lower wick that is at least twice the size of the body
- A tiny body that lies at the upper end of the trading range
- The very small or non-existent upper wick
What does the Hammer pattern tell traders?
Hammer candlestick pattern tells traders that a reversal in prices is about to happen after the determination of the bottom by the market. It indicates that the selling pressure will be overcome by the bulls and the prices will begin to rise again. However, it is important to notice that Hammer candlestick does not indicate the reversal of downtrend to upwards until the confirmation.
How to trade when you see the pattern?
Hammer pattern isn’t used in isolation, ever after the confirmation by the hammer. Traders use it for analysis of the trend of the market. It is always the best strategy to trade within the context of the market instead of trading any single candlestick pattern. It is advised by the experts to trade in the direction of the trend. Secondly, trading from an area of value is advantageous. Lastly, it is important for your success to identify an entry trigger to initiate your trading.
Difference between the Hammer candlestick pattern and the Hanging Man candlestick pattern
The Hammer is very similar to the Hanging Man candlestick pattern. Both have similar shapes with a small body, tiny or absent upper wick, and a long lower wick. The only difference between them is the nature of trends in which they appear. If a pattern appears in an upward trend and indicates a bearish reversal, it is Hanging Man. Conversely, if a pattern appears in a downtrend indicating a bullish reversal, it is a Hammer candlestick pattern.
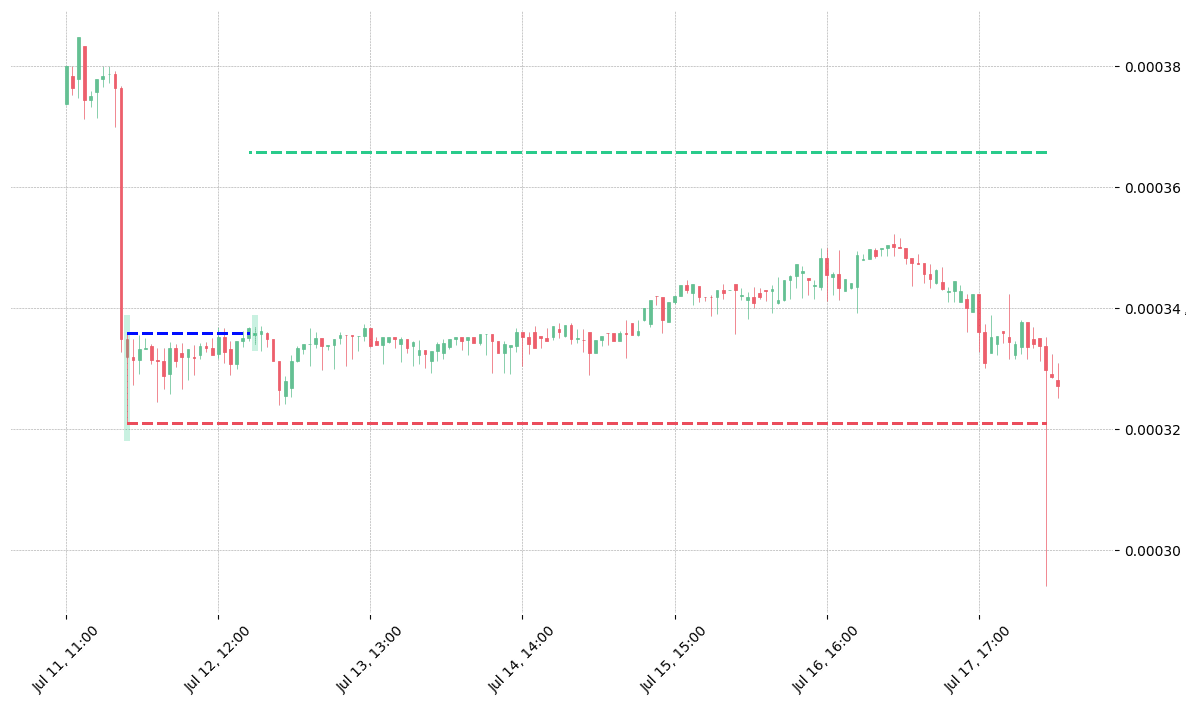
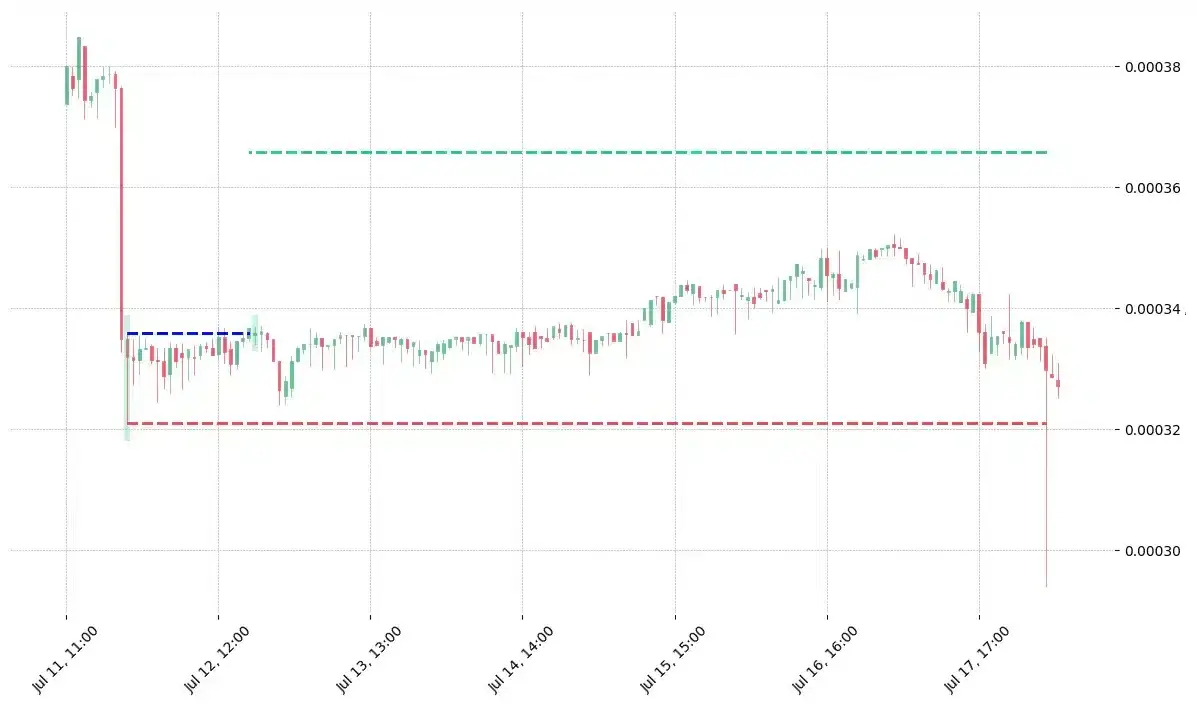
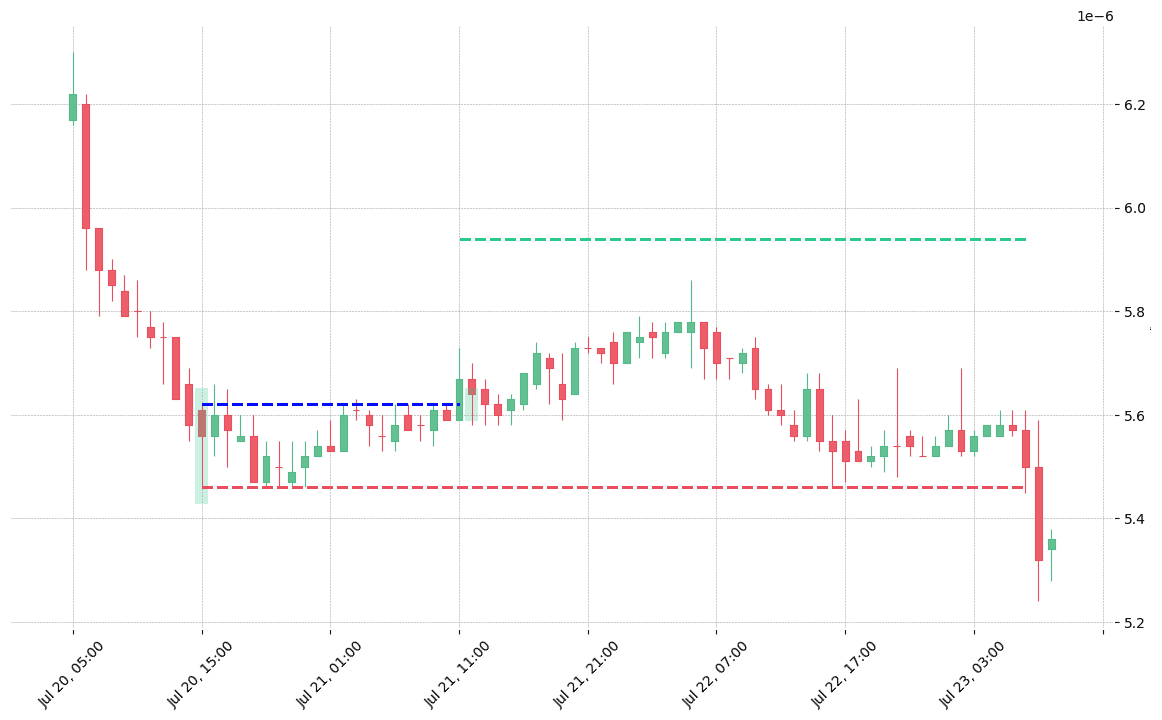
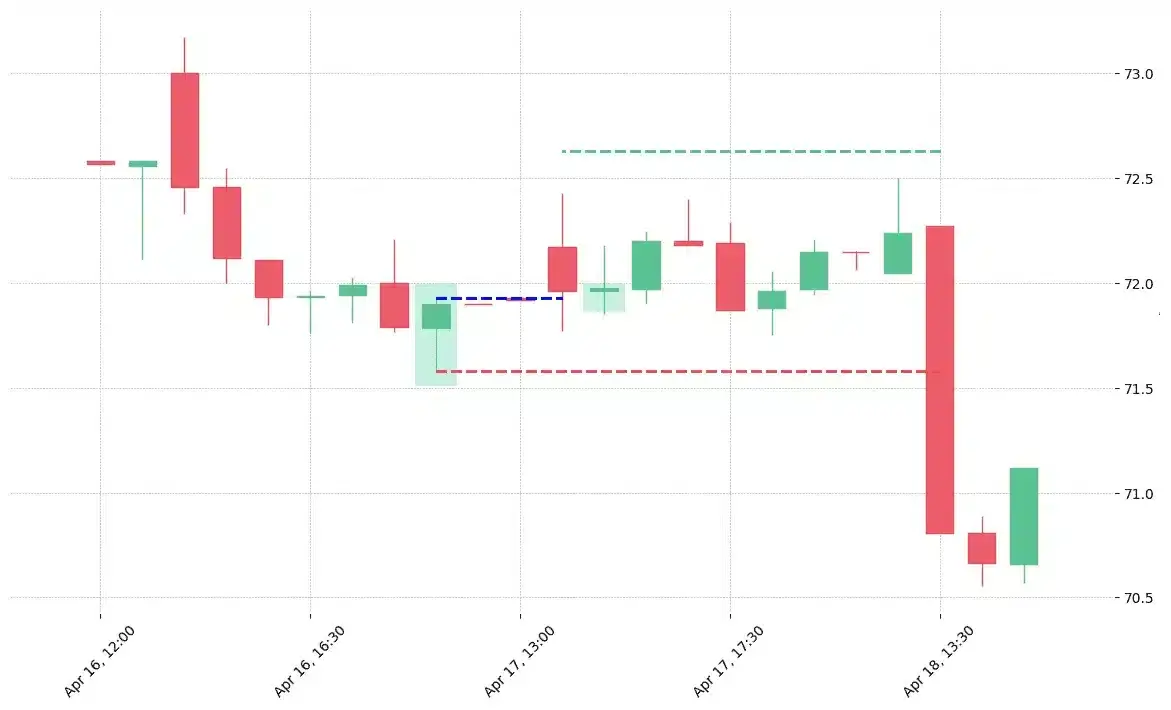
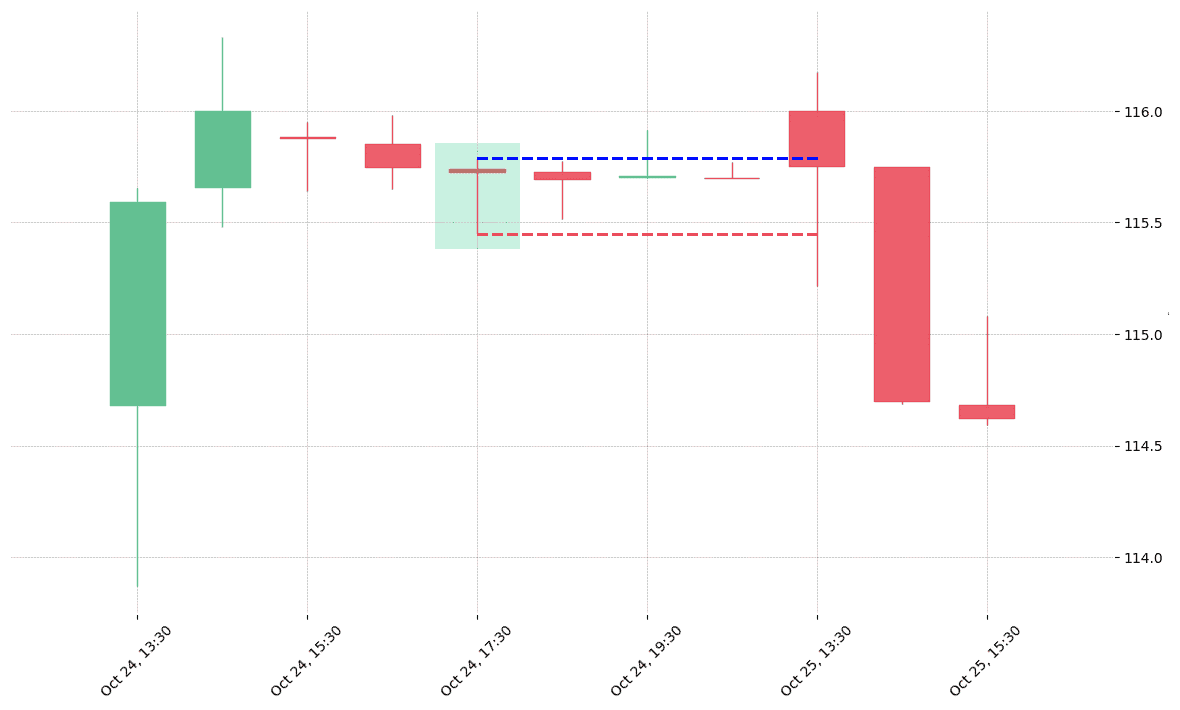
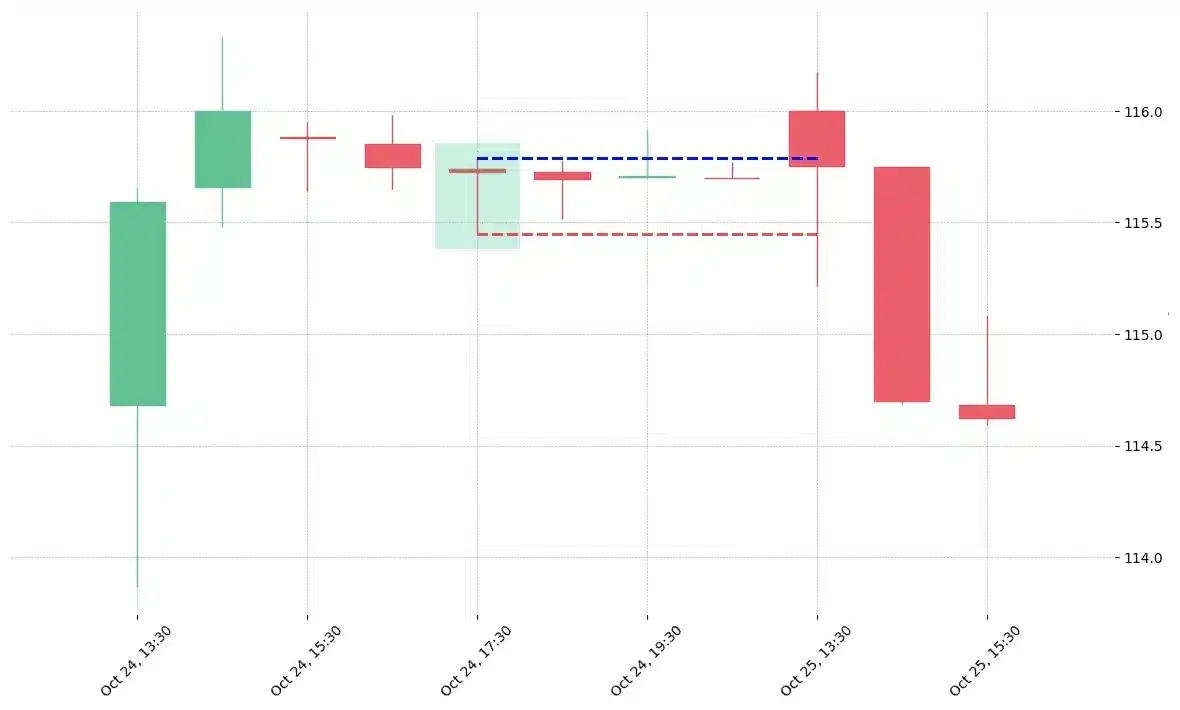
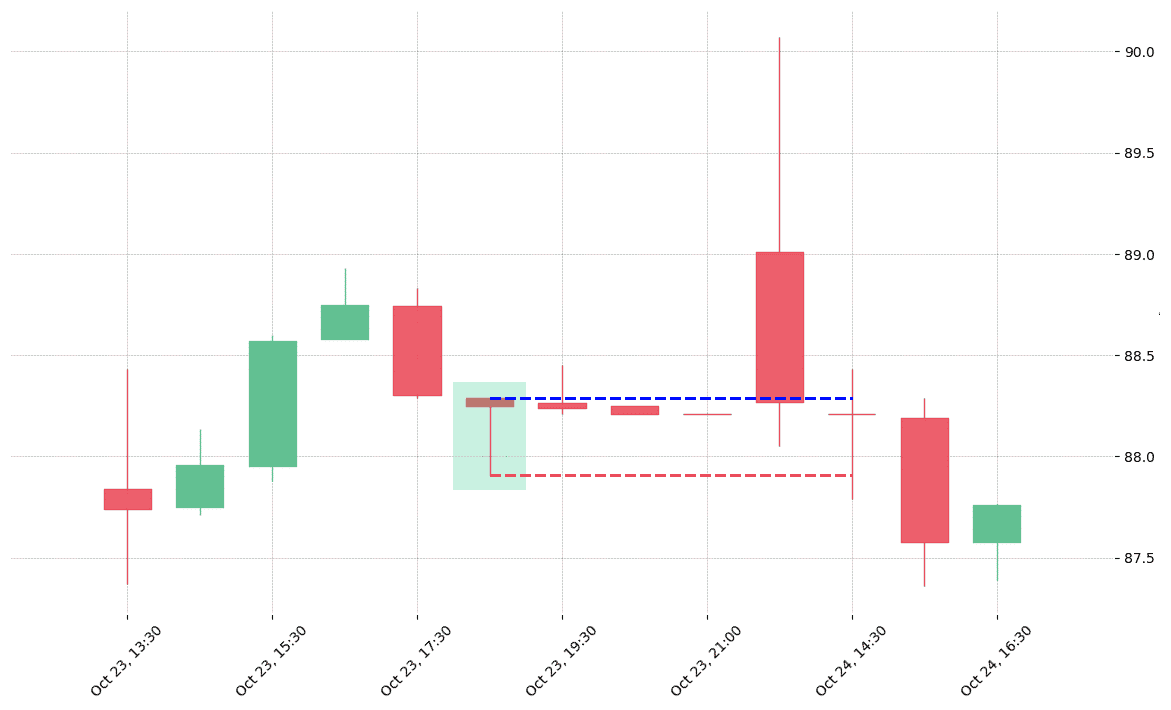
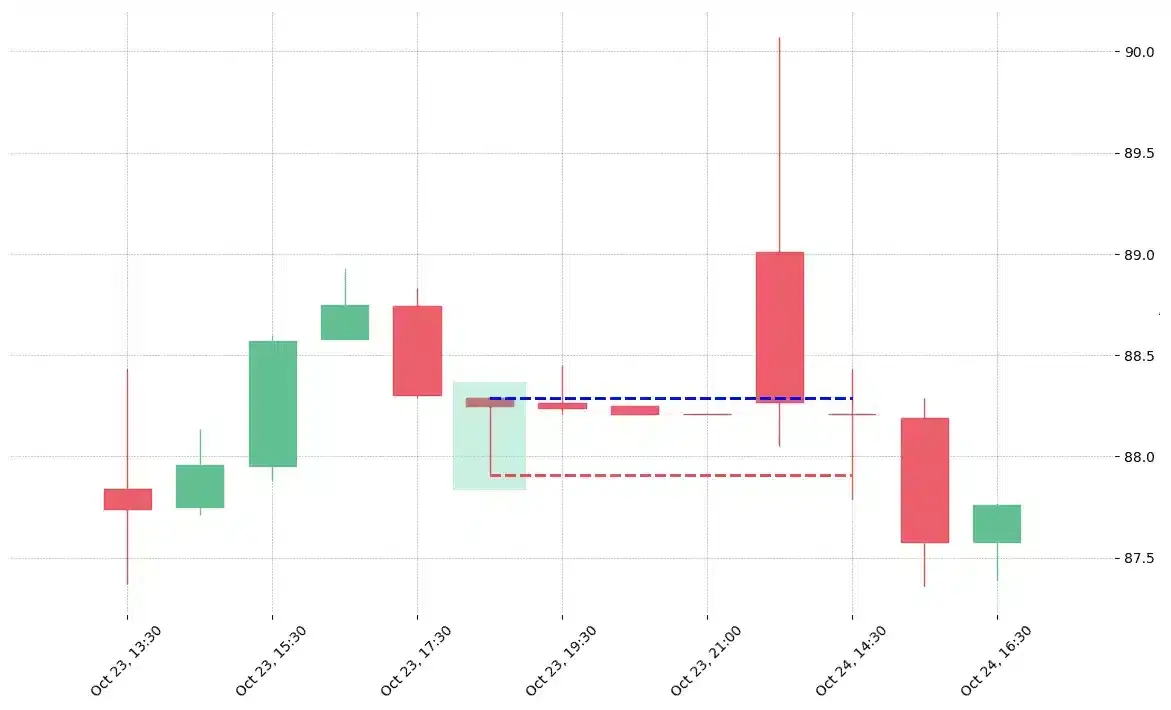
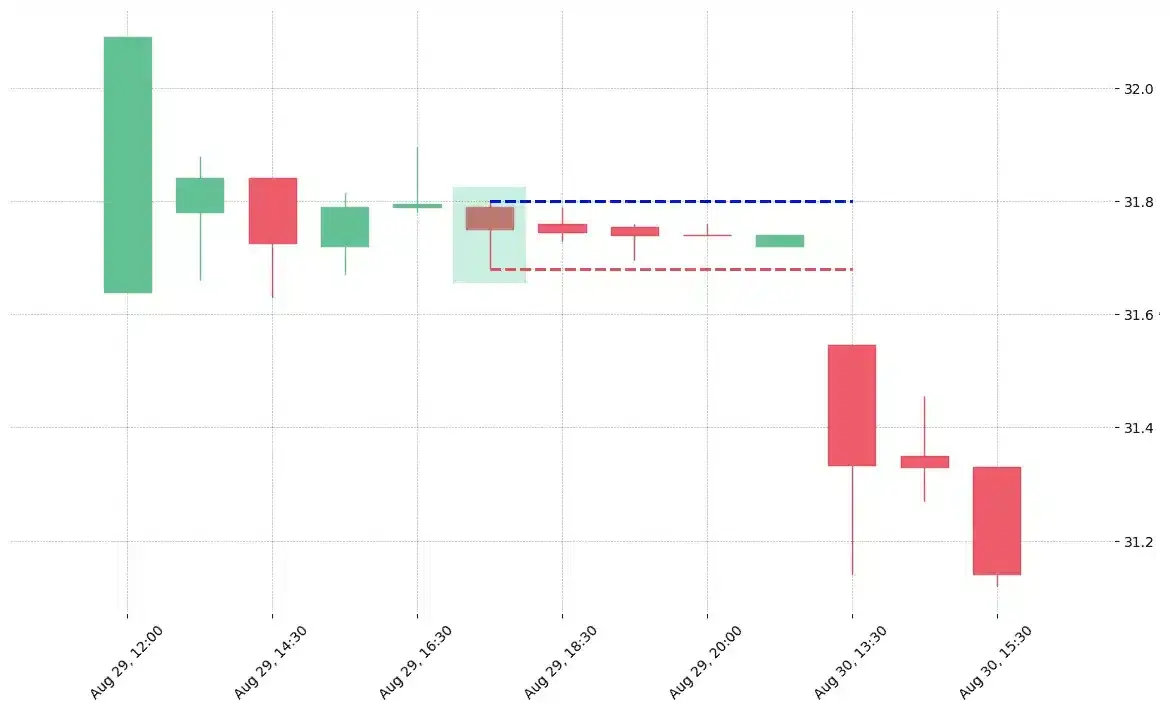
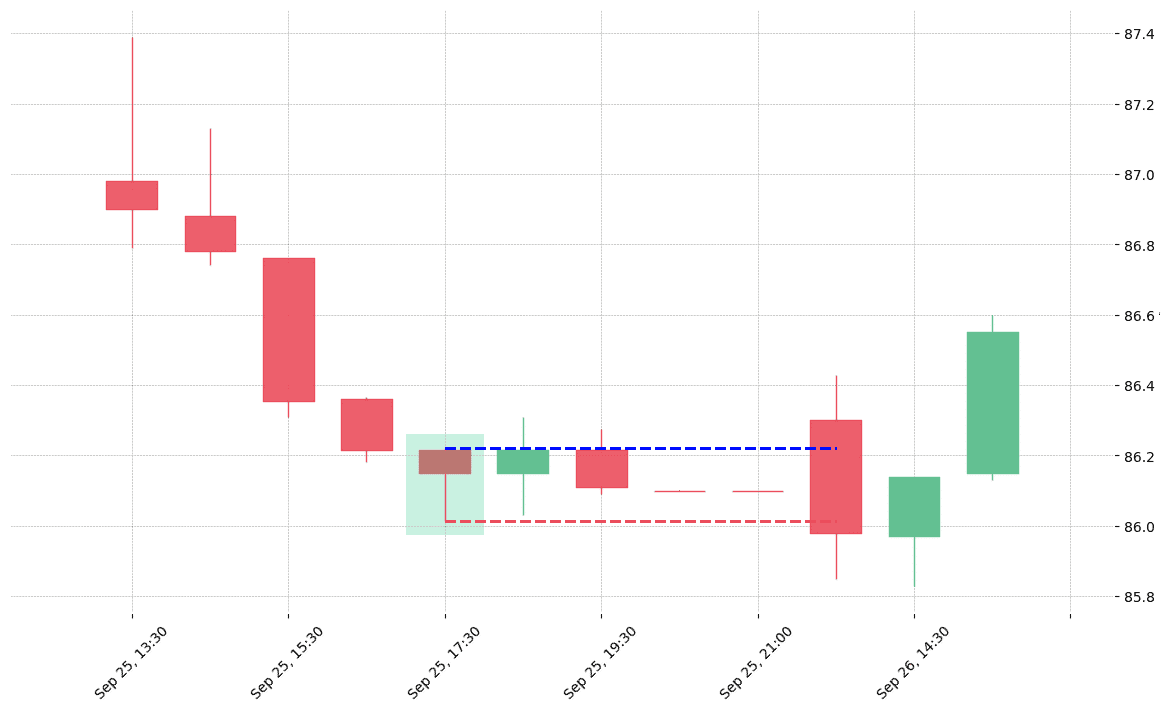
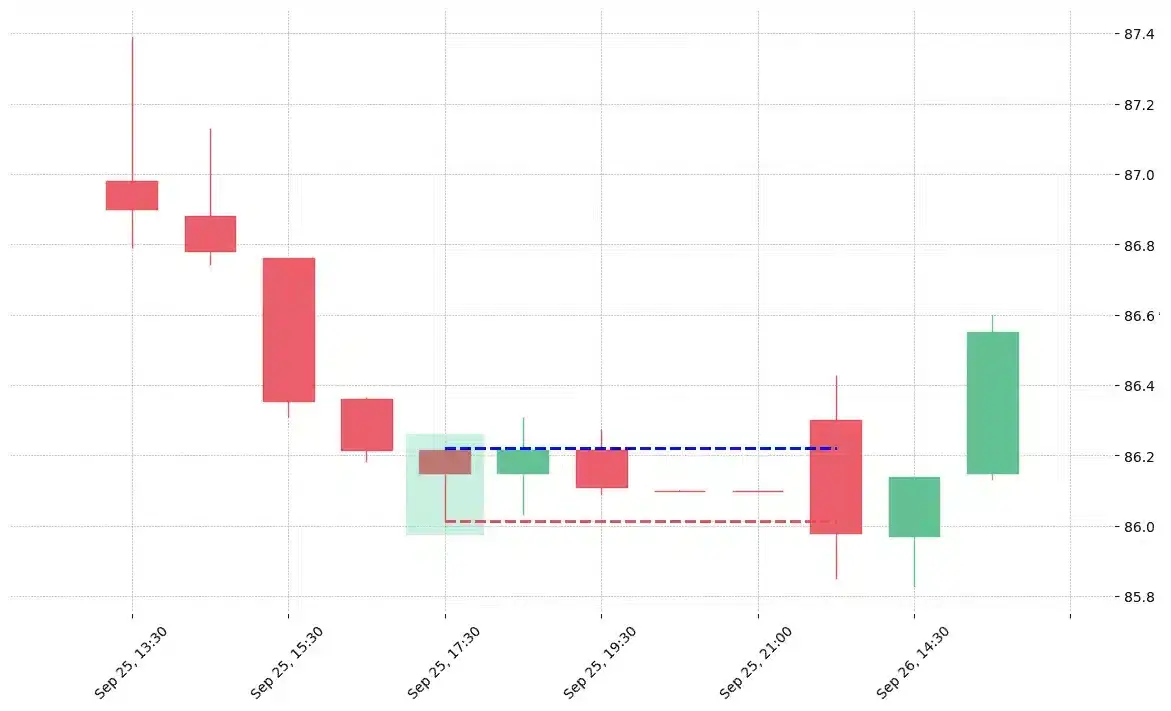
How does the Hammer pattern look in real life?


Looking to learn more about this pattern?
You should take a look at Joe Marwood's online course. In his course, he backtested the 26 main candlestick patterns before to summarize which one is THE best pattern. I really liked his course and you shouldn't miss it!
Click here to signup to his "Candlestick Analysis For Professional Traders" course now!


 We loved Marwood Research’s course “Candlestick Analysis For Professional Traders“. Do you want to follow a great video course and deep dive into 26 candlestick patterns (and compare their success rates)? Then make sure to check this course!