
 Good Trading requires the Best Charting Tool!
Out of all the chart patterns that exist in a bullish market, the falling wedge is an important pattern for new traders. It is a very extreme bullish pattern for all instruments in any market in any trend. Depending on the educator and educational material you’ve read on chart patterns, wedge patterns may or may not be considered a triangle pattern.
Wedges are a variation of a triangle in that their shapes. It ultimately make an apex (which is quite far away), but wedges trade very differently than standard triangle patterns.
They can offer an invaluable early warning sign of a price reversal or continuation. Knowing how and why the falling wedge pattern forms are essential to learning how to trade it.
- A falling wedge forms when two converging downward slope trendlines encapsulate the price
- It is a bullish pattern
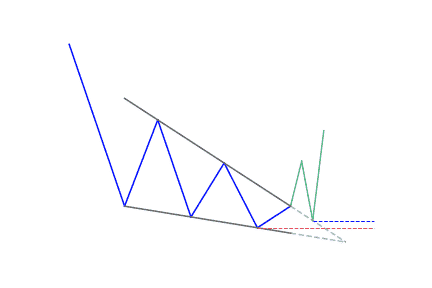
What is the Falling Wedge pattern?
Falling wedge has distinctives characteristics
The falling wedge chart pattern is a recognizable price move. It is created when a market consolidates between two converging support and resistance lines. To create a falling wedge, the support and resistance lines have to both point in a downwards direction. The resistance line has to be steeper than the support line.
It is a bullish pattern that starts wide at the top and contracts as prices move lower. This price action forms a cone that slopes down as the reaction highs and reaction lows converge. In contrast to symmetrical triangles, which have no definitive slope and no bias, falling wedges slope down and have a bullish bias. However, this bullish bias cannot be realized until a resistance breakout occurs.
Depending on where it is found on a price chart, the falling (or descending) wedge can also be used as either a continuation or a reversal pattern.
It’s a challenging pattern
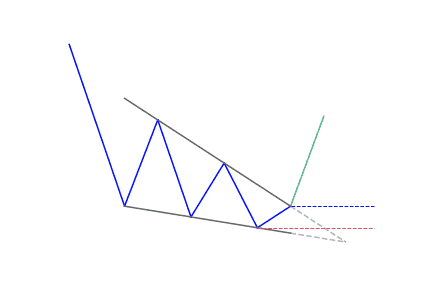
As with the rising wedges, trading falling wedge is one of the more challenging patterns to trade. A falling wedge pattern indicates a continuation or a reversal depending on the current trend. But in most cases, the pattern shows a reversal. In terms of its appearance, the pattern is widest at the top and becomes narrower as it moves downward. It leads to tighter price action.
A falling wedge is the exact opposite of a rising wedge. So it also often leads to breakouts. Though, while ascending wedges lead to bearish moves, downward ones lead to bullish moves.
- When a market is on an uptrend, they show a short-term pause before the long-term move takes hold once more
- When a market is falling, that means that traders are reconsidering the bear move
As with their counterpart, the falling wedge may seem counterintuitive. They push traders to consider a falling market as a sign of a coming bullish move. But in this case, it’s important to note that the downward moves are getting shorter and shorter. This is an indication that bullish opinion is either forming or reforming.
How to identify the Falling Wedge pattern?
The falling wedge pattern is seen as both a bullish continuation and bullish reversal pattern which gives rise to some confusion in the identification of the pattern. Both scenarios contain different market conditions that must be taken into consideration.
The differentiating factor that separates the continuation and reversal pattern is the direction of the trend when the falling wedge appears. A falling wedge is a continuation pattern if it appears in an uptrend and is a reversal pattern when it appears in a downtrend.
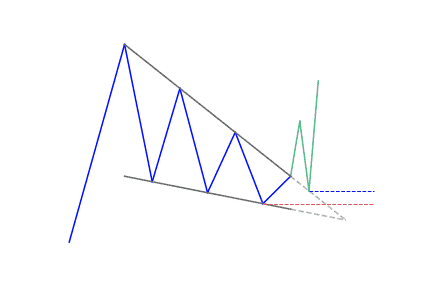
Identifying it in a downtrend
If the falling wedge shows up in a downtrend, it is seen as a reversal pattern. It exists when the price is making lower highs and lower lows which form two contracting lines. The falling wedge usually precedes a reversal to the upside. This means that traders can look for potential buying opportunities.
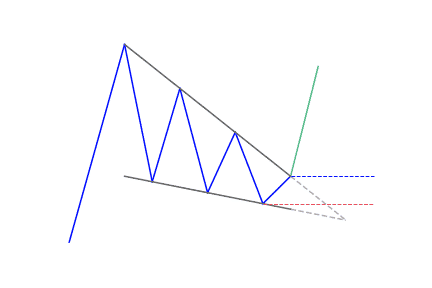
Identifying it in an uptrend
A falling wedge found in an uptrend is seen as a continuation pattern that comes up as the market temporarily contracts. It shows the resumption of the uptrend. Again, this indicates that traders can look for potential buying opportunities.
Overall guidelines to identify the pattern
The steps to identify this pattern are:
- Identify an uptrend or downtrend
- Use a trend line to link lower highs and lower lows. The two lines will slope downwards and converge
- Observe for divergence between price and an oscillator
- Make use of other technical tools to confirm the oversold signal
- Look for a break above resistance for a long entry
What does the Falling Wedge pattern tell traders?
When a stock or index price move has fallen over time, it can create a wedge pattern as the chart begins to converge on the way down. Traders can look to the beginning of the descending wedge pattern and measure the peak to trough distance between support and resistance to spot the pattern.
As the price continues to slide and lose momentum, buyers begin to step in and slow the rate of decline. Once the trend lines converge, this is where the price breaks through the trend line and spikes to the upside.
The falling wedge indicates a bullish reversal pattern in price. It has three common characteristics that traders should look for: it has converging trend lines, declining volume as the trend line progress, and finally, it will be preceded by a breakout through the upper trend line. What all these things come together, you have a falling wedge pattern, and a breakout to the upside should be anticipated.
The wedge pattern converges to the smaller price channel. This means that the distance between where a trader would enter the trade and the price where they would open a stop-loss order is relatively tight. Here it can be very easy to get kicked out of the trade for minimum loss, but if the stock moves to the benefit of the trader, it can lead to an excellent return.
How to trade when you see the Falling Wedge pattern?
Before you take any trade, you’ll need two things.
First, you’ll need a good broker. Check out our review of best brokers here!
Then, you’ll need a performant charting solution. TradingView is currently the best on the market. Click here to get start for free now!
To design a wedge trading strategy, you need to determine when to open your position, when to take profit and when to cut your losses.
Opening a position
Confirm the move before opening your position because not all wedges will end in a breakout.
One method you can use to confirm the move is to wait for the breakout to begin. Essentially, here you are hoping for a significant move beyond the support trend line for a rising wedge, or resistance for a falling one.
For ascending wedges, for instance, traders will mostly be mindful of a move above a former support point. On the other hand, you can apply the general rule that support turns into resistance in a breakout, meaning the market may bounce off previous support levels on its way down. Due to this, you can wait for a breakout to start, then wait for it to return and bounce off the previous support area in the ascending wedge. This will confirm the move before you open your position.
Another common indication of a wedge that is close to breakout is falling volume as the market consolidates. A spike in volume after it breaks out is a good sign that a bigger move is nearby.
Taking profit
You can apply the general rule here – first is that the former levels of support will become new resistance levels, and vice versa. Secondly, the range of the former channel can show the size of a subsequent move.
Cutting losses
One benefit of trading any breakout is that it has to be clear when a potential move is made invalid – and trading wedges is no different. You can place a stop-loss above the previous support level, and if that support fails to turn into a new level of resistance, you can close your trade.


 We loved Marwood Research’s course “Candlestick Analysis For Professional Traders“. Do you want to follow a great video course and deep dive into 26 candlestick patterns (and compare their success rates)? Then make sure to check this course!