
 Good Trading requires the Best Charting Tool!
Candlestick patterns have become the preferred method of charting for a lot of traders. Their colorful bodies make it simple to spot market action and patterns that could hold predictive value; they also form patterns that have various meanings. One pattern is the falling three methods or its opposite the rising three methods candlestick pattern.
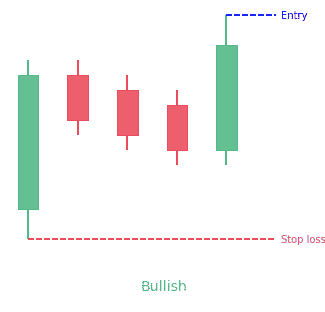
- The Rising Three Methods is a 5-candles bullish continuation candlestick pattern.
- It has a big green candle, 3 small red ones, and a big green one closing above the others.
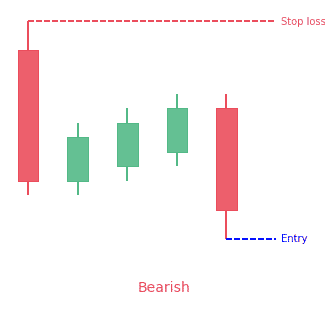
- The Falling Three Methods is the opposite of the Rising Three Methods and is a bearish continuation candlestick pattern.
Statistics to prove if the Falling & Rising Three Methods patterns really work
Are the odds of the Rising Three Methods and Falling Three Methods pattern in your favor?
How does the Rising Three Methods and Falling Three Methods behave with a 2:1 target R/R ratio?
From our research the Rising Three Methods and Falling Three Methods pattern confirms 74.5% of the time on average overall all the 4120 markets we analysed. Historically, this patterns confirmed within 4.9 candles or got invalidated within 14.7 candles. If confirmed, it reached the 2:1 R/R target 36.3% of the time and it retested it's entry price level 98.8% of the time.
Not accounting for fees, it has an expected outcome of 0.088 $/$.
It means for every $100 you risk on a trade with the Rising Three Methods and Falling Three Methods pattern you make $8.8 on average.
Want to account for your trading fees? Have the detailled stats for your favorite markets / timeframes? Or get the stats for another R/R than 2:1?
🚀 Join us now and get fine-tuned stats you care about!
How to handle risk with the Rising Three Methods and Falling Three Methods pattern?
We analysed 4120 markets for the last 59 years and we found 1 523 occurrences of the Rising Three Methods and Falling Three Methods pattern.
On average markets printed 1 Rising Three Methods and Falling Three Methods pattern every 10 244 candles.
For 2:1 R/R trades, the longest winning streak observed was 6 and the longest losing streak was 15. A trading strategy relying solely on this pattern is not advised. Anyway, make sure to use proper risk management.
Keep in mind all these informations are for educational purposes only and are NOT financial advice.
If you want to learn more and deep dive into candlestick patterns performance statistics, I strongly recommend you follow the best available course about it. Joe Marwood (who's a famous trader with more than 45 000 Twitter followers) created an online course called "Candlestick Analysis For Professional Traders" in his Marwood Research University. There he will take you through the extensive backtesting of the 26 main candlestick patterns. He then summarizes which one is THE best pattern. Do you know which one it is?
Remember, don't trade if you don't know your stats. Click here to signup to the course now!
What is are the Falling Three Methods & Rising Three Methods pattern?
Falling three methods is a bearish continuation pattern. It comes up in an existing downtrend, and indicates that the current bearish trend is persisting. The falling three methods candlestick pattern is made up of five candles. The first candle, which is a tall bearish one, is followed by three smaller positive candles that are found within the range of the first candle. The last candle is a tall bearish one that goes through the low of the pattern.
The three methods pattern is a trend continuation pattern that can come up in a downtrend or an uptrend. In an uptrend, it is referred to as the rising three methods pattern and in a downtrend it is known as the falling three methods pattern. The three methods pattern is made up of at least five candlesticks but may have more. It is similar to the pennant or flag formations and also shows a period of congestion or consolidation.
How to identify the Falling Three Methods & Rising Three Methods?
The Falling Three Methods
The falling three methods is the opposite of the rising three methods and can be seen in a downtrend. The first bar in this pattern is dark bearish with a big real body. The next few candles are expected to be smaller rising candles that are bullish and light in color. These bars should not go beyond the high or the low of the first bar. The last candlestick that completes the pattern should be lower than the close of its preceding candlestick and should close below that the close of the first candlestick.
That chart pattern experiences price drop, recovers during the corrective phase, and then the drop resumes. The candlestick behaves in theory as it does in real life. It is a bearish continuation 71 percent of the time and a reversal the rest of the time. Unfortunately, with just 64 samples appearing out of 4.7 million candle lines studied, quality performance statistics are as rare as the candle itself.
The Rising Three Methods
Rising three methods is a bullish continuation pattern that is formed in an uptrend and whose conclusion sees a resumption of that trend. This is opposite to a falling three method.
The rising three methods pattern forms when the price of a security meets these characteristics:
- The first bar of the pattern is a bullish candlestick with a large real body within an obvious uptrend.
- The next candlesticks, usually three consecutive bearish small-bodied candles that trade above the low and below the high of the first candle.
- The final bar is another bullish candle having a big real body that surpasses the high and closes above the high and close of the first candlestick, which suggests the bulls are back in control of the direction of the security.
The bulls are in total control before stopping for a bit to see if there’s enough conviction in the trend. The series of small candles found between the first and fifth candle in the rising three methods pattern is seen as a period of consolidation before the uptrend resumes. The decisive bullish candle is proof that sellers did not have enough conviction to turn the prior uptrend and that buyers have regained control of the market. Active traders may apply the pattern as an indication to include to their long positions.
Similar chart patterns that don’t meet the characteristics of the pattern can still assist traders in identifying ideal entry points in a market. For instance, there may be four or five small candles, instead of three, in the pattern.
What does the Falling Three Methods & Rising Three Methods tell traders?
Falling Three Methods
As seen from a downtrend and the long black candle at the start of the signal, the bears are dominating the bulls. But after that, the price pauses for a moment and forms the three, short candles in the center, within the range of the first candle. The bulls aren’t able to push the price above the height of that first long candle, and they are passed by the bears. In the end, the price goes downward again, making another long black candle that closes lower than the first candle.
Each candlestick pattern tells traders something about the market, how it behaved, and maybe why it behaved as it did. And while it might be difficult or impossible to determine the exact reasons why the market moved as it did, analyzing candlestick patterns in an attempt to understand their meanings is a great exercise that will help you understand the market.
Rising Three Methods
When this occurs, it means that the bulls are dominating the bears. This is obvious from the presence of the first long candle which is green in color. But they stutter a bit after that. The price stops and three or more small candles form within the range of the first candle. The bears are pushing for a comeback, but are unable to force the price lower than the first candle. In the end, the bulls overcome them once more, who push the price upward and form another long green candle. We can conclude from this that the bulls are still in control, and the uptrend will go on.
How to trade when you see the Falling Three Methods & Rising Three Methods?
Trading the Falling Three Methods
Most traders who use candlestick patterns such as the falling three methods in their analysis don’t use the pattern as is. They apply various kinds of filters and conditions to create something that’s tradable according to their criteria.
The falling three pattern only triggers when the three inner bars fail to break above the first one. Traders have to make a judgment as to whether that will continue. Useful points to look for when trading the falling three are:
- Appearance within a downwards trend
- Low and reducing volatility within the inner candlesticks
- Downside break of triangle support line on the last candlestick
Trading the Rising Three Methods
Entry point
Traders can enter the market when the last bar in the pattern closes. Alternatively, a trade could be taken when price goes above the high of the final candle. Enthusiastic traders may look for an entry before the last bar closes but have to be prepared to leave if the fifth bar fails to complete the pattern.
Take profit
Traders should ensure that the rising three methods pattern is not found at the bottom of important resistance to make sure that the uptrend has enough room to carry on. For example, a trend line or widely used moving average slightly above the pattern could prevent further gains. Resistance levels should be checked on longer-term charts to increase the probability of a successful trade. The rising three methods may be more efficient if the wick of the previous bullish candlestick, showing the high and low traded price for that period, are shallow and if it forms above a whole number.
Risk management
Excited traders could place a stop-loss order below the low of the last bar in the pattern or under the second small candlestick, depending on their risk tolerance. Traders who want to give their trade some room to move might put a stop-loss order below the first bullish candle or under a recent swing low.
Conclusion
The world of trading is filled with false information and fake trading vendors. It’s important that you do your own research before trading anything. Carry out your own research and analysis before you begin trading a strategy or pattern. Else, you will end up as nearly everybody else, and lose in the markets.
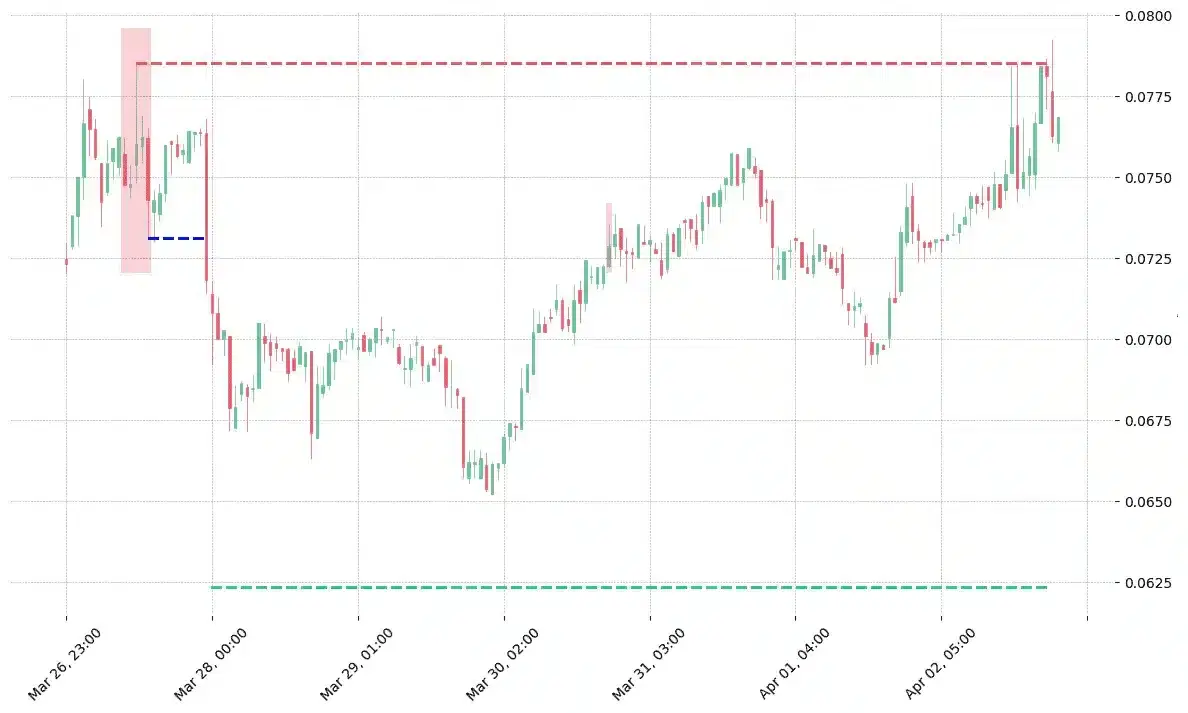
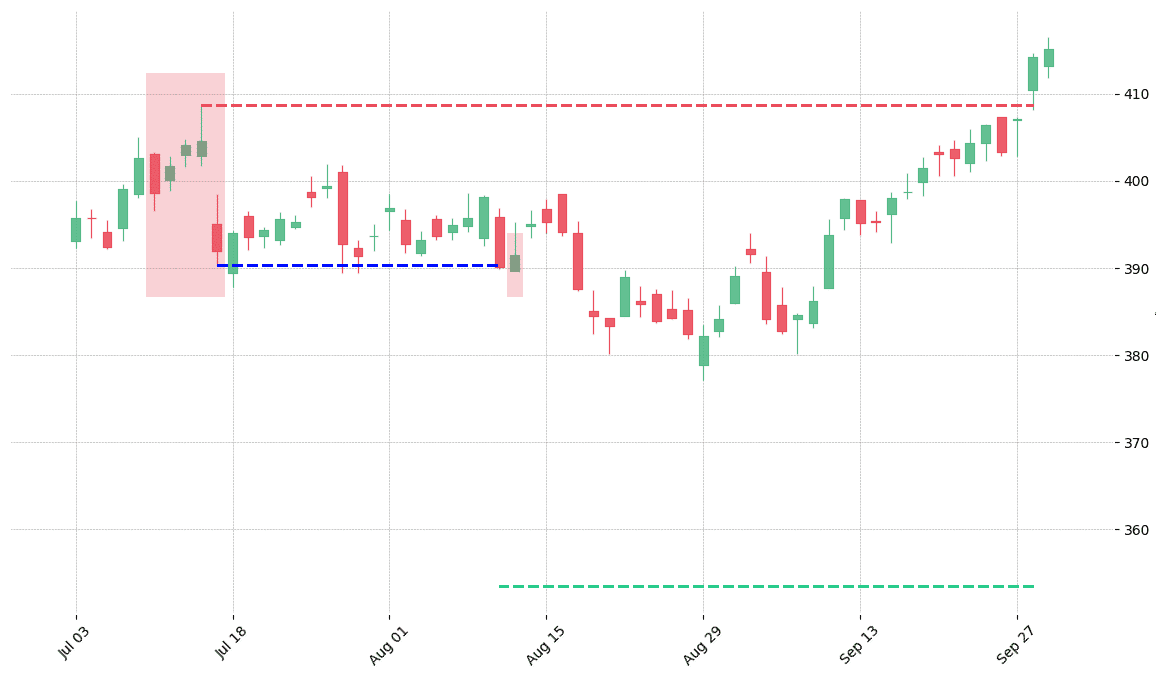
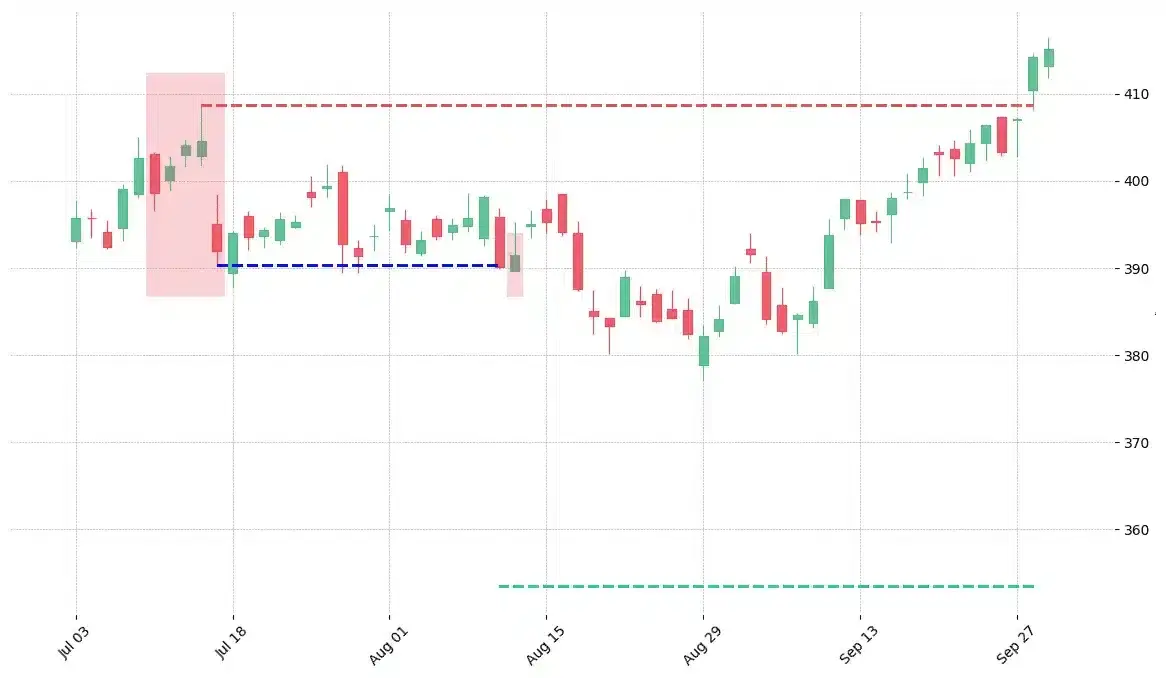
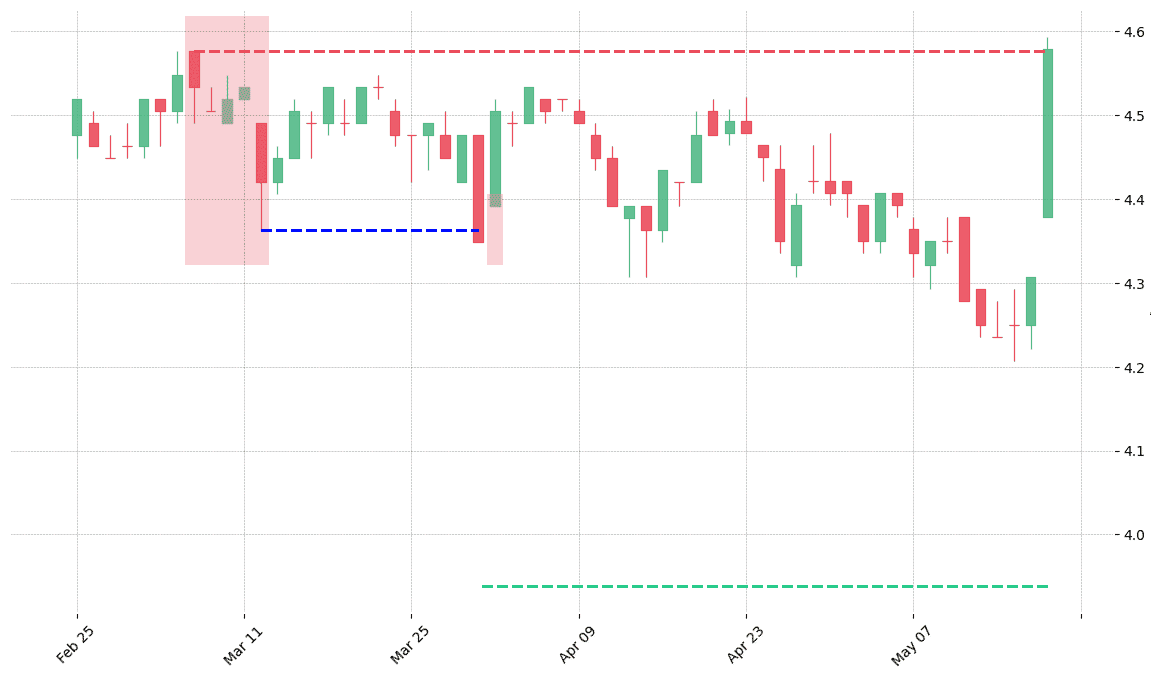
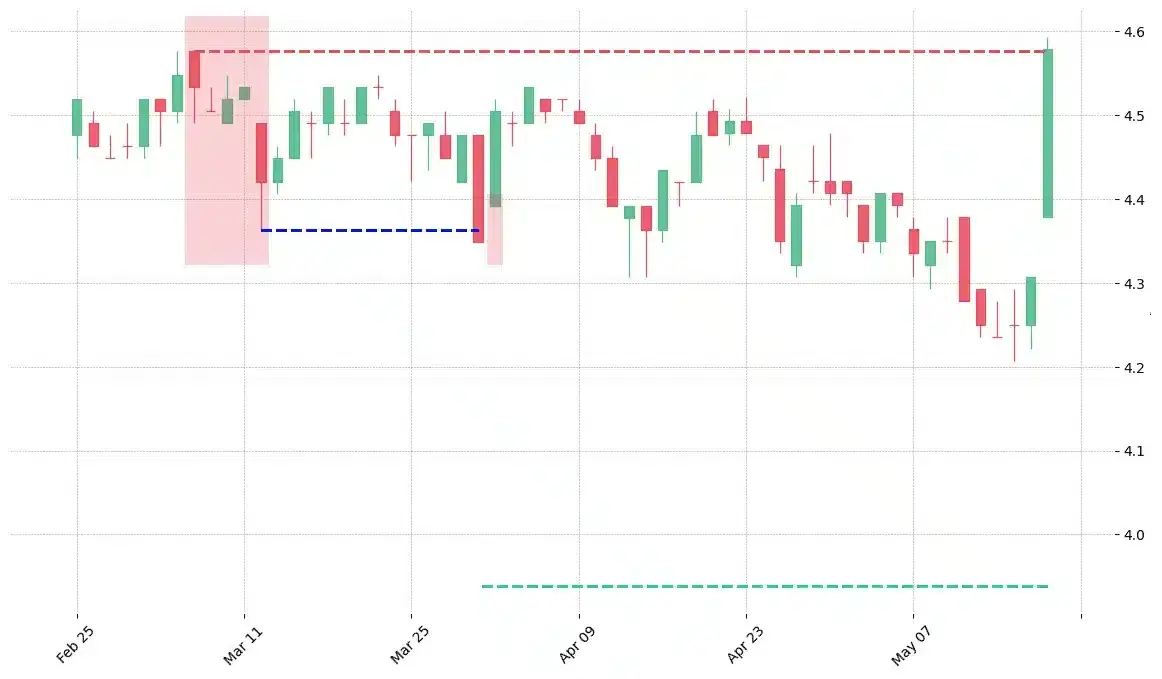
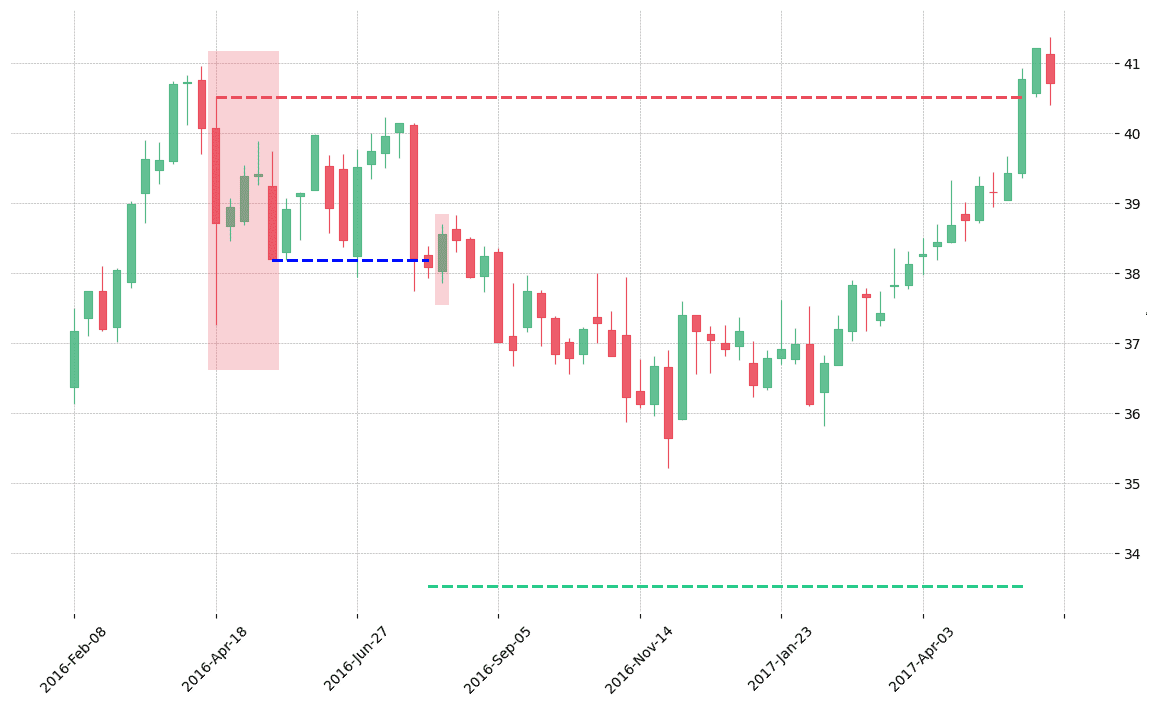
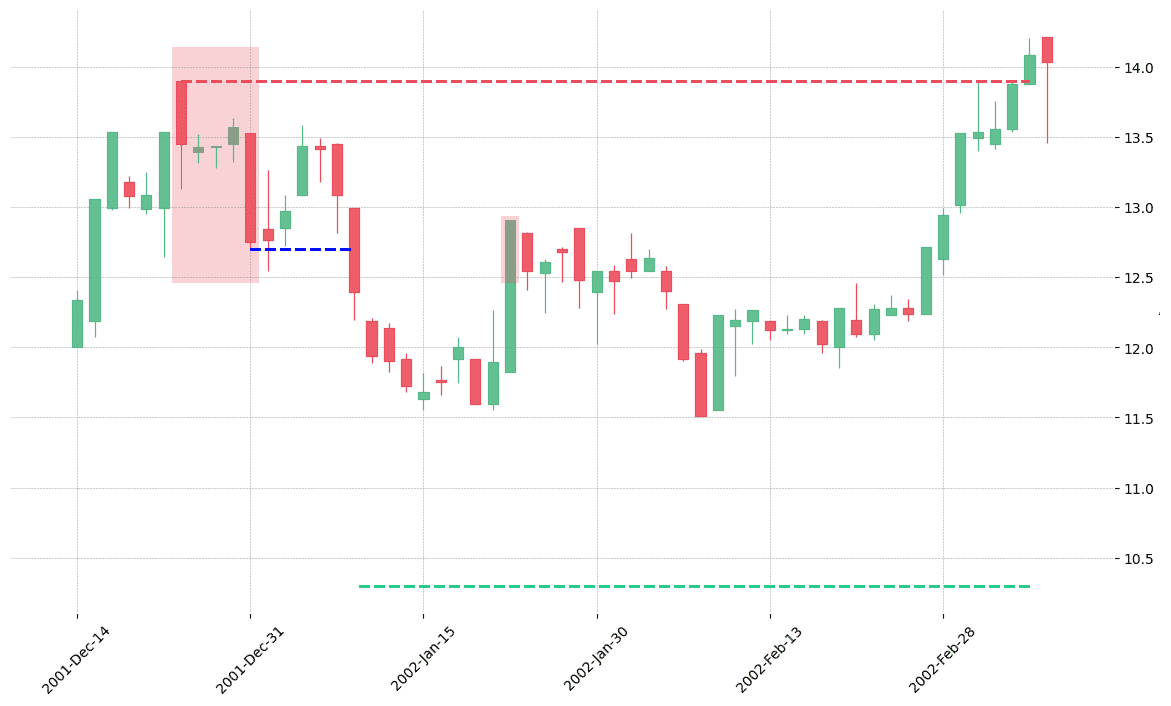
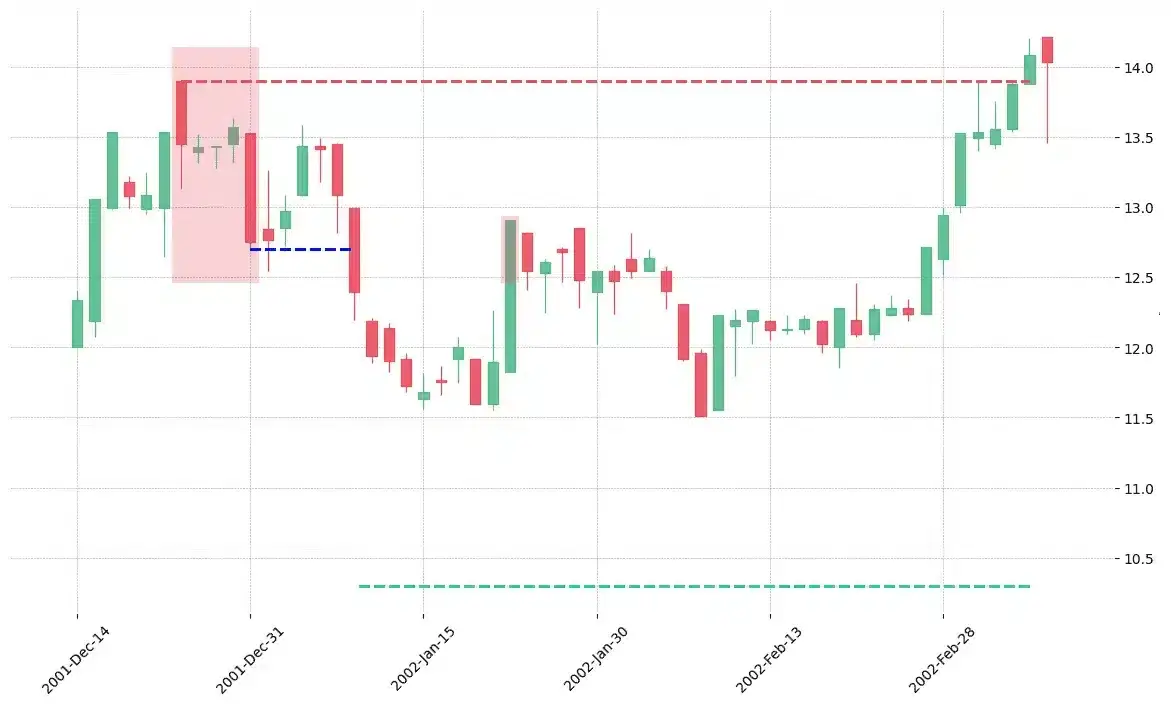
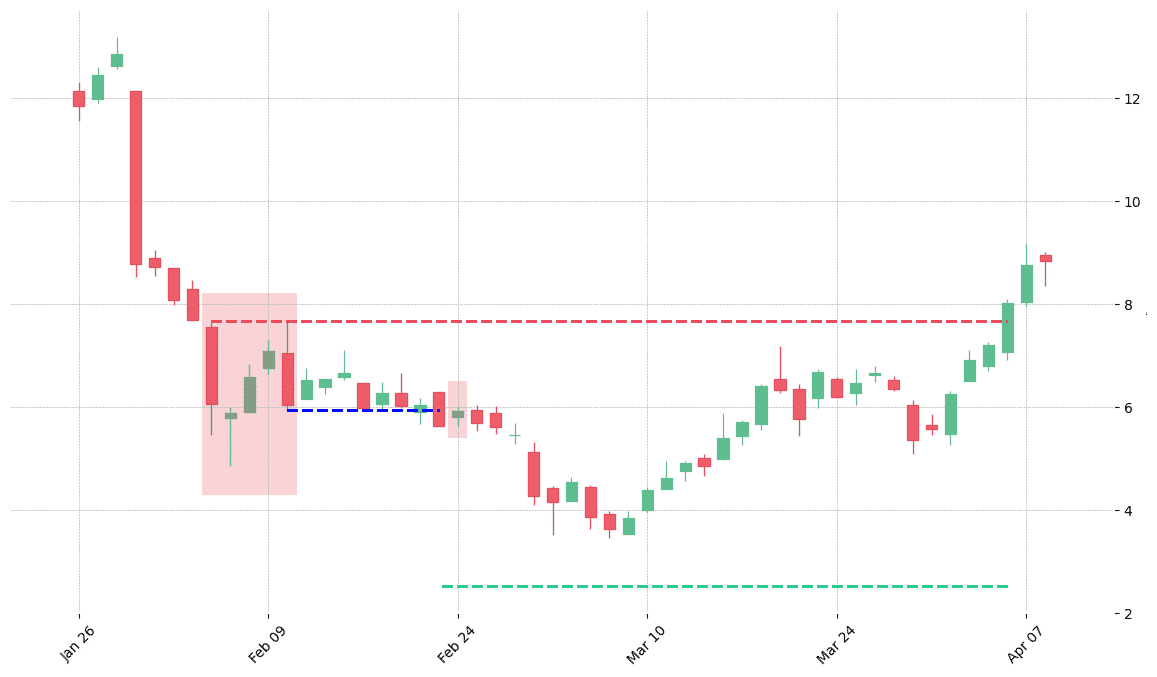
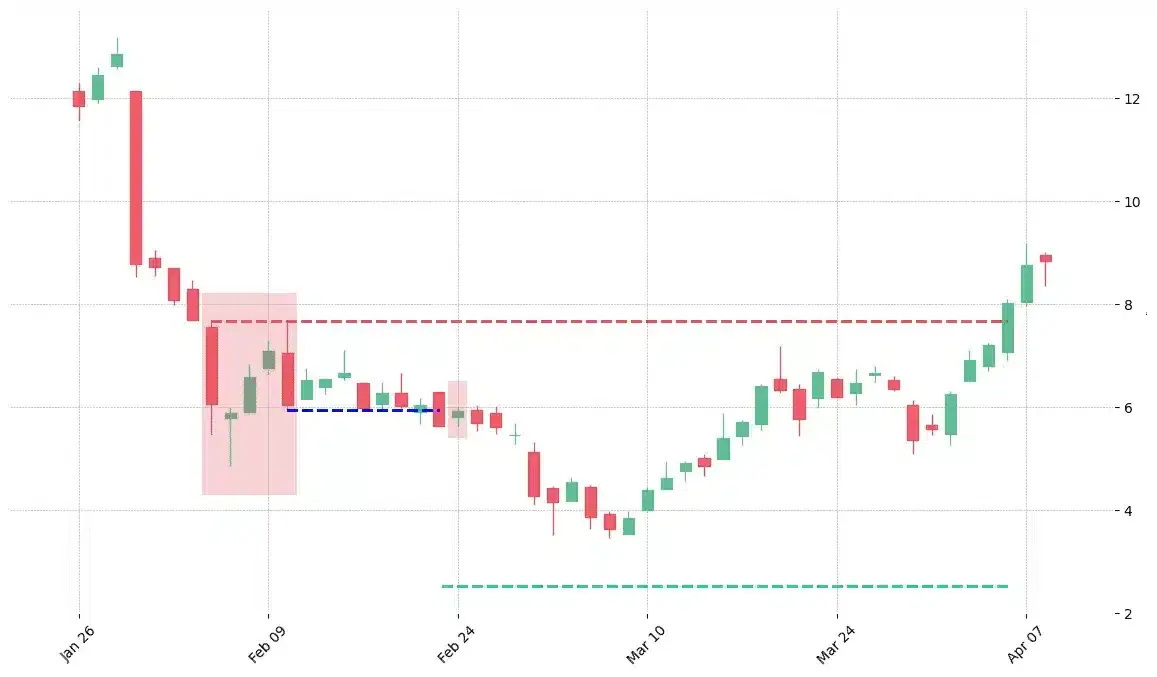
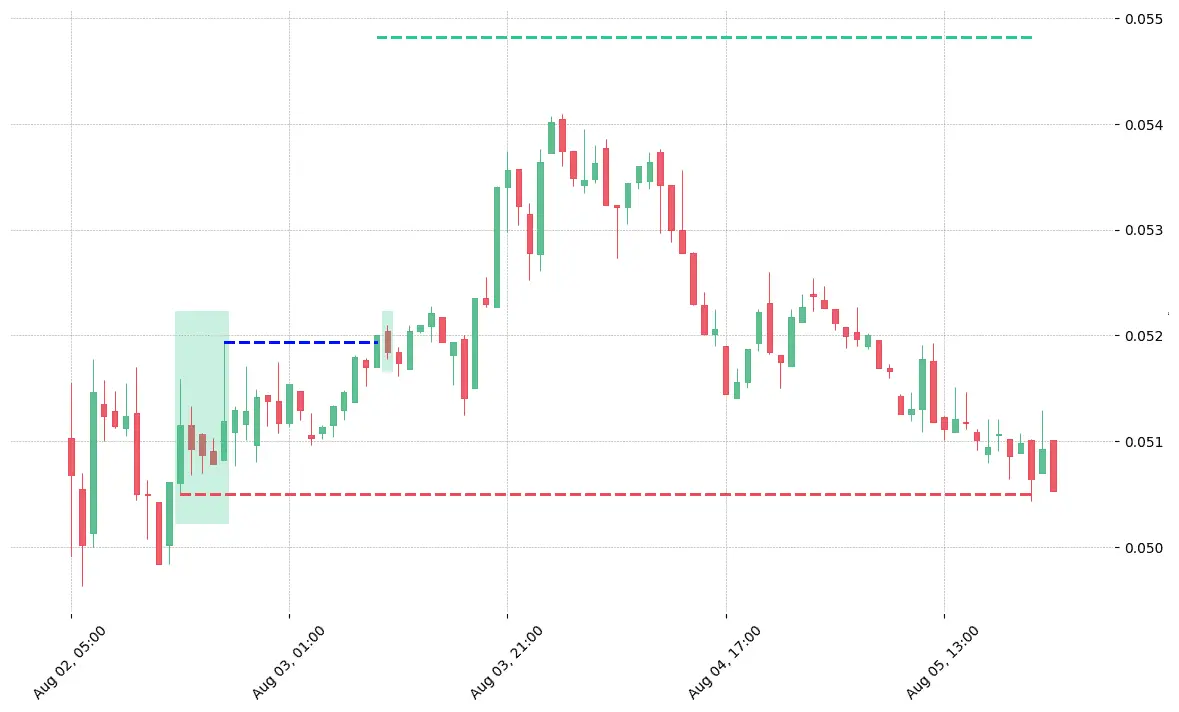
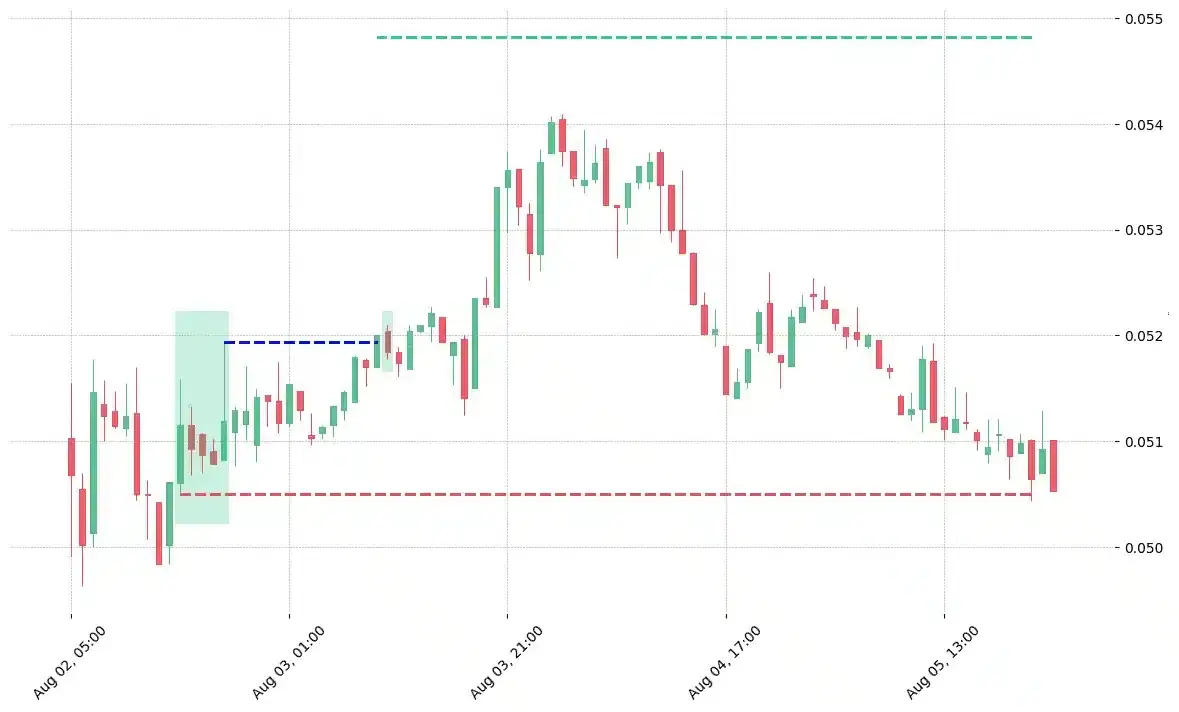
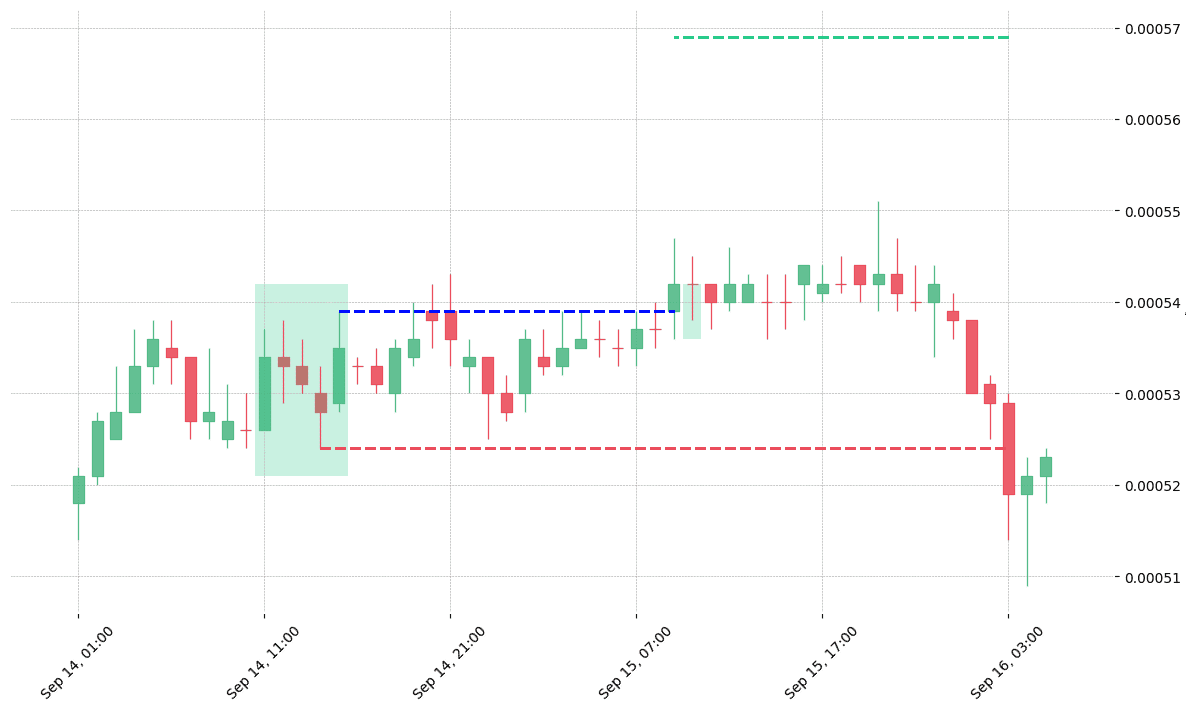
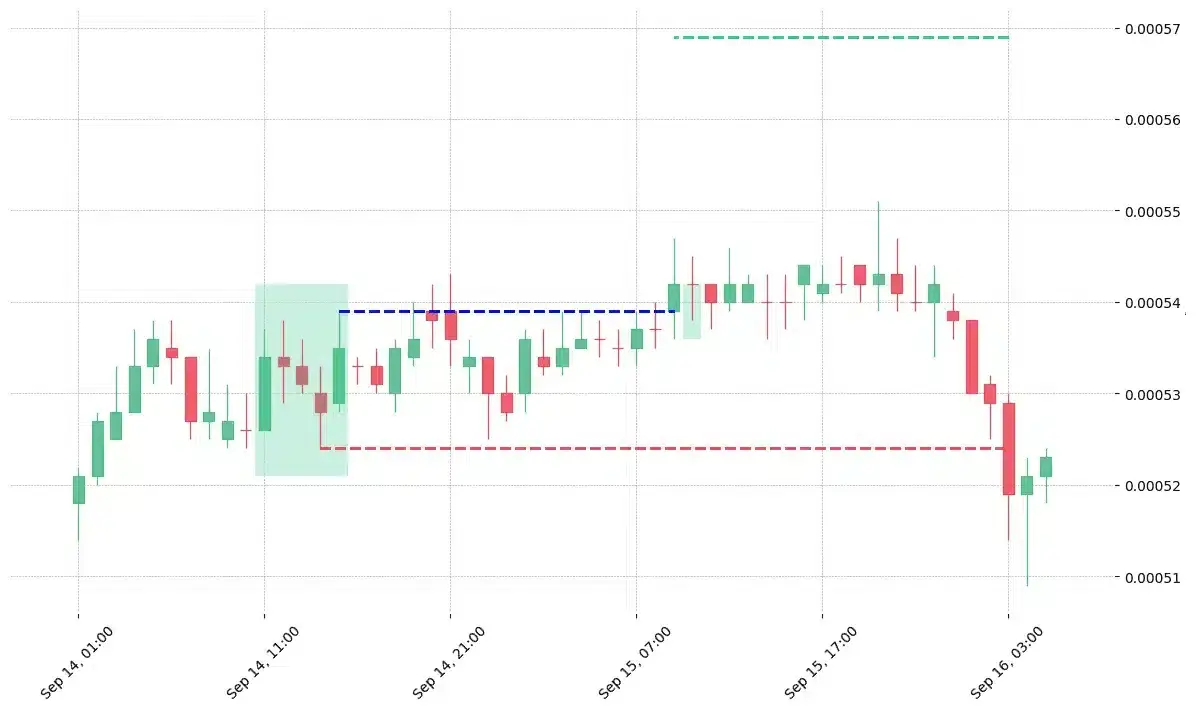
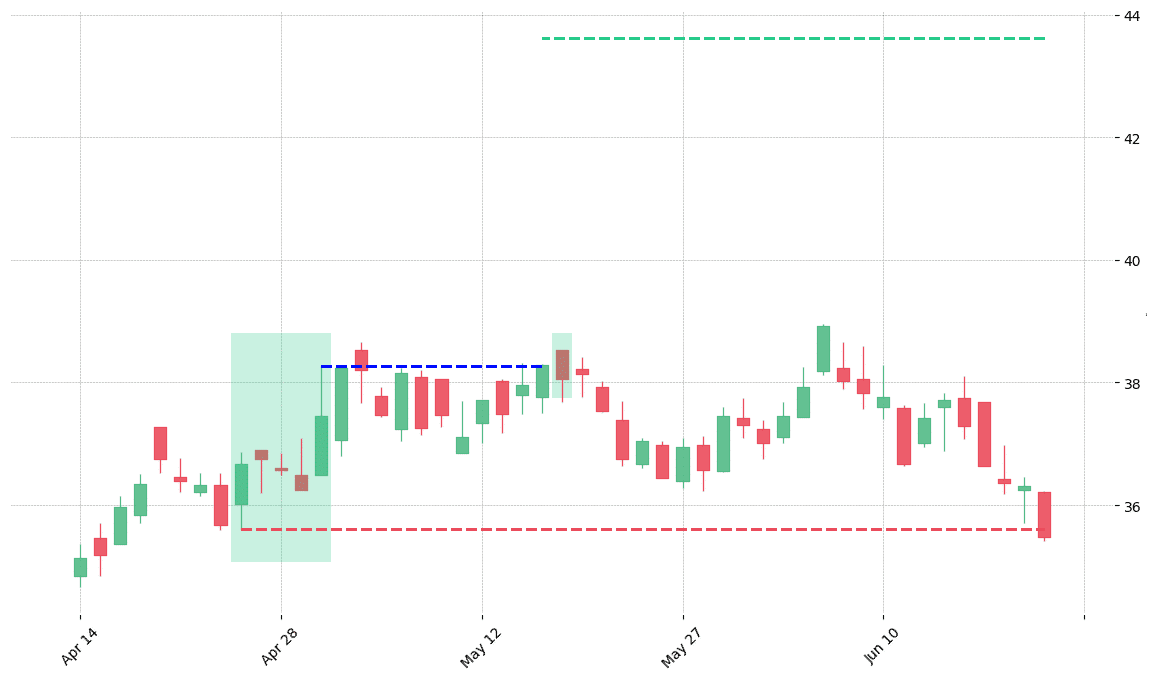
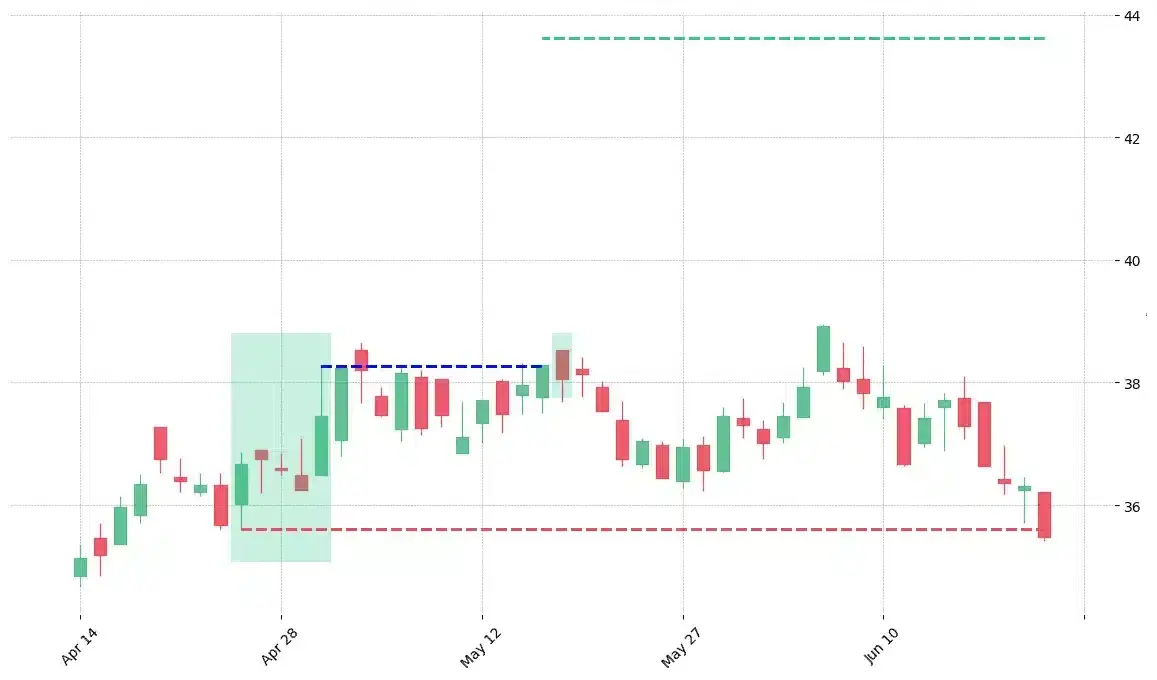
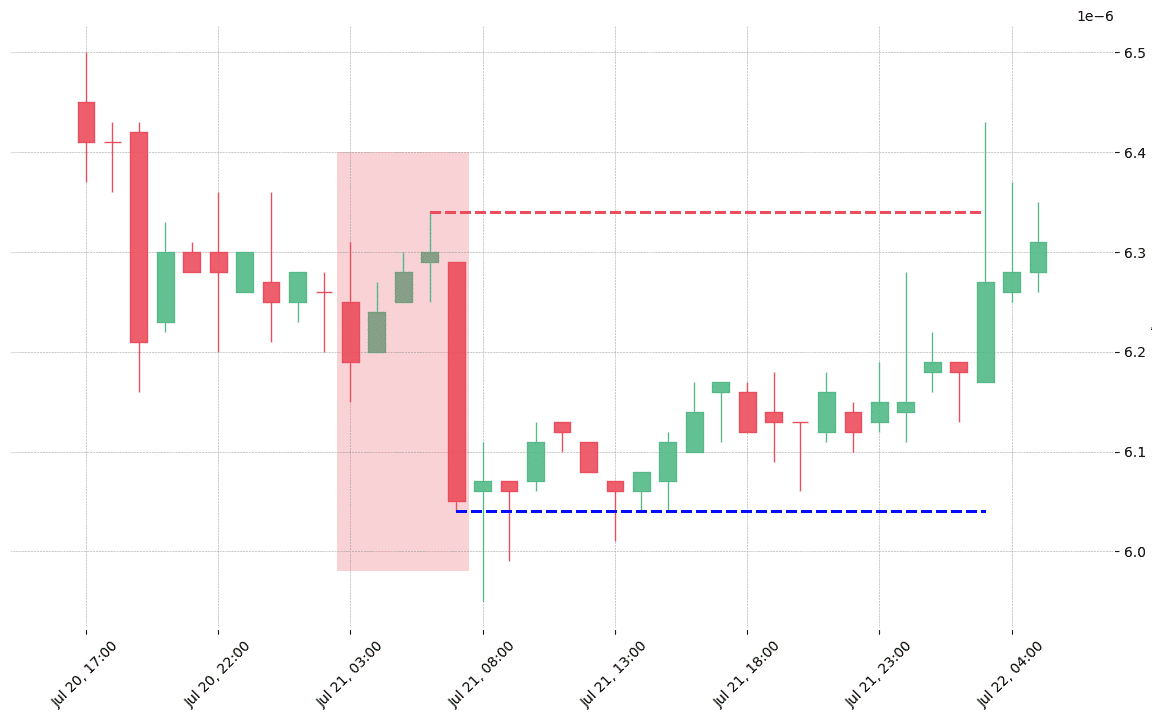
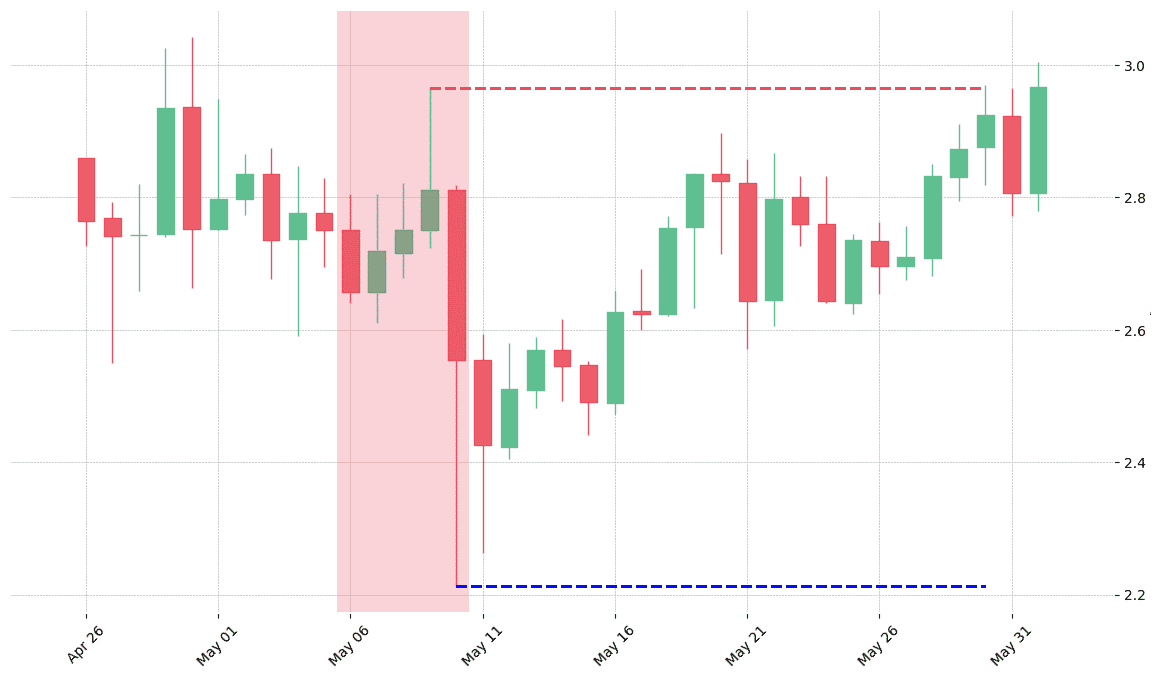
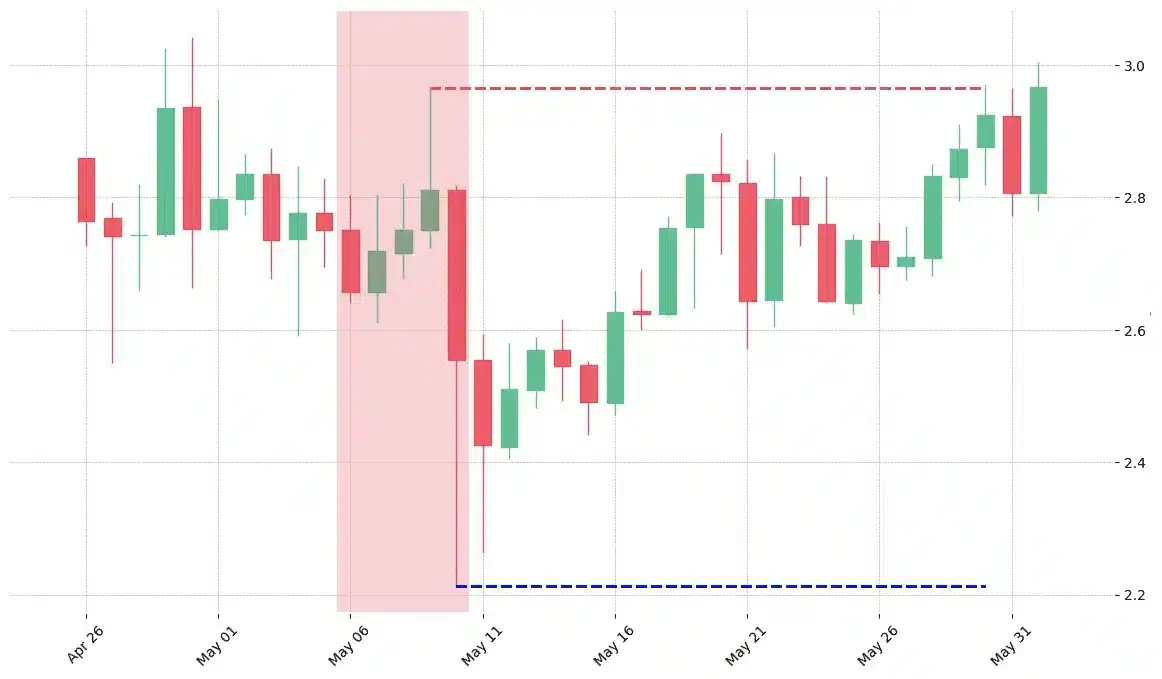
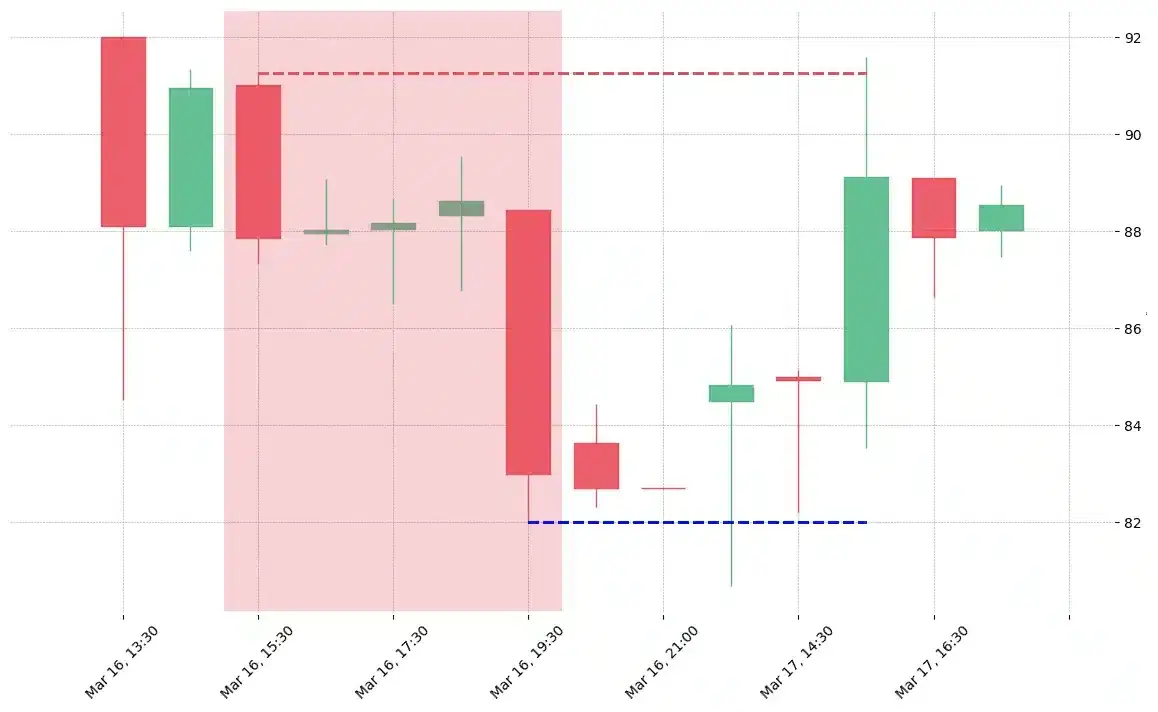
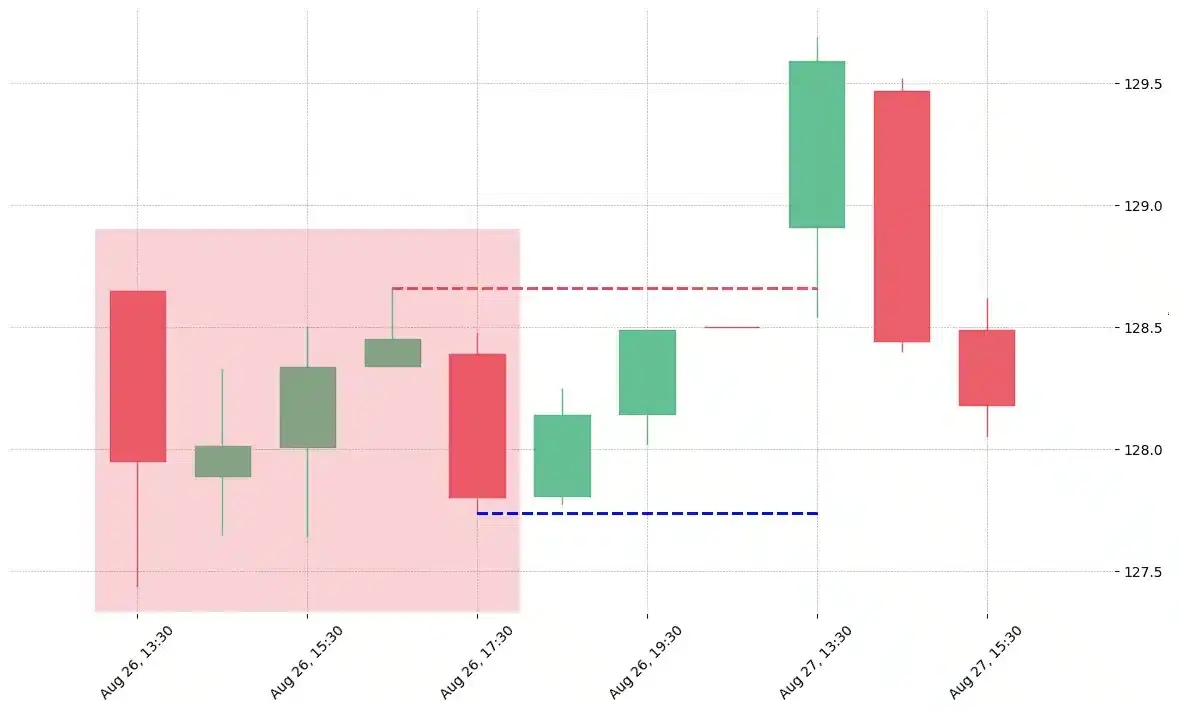
How does the Falling & Rising Three Methods pattern look in real life?


Looking to learn more about this pattern?
You should take a look at Joe Marwood's online course. In his course, he backtested the 26 main candlestick patterns before to summarize which one is THE best pattern. I really liked his course and you shouldn't miss it!
Click here to signup to his "Candlestick Analysis For Professional Traders" course now!


 We loved Marwood Research’s course “Candlestick Analysis For Professional Traders“. Do you want to follow a great video course and deep dive into 26 candlestick patterns (and compare their success rates)? Then make sure to check this course!