
 Good Trading requires the Best Charting Tool!
- An engulfing pattern is a 2-bar reversal candlestick pattern
- The first candle is contained with the 2nd candle
- A bullish engulfing pattern has a red candle engulfed within a green candle
- A bearish engulfing pattern has a green candle engulfed within a red candle
Statistics to prove if the Engulfing pattern really works
Are the odds of the Engulfing pattern in your favor?
How does the Engulfing behave with a 2:1 target R/R ratio?
From our research the Engulfing pattern confirms 67.3% of the time on average overall all the 4120 markets we analysed. Historically, this patterns confirmed within 2.9 candles or got invalidated within 5.9 candles. If confirmed, it reached the 2:1 R/R target 36.8% of the time and it retested it's entry price level 97.1% of the time.
Not accounting for fees, it has an expected outcome of 0.104 $/$.
It means for every $100 you risk on a trade with the Engulfing pattern you make $10.4 on average.
Want to account for your trading fees? Have the detailled stats for your favorite markets / timeframes? Or get the stats for another R/R than 2:1?
🚀 Join us now and get fine-tuned stats you care about!
How to handle risk with the Engulfing pattern?
We analysed 4120 markets for the last 59 years and we found 426 665 occurrences of the Engulfing pattern.
On average markets printed 1 Engulfing pattern every 37 candles.
For 2:1 R/R trades, the longest winning streak observed was 13 and the longest losing streak was 33. A trading strategy relying solely on this pattern is not advised. Anyway, make sure to use proper risk management.
Keep in mind all these informations are for educational purposes only and are NOT financial advice.
If you want to learn more and deep dive into candlestick patterns performance statistics, I strongly recommend you follow the best available course about it. Joe Marwood (who's a famous trader with more than 45 000 Twitter followers) created an online course called "Candlestick Analysis For Professional Traders" in his Marwood Research University. There he will take you through the extensive backtesting of the 26 main candlestick patterns. He then summarizes which one is THE best pattern. Do you know which one it is?
Remember, don't trade if you don't know your stats. Click here to signup to the course now!
One of the smart things traders learn to do is to trade with the trend. Using the day-trading strategy of an engulfing candlestick pattern for currencies or stocks is one way to get into trending moves just as momentum is increasing. Candlesticks are important in analyzing the price action in any market. They can provide accurate signals about the potential direction of a price chart.
What is the Engulfing pattern?
Traders make use of the engulfing pattern to enter the market while hoping for a possible trend reversal. Candles in this pattern signal a reversal in the current trend. It involves two candlesticks with one candle entirely “engulfing” the body of the other. To get a valid engulfing pattern, the first candle has to fit inside the body of the next candle.
The engulfing candle can either be bearish or bullish, depending on its location in the current trend. The opposite scenario is possible too. Since it is formed by two candles, it is categorized as a double candlestick pattern.
A candlestick shows the open-to-close range of every trading period. Its timeframe can vary from a second to a day or more – depending on the settings of the chart. Viewing two bars next to each other will offer a good comparison of the market direction from one time to the next. The color of the candle indicates if the direction of the price has gone up (green or white) or down (red or black).
How to identify the Engulfing candlestick pattern?
For a perfect engulfing candlestick, no part of the first candle can exceed the shadow (or wick) of the second candle. This entails that the low and high of the second candle entirely covers the first. But the major emphasis is on the body of the candle.
Engulfing candles are one of the most used candlesticks to determine if the market is experiencing downward or upward pressure. However, it is necessary to have it in mind that engulfing candles are lagging technical indicators – meaning they come up after price action – as they need the data of the worth of the two previous candlesticks before they give a signal.
There are 2 types of Engulfing patterns
There are two types of engulfing candlestick patterns: bullish and bearish engulfing candlestick patterns.
Bullish engulfing pattern
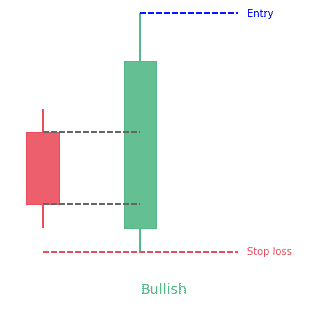
The bullish candle gives the best signal when it appears below a downtrend and shows a rise in buying pressure. The pattern mostly causes a reversal of a current trend. It’s due to more buyers entering the market and driving prices further up. The pattern involves two candles, with the second green candle completely engulfing the previous red candle with no regard to the length of the tail shadows.
This pattern is a two-candle reversal pattern that is a combination of one dark candle followed by a larger hollow candle. On the second day of the pattern, prices are lower than the previous low, yet buying pressure pushes the price to go to a higher level than the previous high, causing an obvious win for buyers. Traders are advised to enter a long position as the price goes higher than the high of the second engulfing candle.
Price action has to show a clear downtrend when the bullish pattern appears. The big candle indicates that there are a lot of buyers in the market and this gives the previous bias for more upward movement. Traders will then look for confirmation that the trend is turning around by using indicators. They can be important resistance and support levels, and subsequent price action after the engulfing pattern.
Bearish engulfing pattern
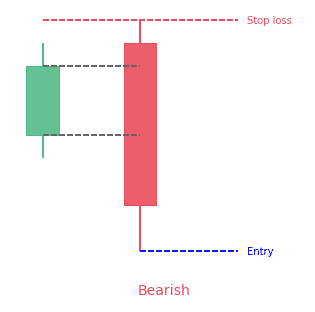
A bearish engulfing chart pattern is a technical pattern that indicates lower prices to come. It consists of a high (green) candle followed by a large down (red) candle that engulfs the smaller up candle. The pattern is necessary because it signals that sellers have overtaken the buyers. These sellers are aggressively driving the price downwards, more than buyers can push up.
This pattern is simply the opposite of a bullish pattern. It offers the best signal when seen above an uptrend and shows a rise in selling pressure. The candle mostly causes a trend reversal, as more sellers are going into the market to drive prices further down. The pattern is made up of two candles with the second candle completely engulfing the previous green candle.
When the bearish pattern appears, price action has to clearly show an uptrend. The big bearish candle means that sellers are aggressively going into the market. This gives the previous bias for more downward momentum. Traders will then look for confirmation that the trend is reversing.
What does Engulfing patterns tell traders?
Bullish pattern
The bullish candlestick tells traders that buyers are in total control of the market, following a previous bearish run. It is often seen as a signal to buy and take advantage of the market reversal. The bullish pattern is also a sign for traders having a short position to think about closing that trade.
Even though the wicks of engulfing candles are not as necessary as the bodies, the second candle in a bullish engulfing can give a perfect indication of the location to place a stop-loss for a long position. This is because it shows the lowest price a trader is willing to accept in exchange for an asset at that point. Therefore, if the present uptrend reverses, you will see a clear exit point for your position.
Bearish pattern
A bearish pattern indicates that the market will soon enter a downtrend, following a past increase in prices. The pattern signals that the market has been taken over by bears and could push the prices even further down. It is often seen as a sign to enter a short position in the market.
Also, the pattern shows that those in a long position should consider closing their trade.
Although the wicks are not usually considered important to the pattern, they can give traders an idea of where to put a stop-loss. For a bearish engulfing pattern, you should place a stop-loss above the wick of the red candle. Since this is the highest price the buyers were willing to pay before the downturn of the asset.
How to trade when you see the Engulfing candlestick pattern?
Isolate the trend
The first step in trading the engulfing candle is to note the direction of the strongest trend. It’s the direction you will trade-in.
An uptrend is indicated by higher-swinging highs and higher-swinging lows in price. You should take only long positions during an uptrend, buying to sell later when the price rises.
A downtrend is indicated by lower-swinging lows and lower-swinging highs in price. Take only short positions when there’s a downtrend, selling a borrowed asset to buy and return it later when the price goes down.
Watch for upward or downward pullback
After you’ve established the trend, wait for a pullback. If you don’t notice any trend, or if the trend is not clear, don’t use this strategy.
Entering the trade after the engulfing candlestick pattern
When you’ve isolated the trend and notice a pullback occurring, enter the trade. After initiating the trade by making use of the engulfing candle strategy, put a stop-loss above the current high for short positions, and lower than the current low for long positions.
Exiting the trade
A rule of thumb is to ensure your winners are as big as your losers; two times bigger is best. Measure the distance between your entry point and where you placed the stop loss.
Exit the trade if the trend tries to reverse by making a higher high and higher low during a downtrend and short trade or by making a lower high and lower low during an uptrend and long trade.
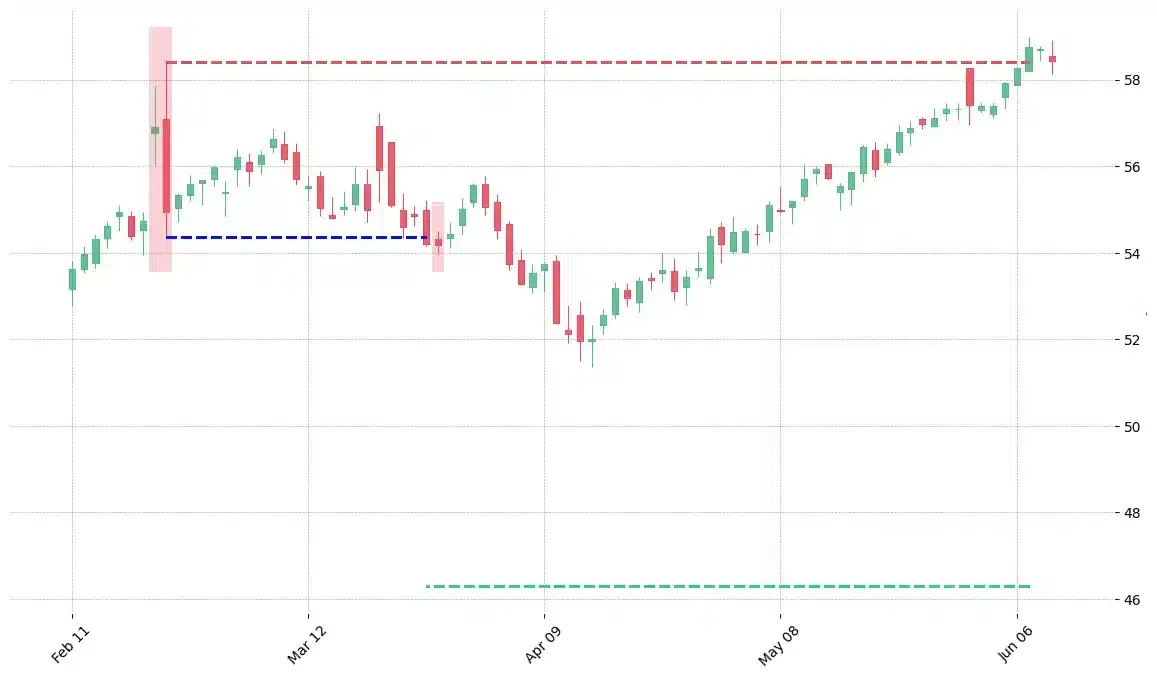
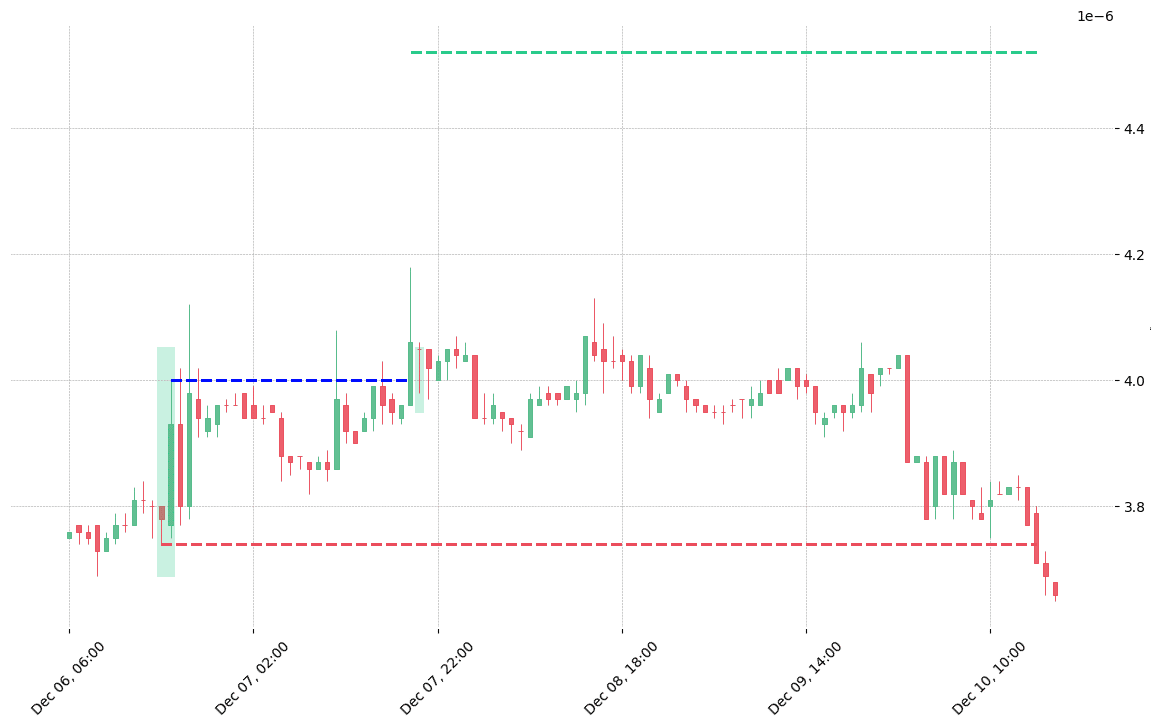
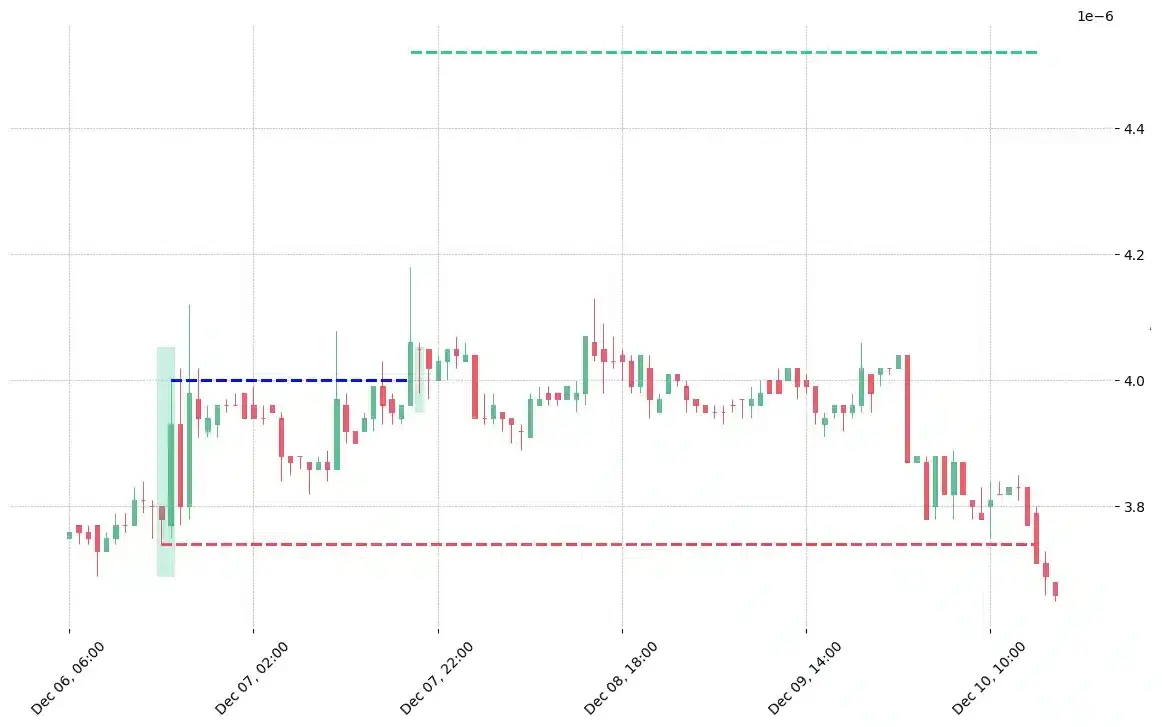
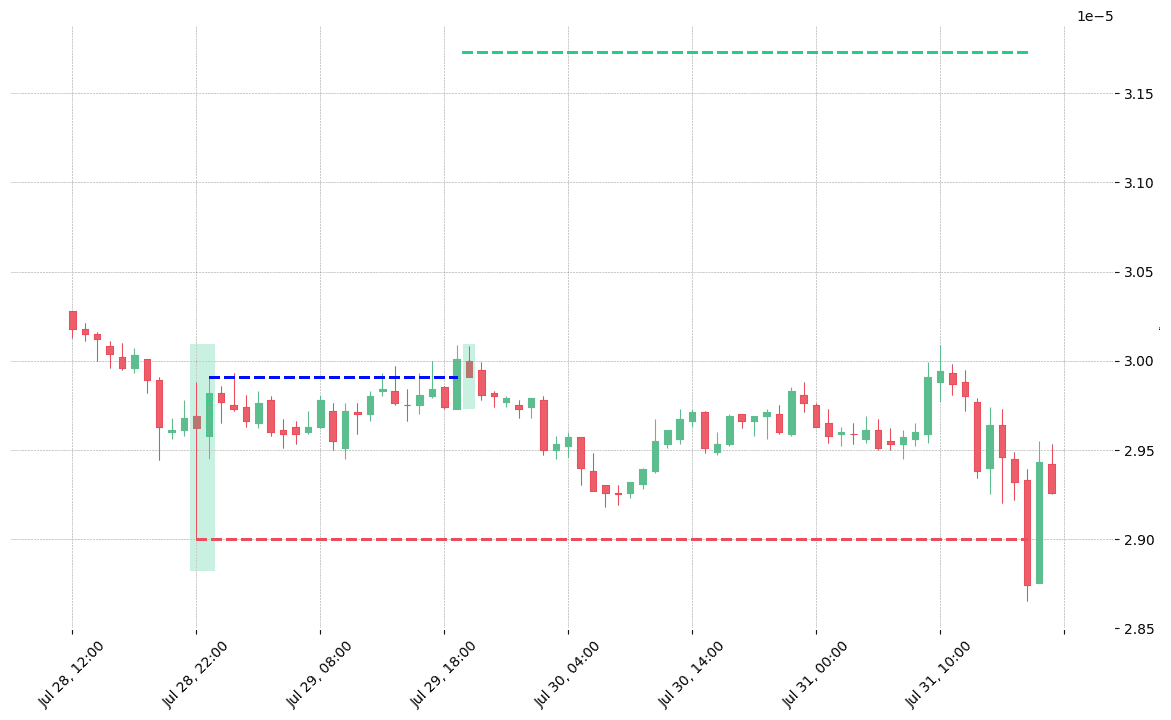
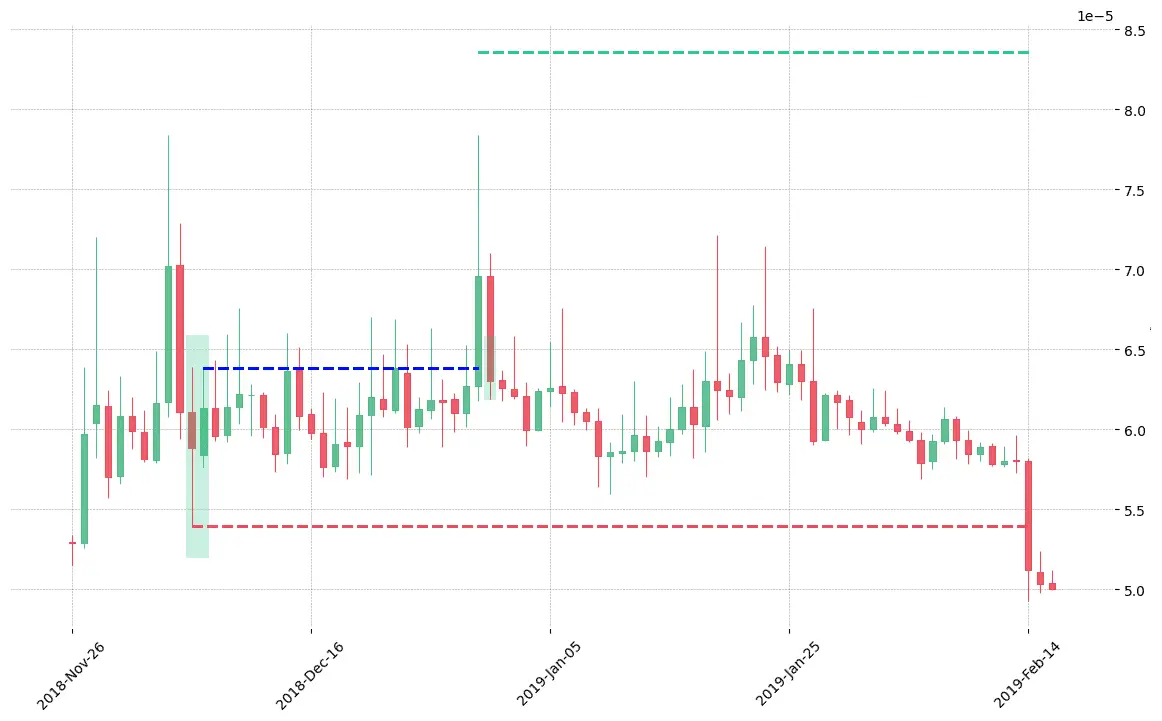
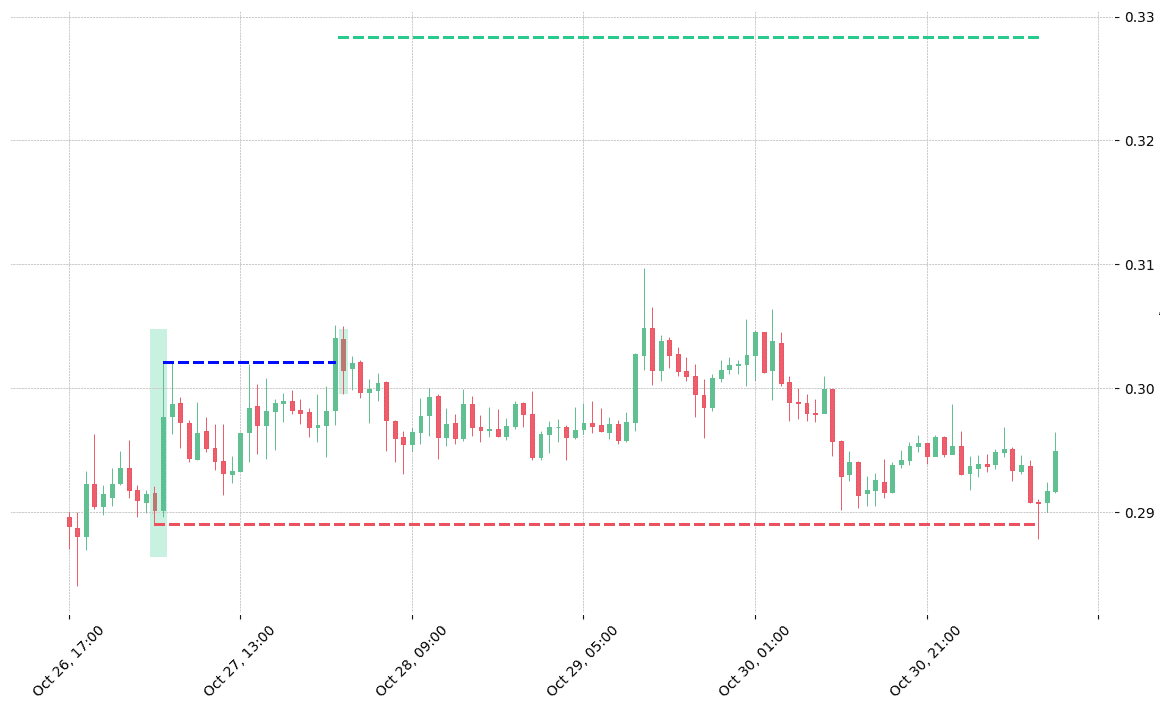
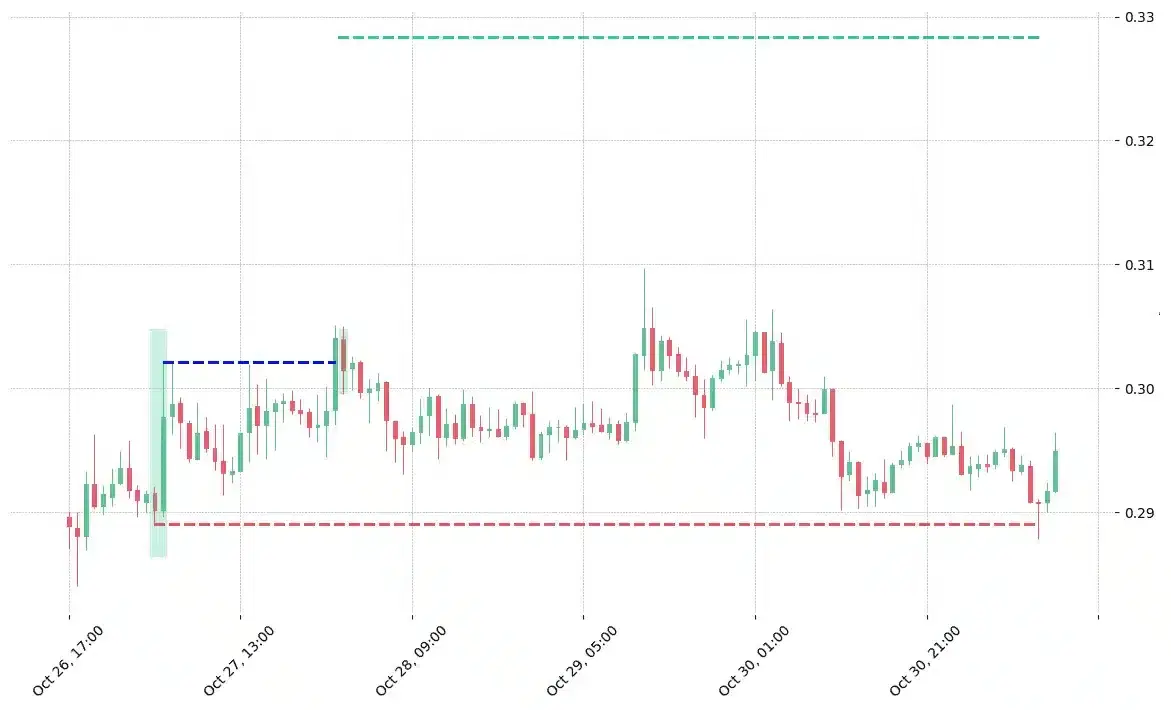
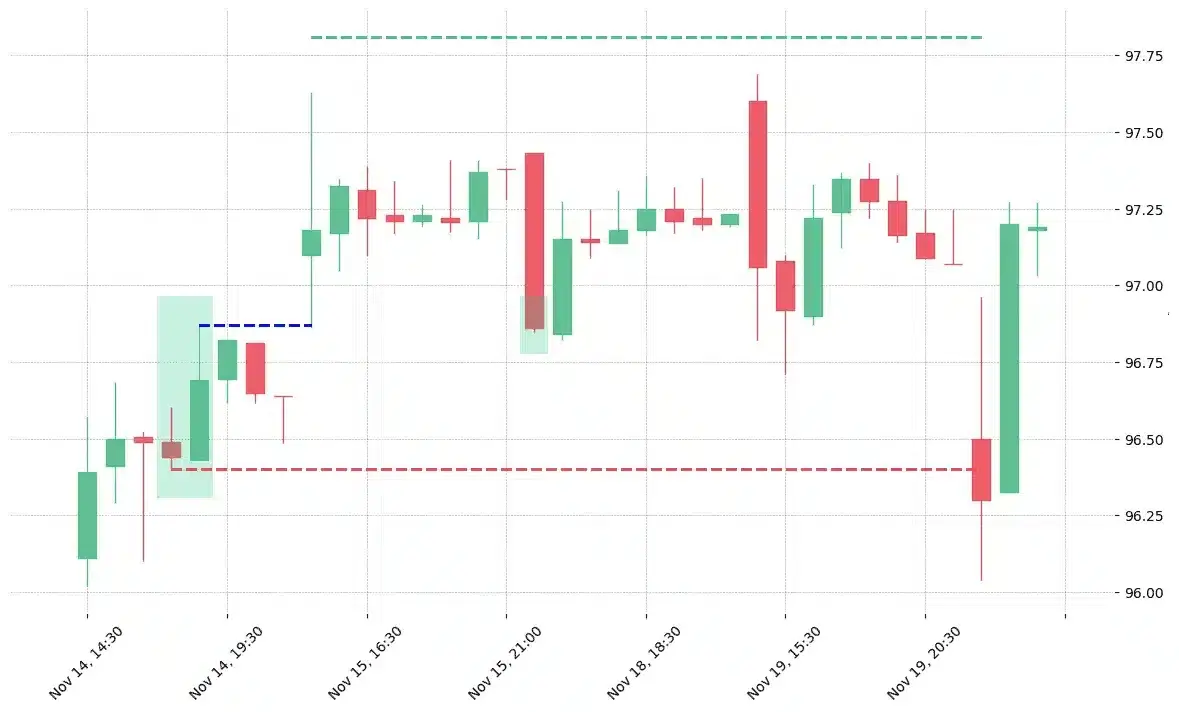
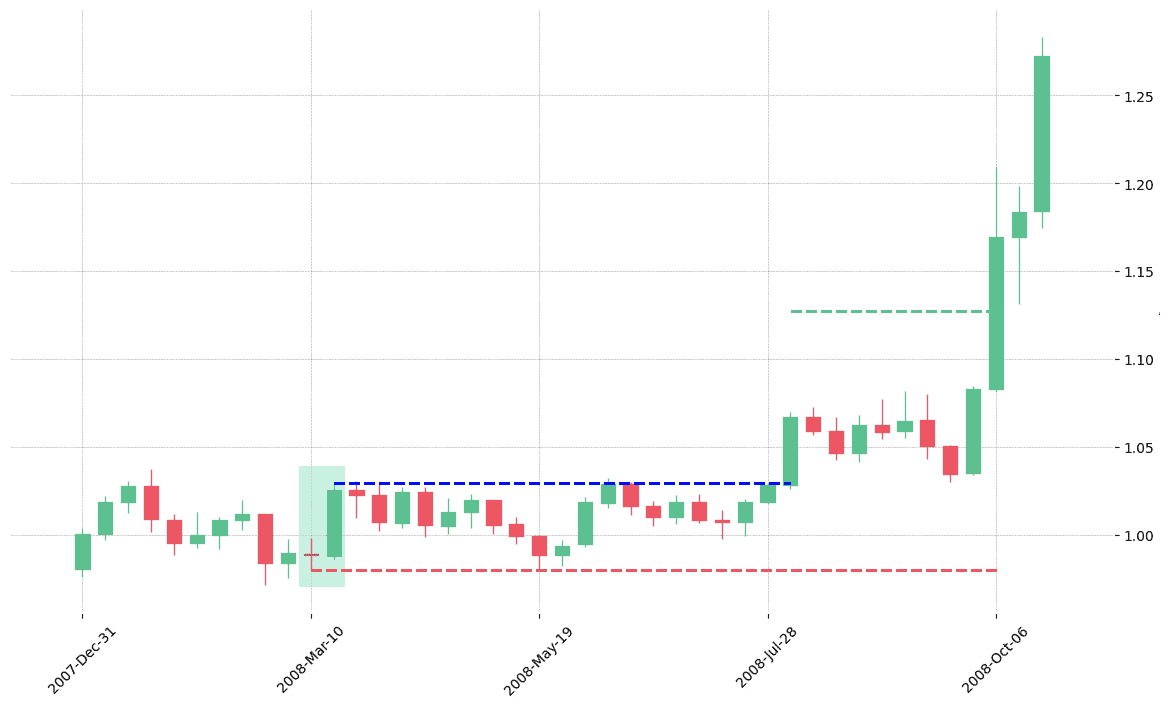
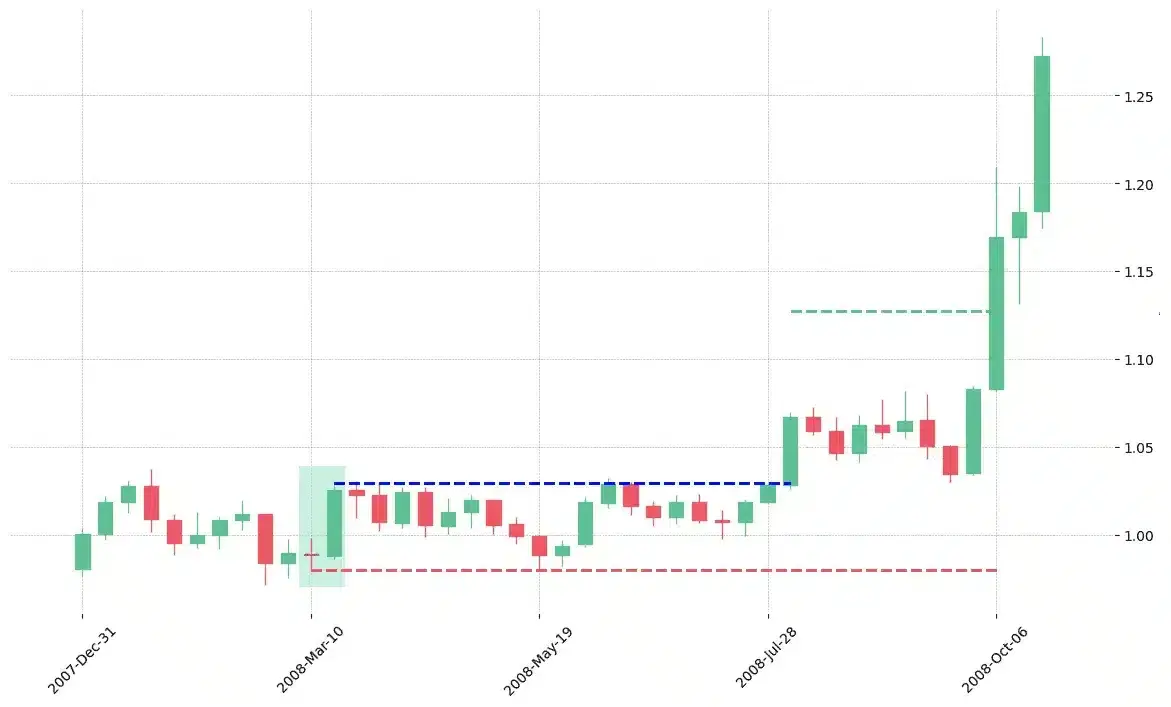
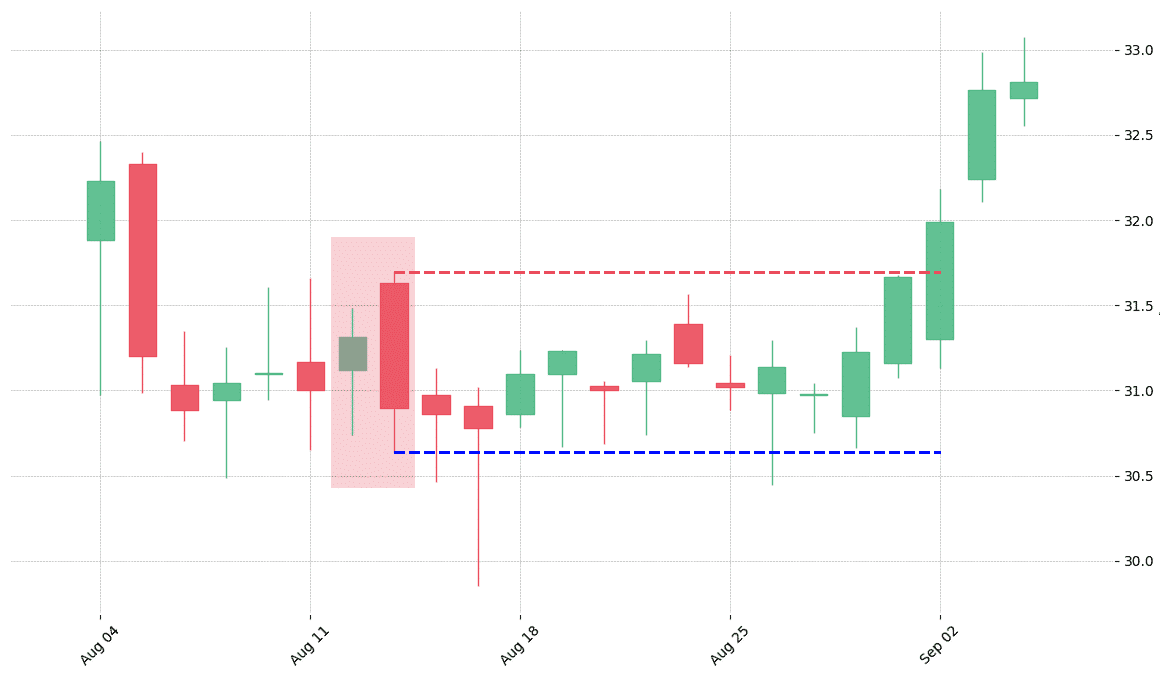
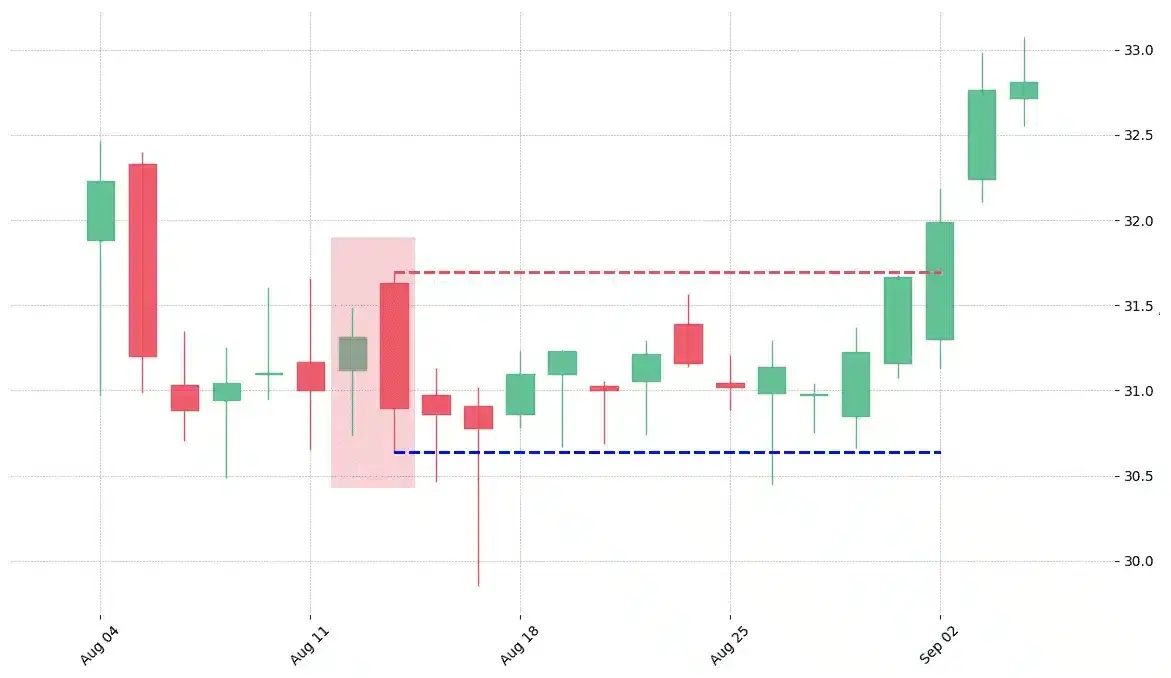
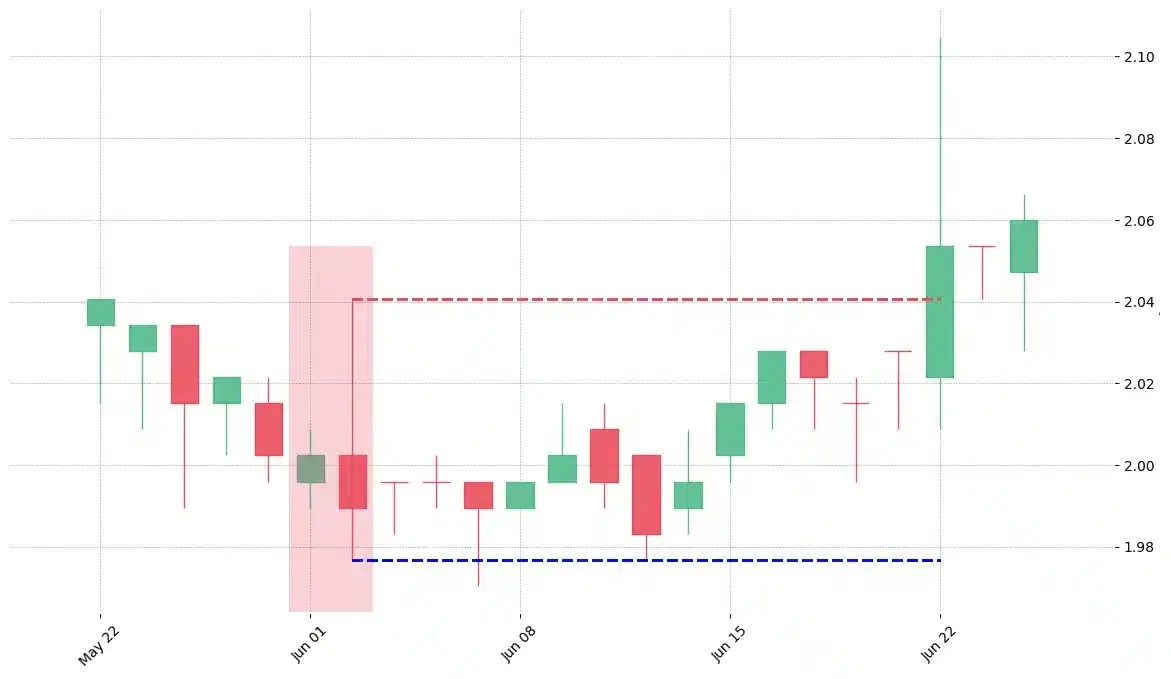
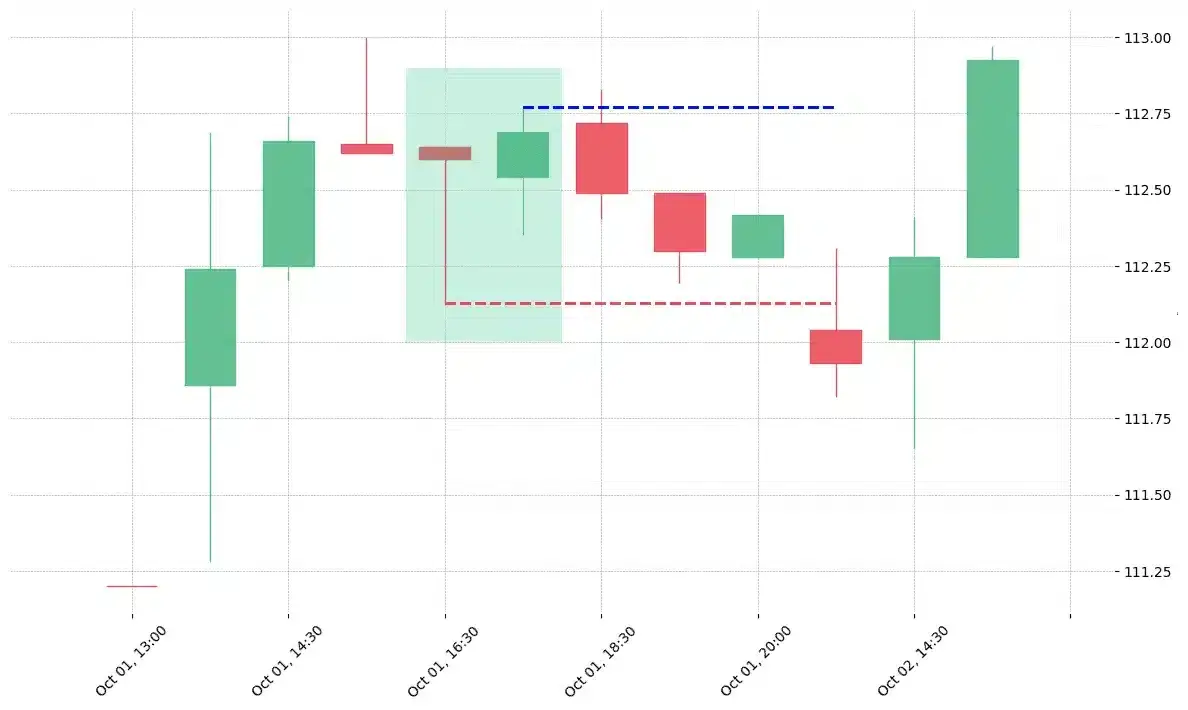
How does the Engulfing pattern look in real life?


Looking to learn more about this pattern?
You should take a look at Joe Marwood's online course. In his course, he backtested the 26 main candlestick patterns before to summarize which one is THE best pattern. I really liked his course and you shouldn't miss it!
Click here to signup to his "Candlestick Analysis For Professional Traders" course now!


 We loved Marwood Research’s course “Candlestick Analysis For Professional Traders“. Do you want to follow a great video course and deep dive into 26 candlestick patterns (and compare their success rates)? Then make sure to check this course!