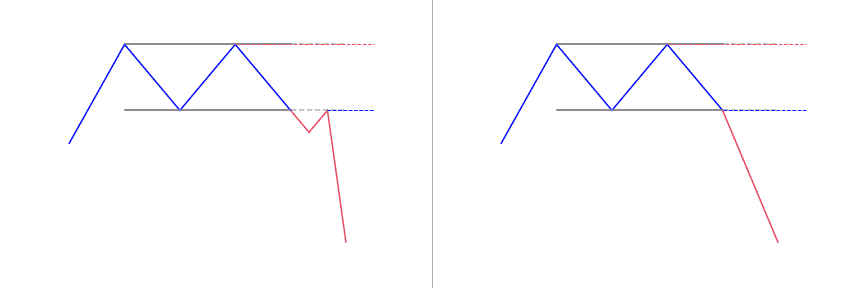
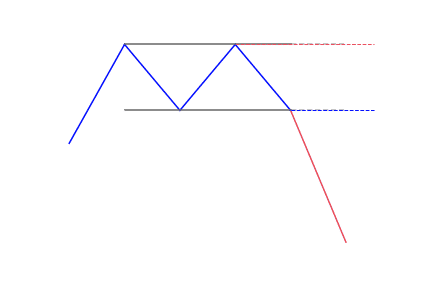
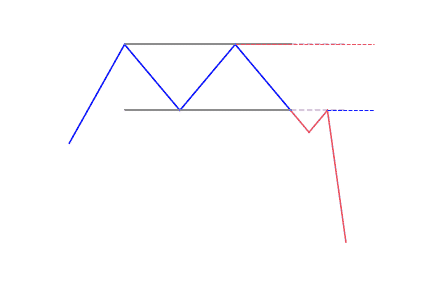
- The double top looks like the letter “M”
- Price touches twice a resistance level
- The double top pattern follows an uptrend
- It signals the reversal and the beginning of a potential downtrend
What is the Double Top pattern?
A double top is a very bearish technical reversal pattern. It forms after an asset gets to a high price two consecutive times with a moderate decline between the two highs, just as its name indicates. It is confirmed once the price of the asset falls below a specific support level equal to the low between the two prior highs.
This pattern prints two lower high points within a market which means an impending bearish reversal signal. Traders can notice a decline in price between the two high points. It shows some resistance at the price highs. After retracing a part of the first peak, the market gets back towards the high of the first peak. But, this time, strength in the market is waning and is not able to maintain a break above the first peak.
The reduction in momentum may be seen through a lagging peak on an oscillator such as RSI. The market may break above the first peak, even if for a brief time, though not required. A temporary and slight break over the first peak is preferred as it may excite the bulls only to reverse and trend lower. Signs of a bullish shift in a sentiment indicator may mean a secondary top is on its way. The neckline is formed between the price low of the valley between the two peaks. A break of this neckline will confirm the double top pattern. The break of this neckline is a bearish confirmation.
It is important to learn about the double top trading structures and integrate them into your arsenal. Double top pattern can enhance technical analysis when trading any securities (stock, forex, crypto, …), making it very versatile in nature.
How to identify the pattern?
Every chart pattern has a confirmation signal, and the double top chart pattern is no different.
This pattern has a trigger level. It serves as confirmation for the pattern and for opening positions in the direction of the reversal breakout. The signal is found at the bottom, between the two tops of the pattern (the neckline). When this line breaks, we will have a reversal confirmation signal and a nice opportunity to go against the primary trend.
A double top pattern occurs when the price gets to a high point, retraces, rallies back to a similar high point, and then declines again. A horizontal line marks the low point of the retracement between the two peaks. This line, when extended out to the right, is important for trading and analyzing the double topping market.
These steps are useful to identify a double top pattern:
- Identify the two different peaks of similar width and height
- Distance between the peaks should not be too small, it is time frame dependent
- Confirm support/neckline price level
- Make use of other technical indicators to support double top bearish signal, such as oscillators and moving averages
A double top is a reversal chart pattern that consists of three parts: first peak (first price rejection), the second peak (second price rejection), and neckline (support area).
- First peak: The market does a pullback; you can tell for sure if you will be a reversal as trending markets do a pullback from time to time at this point.
- Second peak: The same area rejects the market, again; it is the first sign that the market could reverse even lower.
- Break of neckline: Indicates that sellers are in control and the market could continue to decline.
What does the Double Top pattern tell traders?
A double top pattern signals a medium or long-term trend change in a class of asset. They can tell traders about a possible trend reversal. However, the reversal is not confirmed until the prevailing trend has formed the second peak or second low before reversing in an opposing direction to the trend before the first peak or first low.
Just as it is with other technical analysis and chart patterns, the double top is not certain trend indicators. Due to this, traders should always make use of this pattern alongside others to confirm the trend before opening a position.
How to trade when you see the pattern?
There are two ways of trading the double top pattern: you will open a short position on a double top and a longer position on a double bottom. Before doing both however, confirm the signal with other technical analysis tools.
After the completion of the pattern, consider exiting long positions and focus on taking short positions. The uptrend is now over and a downtrend is likely to happen. The pattern is considered complete when the price goes down below the retracement low on a double top or below both retracement lows on a triple top.
The traditional approach for trading this pattern is to enter short (sell) when the price goes down below the retracement (lows). At times, the retracements will be at the same price point, but most times that won’t be the case. When the retracement lows are at different levels, this will give different potential entry points.
If you draw a trend line between the two retracement lows on a triple top pattern, when the price drops below the trend line it can also be used as an entry point. This is only important if the second retracement is higher than the first. If the second retracement low is more than the low of the first, or less than the first, then the trend line will be angled awkwardly and thus not beneficial.
Once you have initiated a short trade at any of the available entry points, place a stop-loss order. This goes above a recent swing high in price. Double top patterns give an indication of how far the price could drop once the pattern completes.
Differences with the Double Bottom pattern
The double bottom pattern reciprocates the double top pattern signaling a bullish reversal. Rather than showing confirmation at a break of the important support level, the double bottom forms at the key resistance highs between the two low points. The double bottom and double top patterns are strong technical tools. Traders use them in important financial markets including forex and stocks.

 Good Trading requires the Best Charting Tool!


 We loved Marwood Research’s course “Candlestick Analysis For Professional Traders“. Do you want to follow a great video course and deep dive into 26 candlestick patterns (and compare their success rates)? Then make sure to check this course!