
 Good Trading requires the Best Charting Tool!
A Doji Star candlestick pattern is a three-bar pattern. It is considered as a signal of a potential upcoming reversal of the current trend of the market. It is a versatile candlestick pattern that is found in two variants, bullish and bearish. Its variants depend on the trend in which it exists.
In order to understand the Doji Star candlestick pattern, it is important to understand a simple Doji candlestick pattern. Doji candlestick pattern is formed when opening and closing prices are at the same or almost at the same level. The pattern looks like a plus sign or cross.
- The Doji Star pattern is a 3-bar reversal candlestick pattern.
- It starts with a long candle, gaps to draw a doji and then it reverses with a bigger candle in the opposite direction.
Statistics to prove if the Doji Star pattern really works
Are the odds of the Doji Star pattern in your favor?
How does the Doji Star behave with a 2:1 target R/R ratio?
From our research the Doji Star pattern confirms 47.2% of the time on average overall all the 4120 markets we analysed. Historically, this patterns confirmed within 3.8 candles or got invalidated within 4.2 candles. If confirmed, it reached the 2:1 R/R target 41.3% of the time and it retested it's entry price level 89.2% of the time.
Not accounting for fees, it has an expected outcome of 0.238 $/$.
It means for every $100 you risk on a trade with the Doji Star pattern you make $23.8 on average.
Want to account for your trading fees? Have the detailled stats for your favorite markets / timeframes? Or get the stats for another R/R than 2:1?
🚀 Join us now and get fine-tuned stats you care about!
How to handle risk with the Doji Star pattern?
We analysed 4120 markets for the last 59 years and we found 107 185 occurrences of the Doji Star pattern.
On average markets printed 1 Doji Star pattern every 146 candles.
For 2:1 R/R trades, the longest winning streak observed was 11 and the longest losing streak was 18. A trading strategy relying solely on this pattern is not advised. Anyway, make sure to use proper risk management.
Keep in mind all these informations are for educational purposes only and are NOT financial advice.
If you want to learn more and deep dive into candlestick patterns performance statistics, I strongly recommend you follow the best available course about it. Joe Marwood (who's a famous trader with more than 45 000 Twitter followers) created an online course called "Candlestick Analysis For Professional Traders" in his Marwood Research University. There he will take you through the extensive backtesting of the 26 main candlestick patterns. He then summarizes which one is THE best pattern. Do you know which one it is?
Remember, don't trade if you don't know your stats. Click here to signup to the course now!
Bullish Doji Star candlestick pattern
What is it?
The bullish Doji Star pattern is a three-bar formation pattern that develops during a downtrend. The first bar has a long black body, the second bar opens even lower. It closes just like a Doji pattern with a small range of trading. The third bar closes above the midpoint.
Technical analysts use bullish Doji Star candlestick to determine the reversal of the long current downtrend in the market. The experts consider bullish Doji Star Patterns as signals to buy. They also use it to watch time to avoid selling the assets. It mostly appears at the bottom of the chart. This act as a bell to inform that arrival of the bulls is imminent after a long bearish phase.
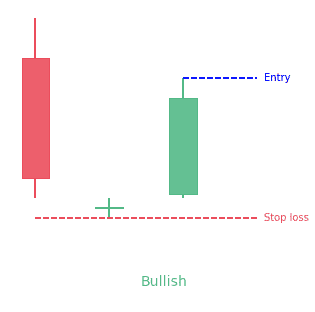
How to identify the bullish Doji Star candlestick?
- Look for a normal red candlestick on the very bottom of the charts on the first day. If confirms the prevalent downtrend and also illustrates that price closed lesser than the opening price.
- Next, look for a small Doji on the second day showing that there is very minimal or no gap at all between opening and closing prices.
- Now look for the third candlestick showing a gap up opening.
How to trade the bullish Doji Star pattern?
You should think about initiating a trade on the long side while keeping a stop loss just to be at the safe side if prices start to move in the opposite direction. You may also try to check 5 minutes and 15 minutes timeframes to analyze this pattern and take your guards accordingly. After the formation of the bullish Doji Star pattern, prices begin to move up. Therefore, if you initiate trade after confirmation of this pattern, there are strong chances that you will be able to gain profit.
Bearish Doji Star candlestick pattern
What is it?
The bearish Doji Star candlestick is a bearish reversal pattern appearing during an uptrend. It is represented by two lines. The first candle has a long body due to increase during an uptrend. Afterward, a Doji is formed that particularly opens and closes above the first candle.
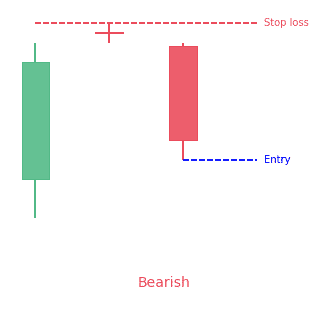
How to identify a bearish Doji Star candlestick?
You should look for a candlestick with a long white line and a Doji that is above that first candle. You should also remember that the shadow of the Doji will not be too long and the shadows of the line do not overlap. Hence, these hints make it easy to identify a bearish Doji Star candlestick pattern.
How to trade a bearish Doji Star pattern?
A bearish Doji Star is a signal that shows the end of an uptrend and start of a bearish reversal leading to decreasing the prices. Therefore, it is a wise move to sell the stock whenever a bearish Doji Star pattern appears.
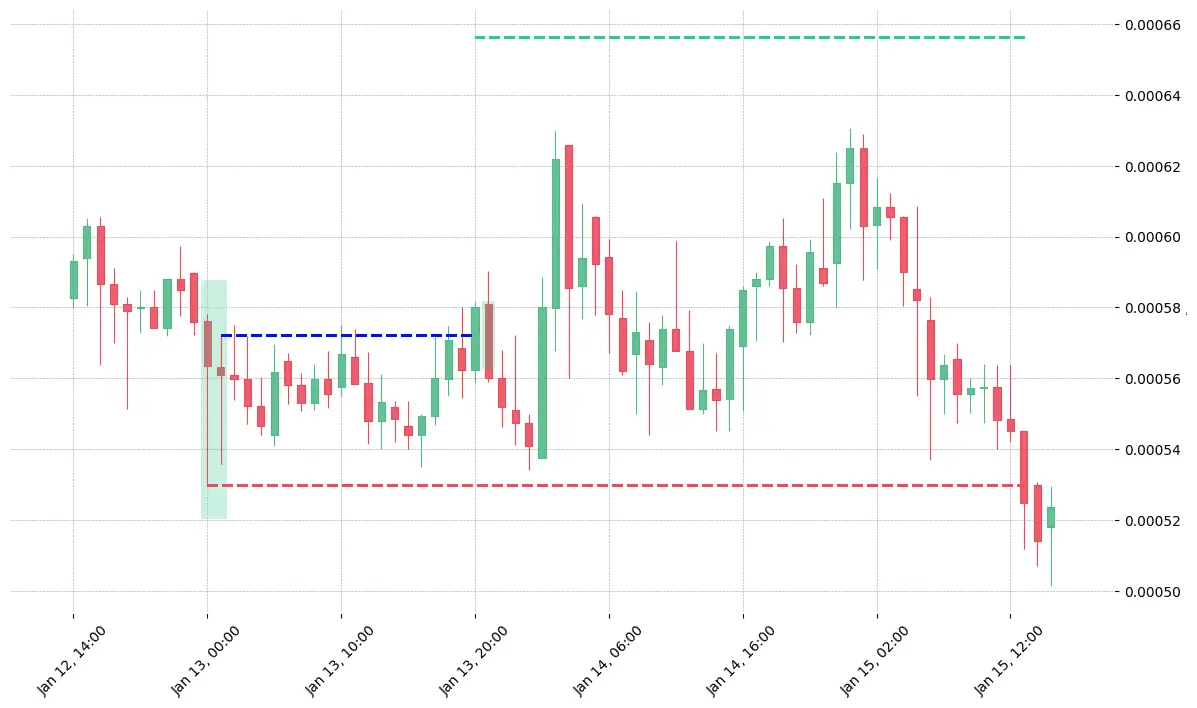
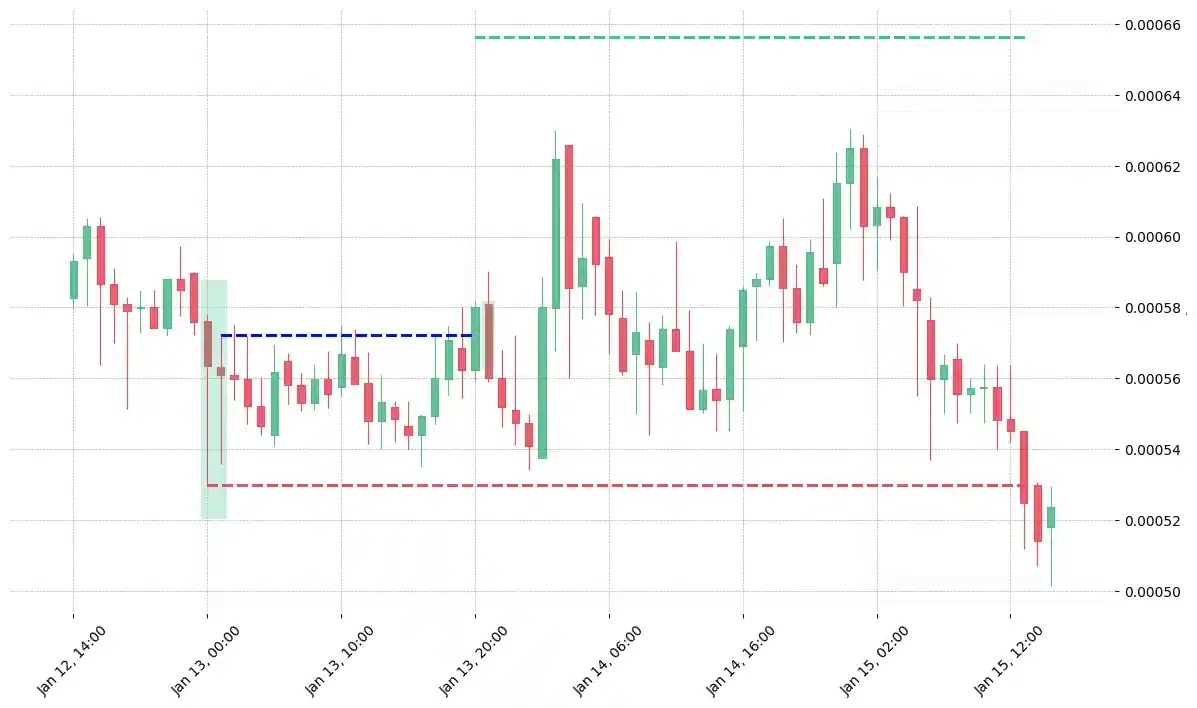
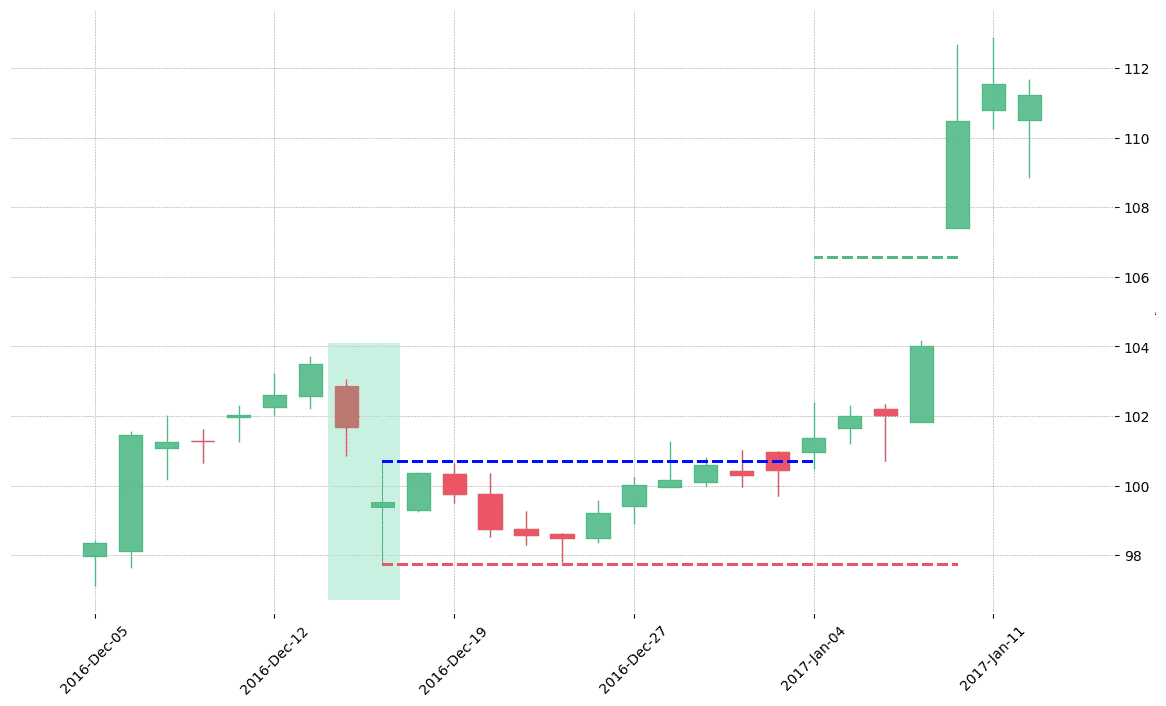
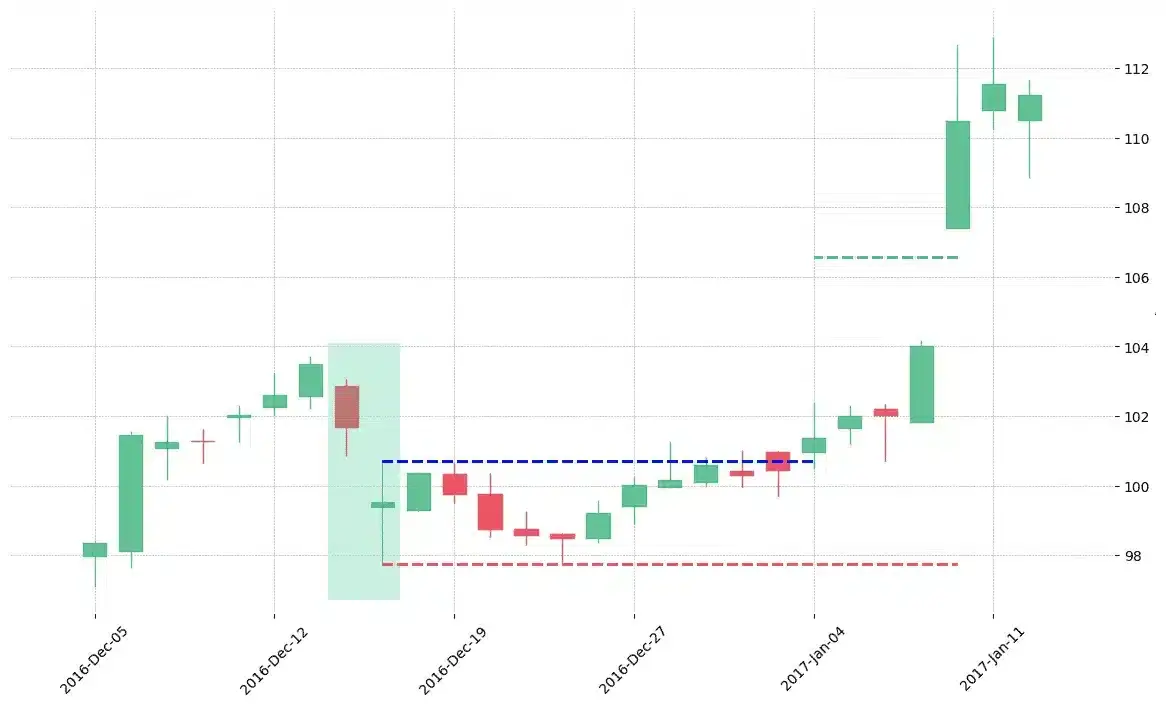
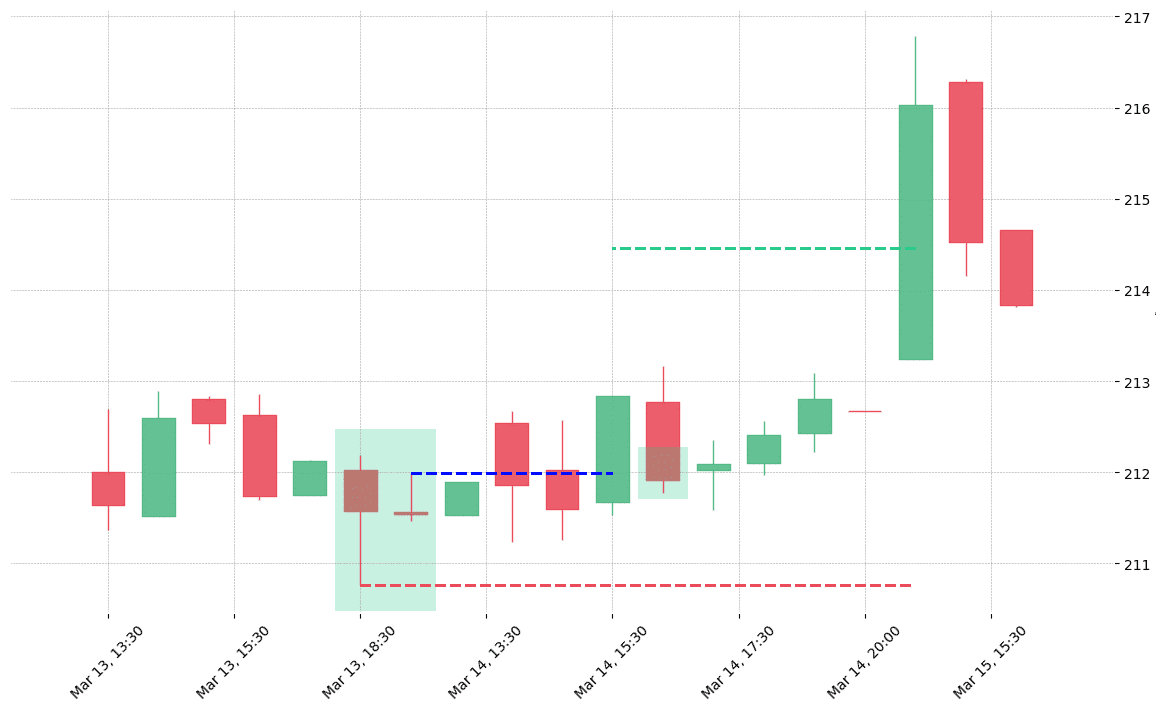
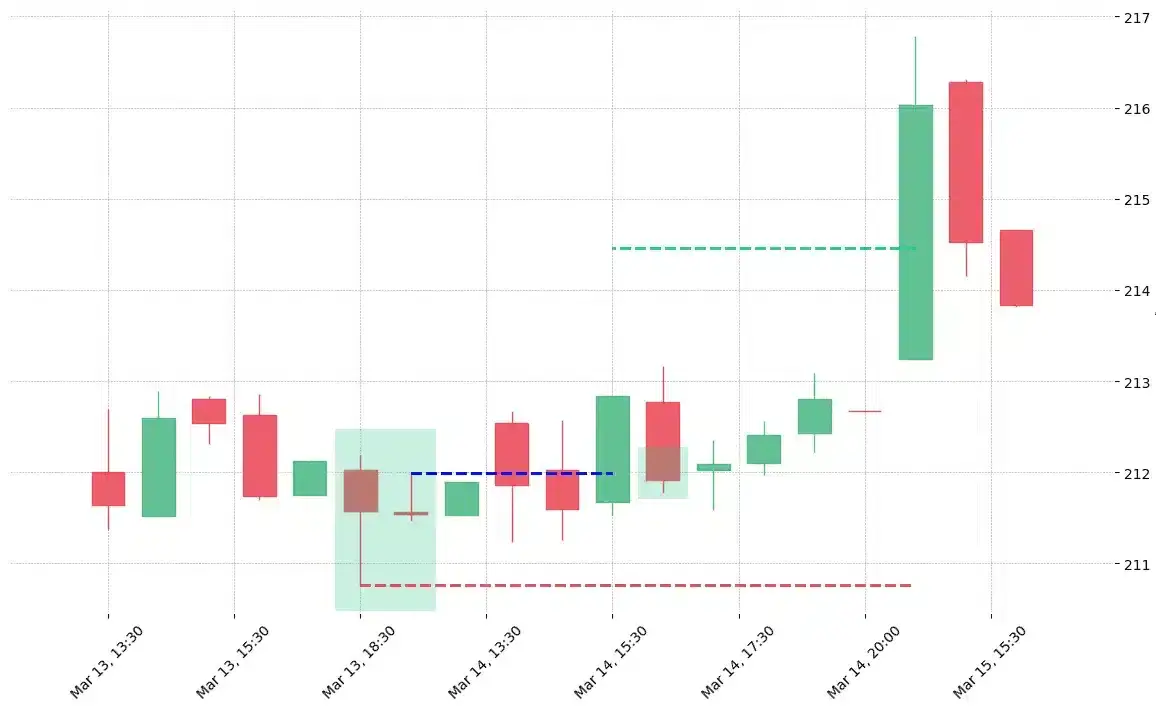
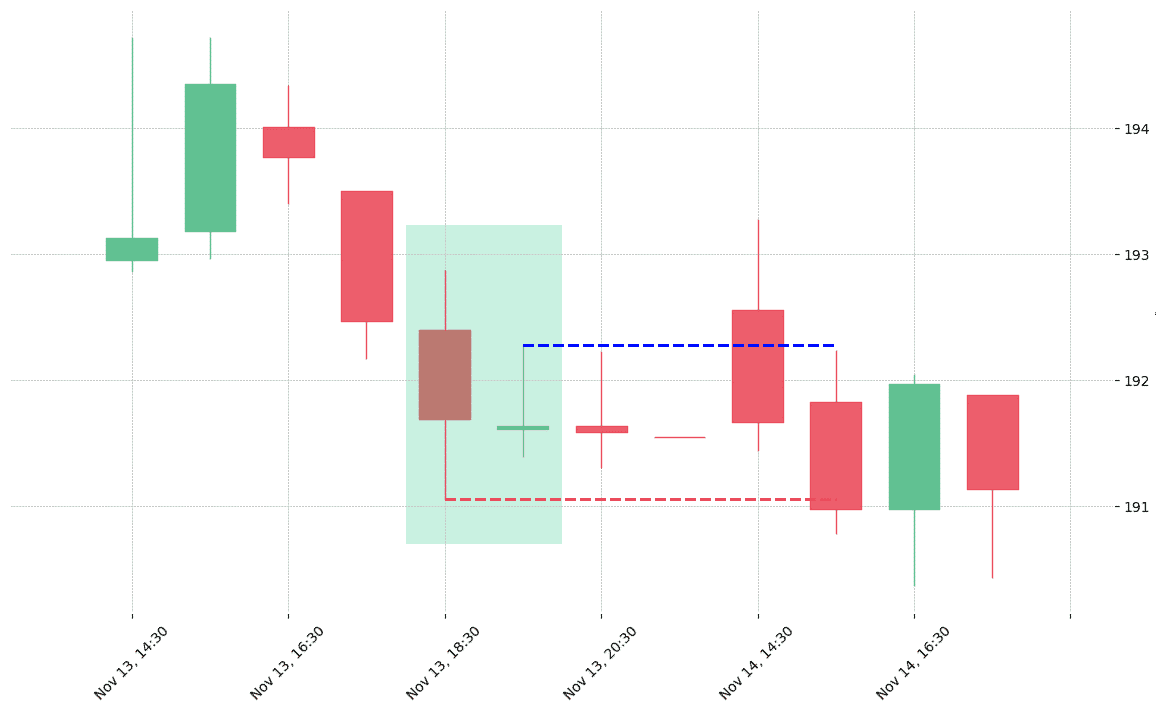
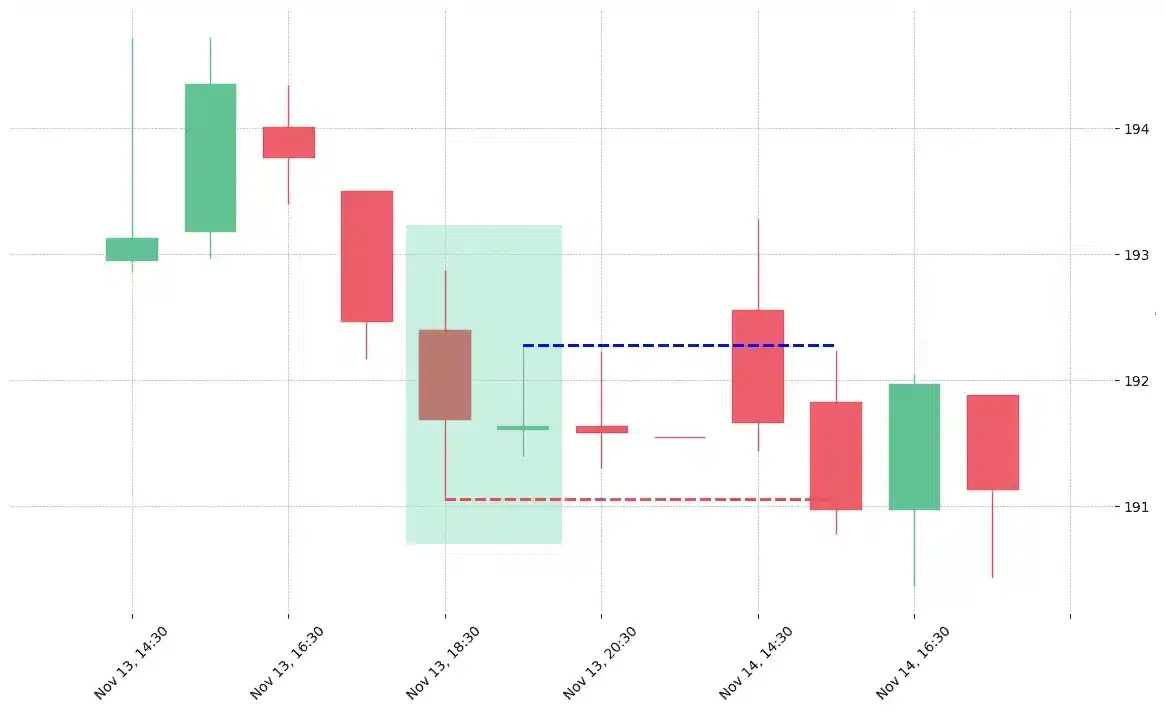
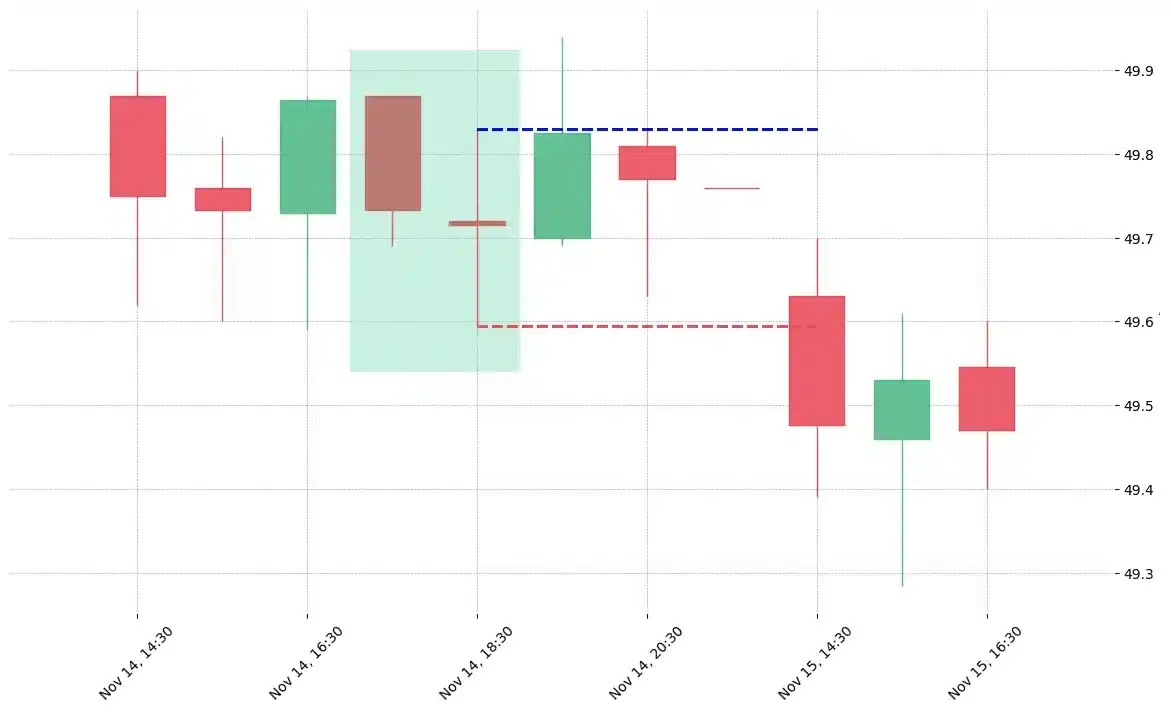
How does the Doji Star pattern look in real life?

Looking to learn more about this pattern?
You should take a look at Joe Marwood's online course. In his course, he backtested the 26 main candlestick patterns before to summarize which one is THE best pattern. I really liked his course and you shouldn't miss it!
Click here to signup to his "Candlestick Analysis For Professional Traders" course now!


 We loved Marwood Research’s course “Candlestick Analysis For Professional Traders“. Do you want to follow a great video course and deep dive into 26 candlestick patterns (and compare their success rates)? Then make sure to check this course!