
 Good Trading requires the Best Charting Tool!
- The concealing baby swallow candlestick pattern is a 4-bar bullish reversal pattern.
- The first candle must be a Marubozu which appears during a trend.
- The second candle must also be a same color Marubozu. It opens within the body of the previous candle and closes out of the previous closing price.
- The first two candles are without any upper or lower shadow.
- The third candle must be a High Wave without a lower shadow. It opens out the previous closing price while its shadow enters the body of the previous candle.
- The fourth candle must engulf the body and shadow of the previous candle.
Statistics to prove if the Concealing Baby Swallow pattern really works
Are the odds of the Concealing Baby Swallow pattern in your favor?
How does the Concealing Baby Swallow behave with a 2:1 target R/R ratio?
From our research the Concealing Baby Swallow pattern confirms 22.9% of the time on average overall all the 4120 markets we analysed. Historically, this patterns confirmed within 4.6 candles or got invalidated within 4.5 candles. If confirmed, it reached the 2:1 R/R target 50% of the time and it retested it's entry price level 90.9% of the time.
Not accounting for fees, it has an expected outcome of 0.5 $/$.
It means for every $100 you risk on a trade with the Concealing Baby Swallow pattern you make $50 on average.
Want to account for your trading fees? Have the detailled stats for your favorite markets / timeframes? Or get the stats for another R/R than 2:1?
🚀 Join us now and get fine-tuned stats you care about!
How to handle risk with the Concealing Baby Swallow pattern?
We analysed 4120 markets for the last 59 years and we found 48 occurrences of the Concealing Baby Swallow pattern.
On average markets printed 1 Concealing Baby Swallow pattern every 325 045 candles.
For 2:1 R/R trades, the longest winning streak observed was 3 and the longest losing streak was 2. A trading strategy relying solely on this pattern is not advised. Anyway, make sure to use proper risk management.
Keep in mind all these informations are for educational purposes only and are NOT financial advice.
If you want to learn more and deep dive into candlestick patterns performance statistics, I strongly recommend you follow the best available course about it. Joe Marwood (who's a famous trader with more than 45 000 Twitter followers) created an online course called "Candlestick Analysis For Professional Traders" in his Marwood Research University. There he will take you through the extensive backtesting of the 26 main candlestick patterns. He then summarizes which one is THE best pattern. Do you know which one it is?
Remember, don't trade if you don't know your stats. Click here to signup to the course now!
The concealing baby swallow candlestick pattern is a bullish reversal pattern that appears during a downtrend. It consists of four candlesticks that give an early signal of downtrend’s deterioration. The logic behind this pattern is that bulls respond very quickly to the first two candles occurring during a downtrend. After the first two candles, the buying pressure increases, and prices reject to decline. It results in the formation of a long bullish candle that indicates an upcoming reversal of the trend. The concealing baby swallow is a very rare but reliable trading pattern. Although it is a bit tricky to identify the concealing baby swallow, it is a very important pattern that not only tell traders about trend reversal but also shed light on the overall behavior of the market.
How to identify the concealing baby swallow candlestick pattern?
The concealing baby swallow pattern is a four-bar pattern that only occurs during a downtrend. A pattern needs to meet the following conditions to be a concealing baby swallow pattern.
- The first candle must be a Black Marubozu appearing during a downtrend.
- The second candle must also be a Black Marubozu. It opens within the body of the previous candle and closes below the previous closing price.
- The first two candles are without any upper or lower shadow.
- The third candle must be a High Wave without a lower shadow. It opens below the previous closing price while its upper shadow enters the body of the previous candle.
- The fourth candle must have a black body engulfing the body and upper shadow of the previous candle.
What does the concealing baby swallow candlestick pattern tell traders?
The concealing baby swallow candlestick pattern tells traders about an upcoming reversal of the trend in the market. The concealing baby swallow pattern gives early signals of bearish losing control and deterioration of the downtrend. The first two candles of the concealing baby swallow indicate the control of the bears in the market and the selling pressure.
However, the third day’s candle creates a downtrend gap. Although the third candle overlaps to some extent with the second candle but prices close at a new low. The third day also trades up into the trading range of the prior day. The volume remains very high during the third day.
The fourth candle opens higher again which raises concerns for the bears and the market participants got rid of their long positions. The fifth white candle after the appearance of the concealing baby swallow candlestick pattern provides confirmation.
The confirmation of the concealing baby swallow pattern allows traders to take a long position. Although the concealing baby swallow is a pattern with very high probability, it is always a prudent strategy to enter a trade with stop-loss. The traders should place stop-loss below the lower shadow of the fourth candlestick. It is important to note that traders should enter a trade only after the confirmation provided by the candle appearing on the fifth day.
The concealing baby swallow is one of the most reliable patterns but it is important to identify the pattern correctly and devise trading strategies only after the confirmation.
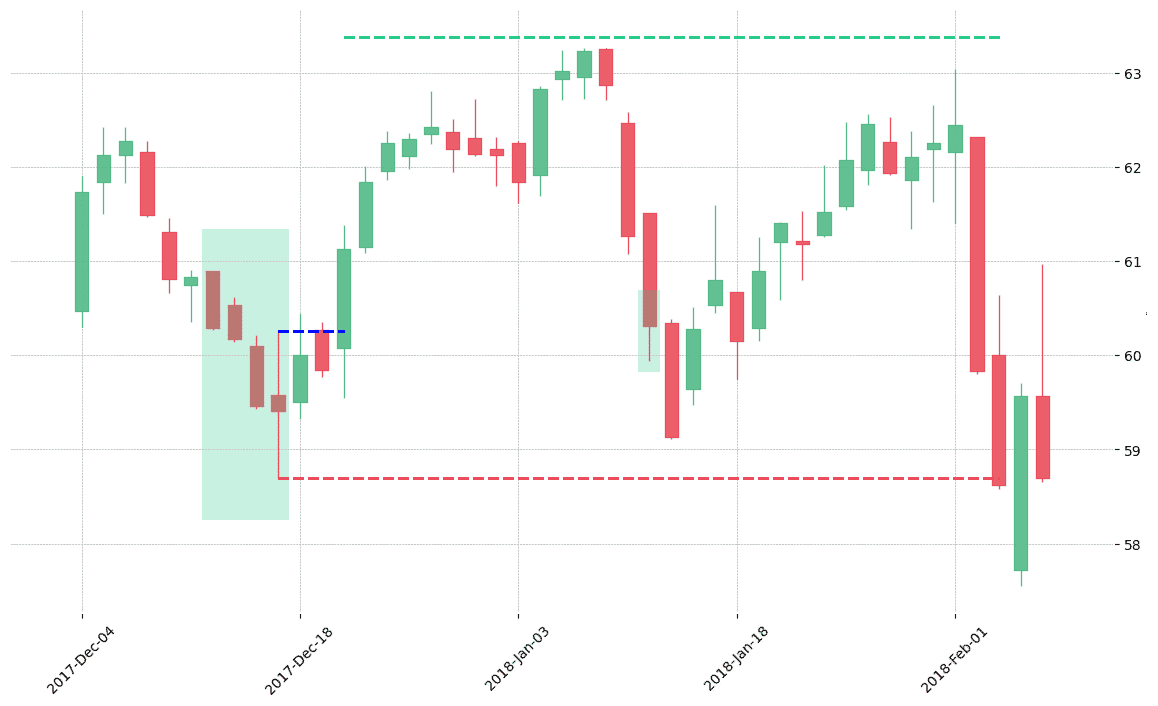
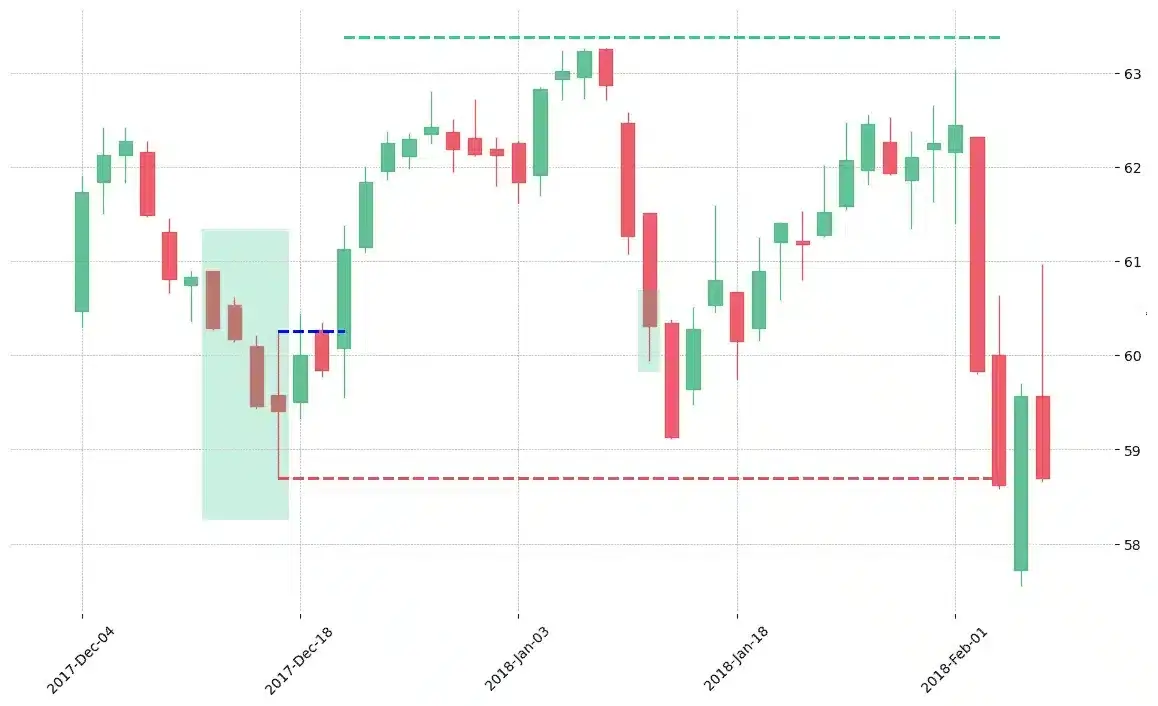
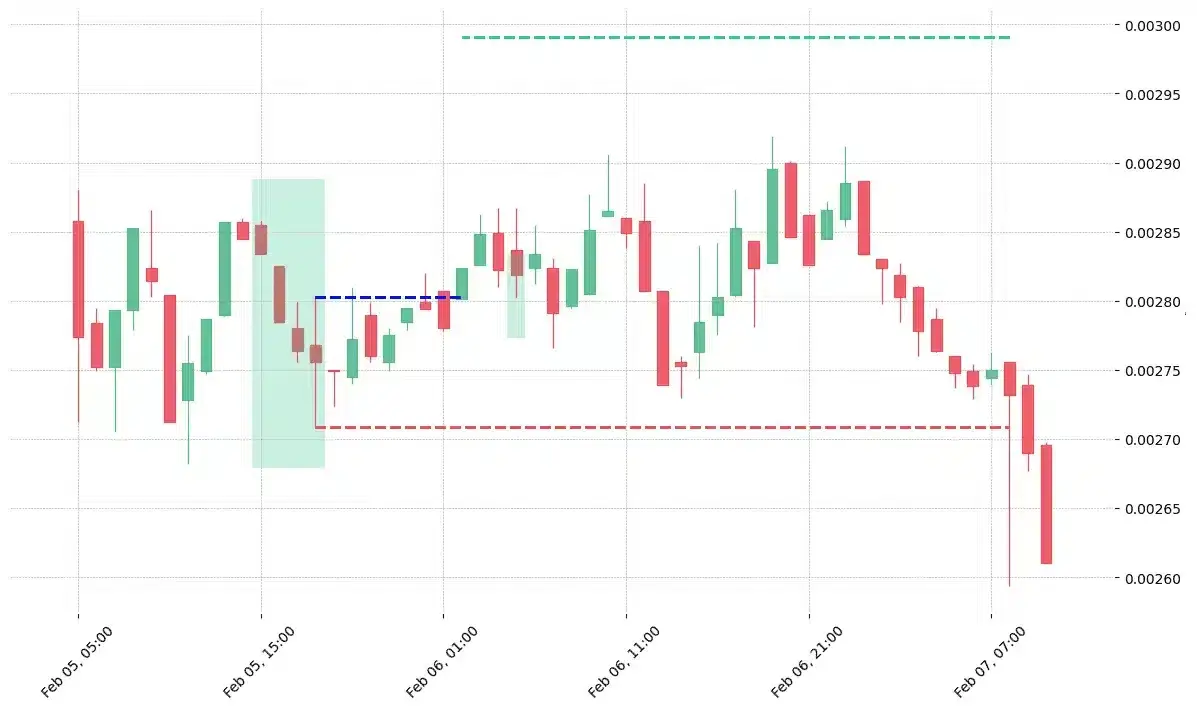
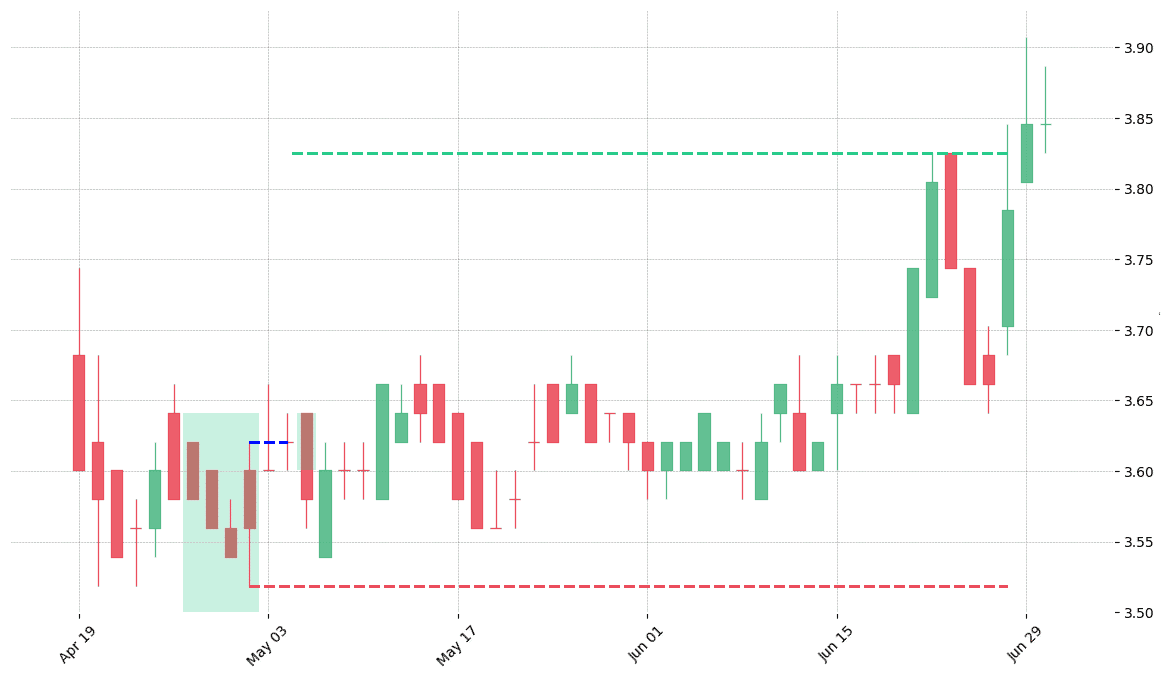
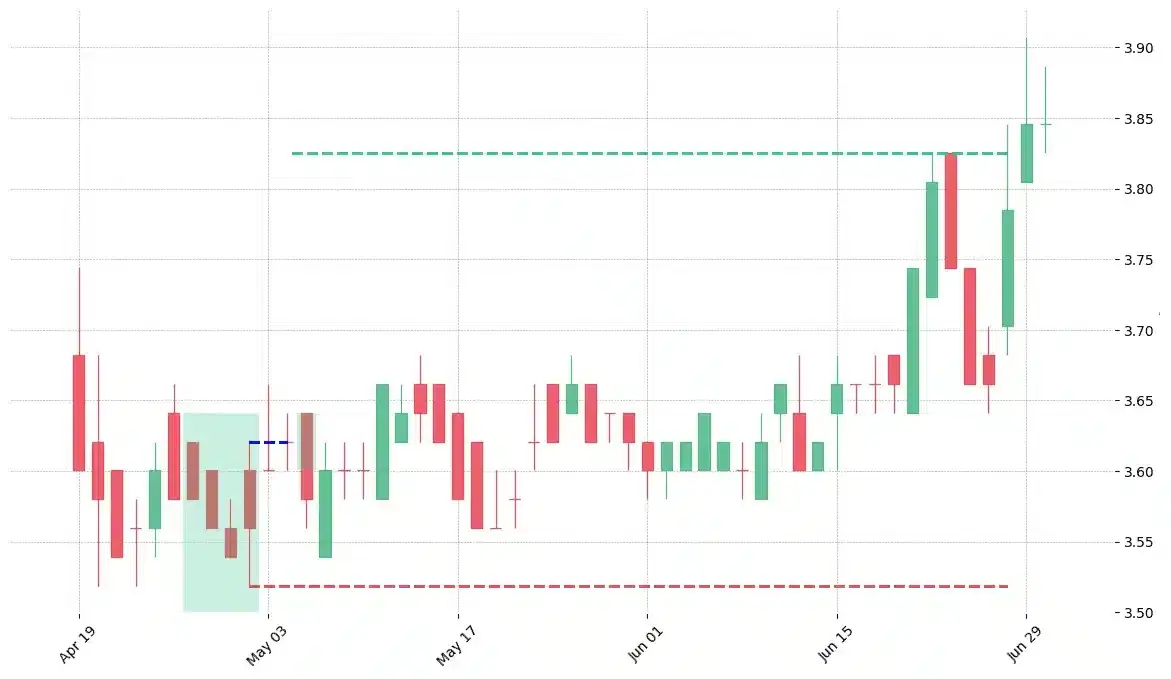
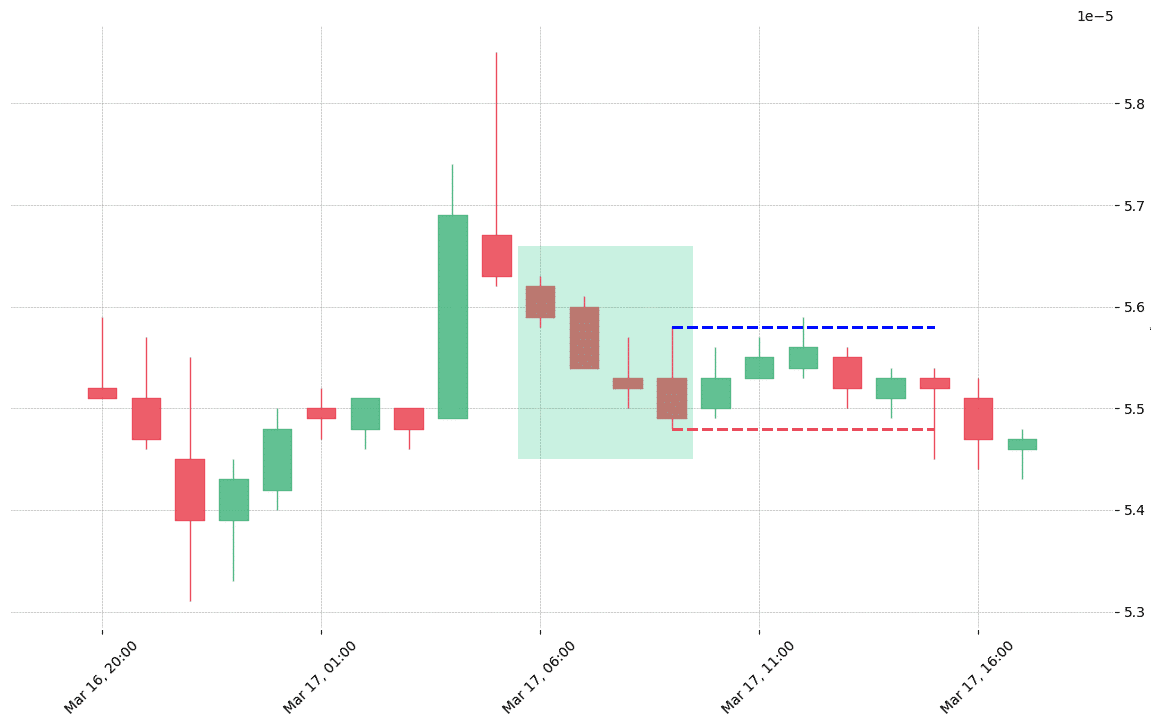
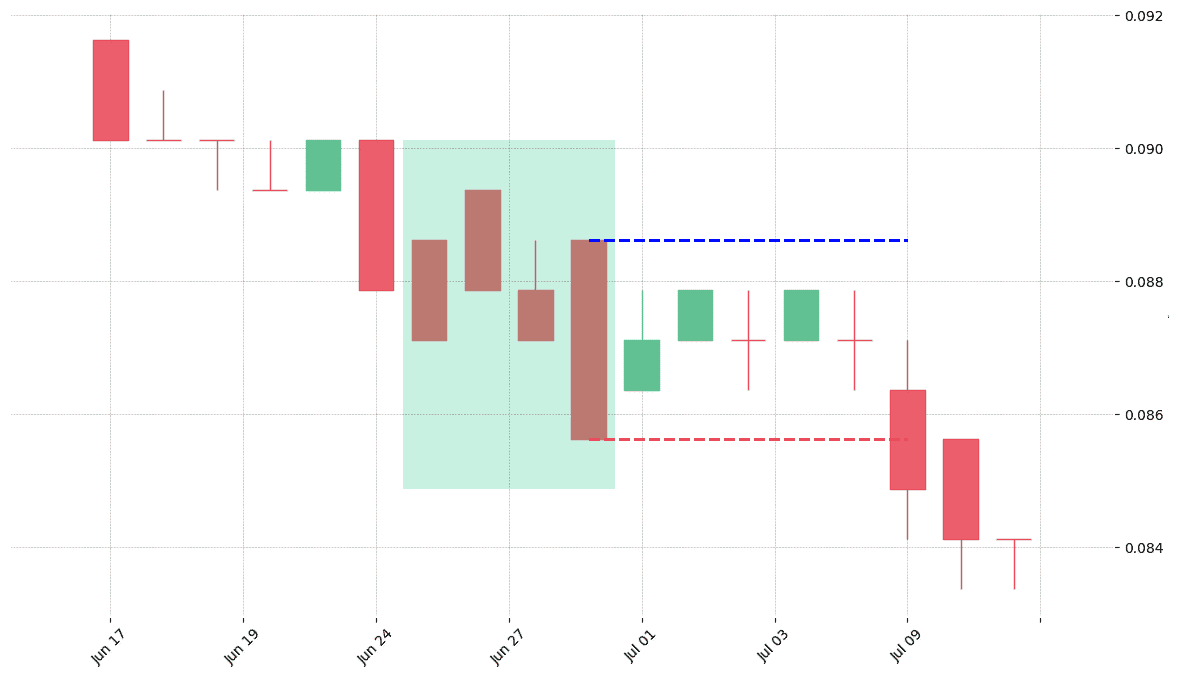
How does the pattern look in real life?


Looking to learn more about this pattern?
You should take a look at Joe Marwood's online course. In his course, he backtested the 26 main candlestick patterns before to summarize which one is THE best pattern. I really liked his course and you shouldn't miss it!
Click here to signup to his "Candlestick Analysis For Professional Traders" course now!


 We loved Marwood Research’s course “Candlestick Analysis For Professional Traders“. Do you want to follow a great video course and deep dive into 26 candlestick patterns (and compare their success rates)? Then make sure to check this course!