
 Good Trading requires the Best Charting Tool!
- The Closing Marubozu is a 1-bar continuation candlestick pattern.
- It’s a long candle close at it’s high (bullish) or low (bearish).
Statistics to prove if the Closing Marubozu pattern really works
Are the odds of the Closing Marubozu pattern in your favor?
How does the Closing Marubozu behave with a 2:1 target R/R ratio?
From our research the Closing Marubozu pattern confirms 85.8% of the time on average overall all the 4120 markets we analysed. Historically, this patterns confirmed within 0.9 candles or got invalidated within 4.4 candles. If confirmed, it reached the 2:1 R/R target 31.8% of the time and it retested it's entry price level 98.4% of the time.
Not accounting for fees, it has an expected outcome of -0.047 $/$.
It means for every $100 you risk on a trade with the Closing Marubozu pattern you lose $4.7 on average.
Want to account for your trading fees? Have the detailled stats for your favorite markets / timeframes? Or get the stats for another R/R than 2:1?
🚀 Join us now and get fine-tuned stats you care about!
How to handle risk with the Closing Marubozu pattern?
We analysed 4120 markets for the last 59 years and we found 1 055 972 occurrences of the Closing Marubozu pattern.
On average markets printed 1 Closing Marubozu pattern every 15 candles.
For 2:1 R/R trades, the longest winning streak observed was 15 and the longest losing streak was 505. A trading strategy relying solely on this pattern is not advised. Anyway, make sure to use proper risk management.
Keep in mind all these informations are for educational purposes only and are NOT financial advice.
If you want to learn more and deep dive into candlestick patterns performance statistics, I strongly recommend you follow the best available course about it. Joe Marwood (who's a famous trader with more than 45 000 Twitter followers) created an online course called "Candlestick Analysis For Professional Traders" in his Marwood Research University. There he will take you through the extensive backtesting of the 26 main candlestick patterns. He then summarizes which one is THE best pattern. Do you know which one it is?
Remember, don't trade if you don't know your stats. Click here to signup to the course now!
What is the Closing Marubozu candlestick pattern?
The closing marubozu candlestick pattern is one of the most important single candle patterns. The closing marubozu pattern signals on the basis of just one day’s trading action. There are two types of closing marubozu pattern.
- The bullish closing marubozu candlestick pattern forms when the open price is the low price and the close price is the high price of the day. It indicates the powerful bullish market forces that keep the buying momentum going and bulls continue to buy at every price during the whole trading session. The white closing marubozu is another name for this formation.
- The bearish closing marubozu candlestick pattern forms when the open price is the high price and the close price is the low price of the day. It indicates the powerful bearish market marked by selling during the whole trading session. The black closing marubozu is another name for this formation.
The formation of a closing marubozu pattern on a daily or weekly chart is an extremely rare phenomenon. However, during periods of volatility and strong movements, it can be easily observed. It also describes that the market participants maintain the sentiments throughout the trading session until the last moment just like the prices that maintain their movements in a single direction.
How to identify the closing marubozu candlestick pattern?
The closing marubozu candlestick pattern is comparatively easy to identify because it is a single candle pattern. Its name is derived from the Japanese word “marubozu” which means “bald-headed”. It signifies that the body of the candle does not have upper or lower shadow (or a small shadow visible on the trading charts). It has a long real body that makes it easy to identify. Moreover, continuation price candles must agree with the trend direction indicated by the closing marubozu pattern. This pattern forms only when all these conditions are met.
What does this pattern tell traders?
The closing marubozu candlestick pattern is popular for powerful signals that show that the market trend is in one direction. In both of the bullish or bearish marubozu patterns, either of the sides remains so strong that one completely overpowers the other one. The bullish closing marubozu pattern suggests that the buyers were in complete control of the market. They maintained the buying pressure throughout the trading session.
If the candle appears near the support or resistance levels, the closing marubozu pattern becomes more interesting. It’s because it can open on one side and close on the other further adding to the current trend. Moreover, the closing marubozu can appear anywhere on the trading charts. Though it is the most powerful when they follow a period marked by sideways trading activity. The trading strategies will differ based on the type of closing marubozu pattern. Traders can place stop-loss at high or low of the candle.
Although the marubozu is a very strong pattern but it may give false signals such as signals associated with an extremely small or large candlestick. The small stick exhibits a reduced trading activity and the large one shows extensive trading. Both of these candlesticks may generate false signals. Moreover, it is necessary to look for further confirmation. Entering a trade on the basis of the closing marubozu pattern alone is not adviced.
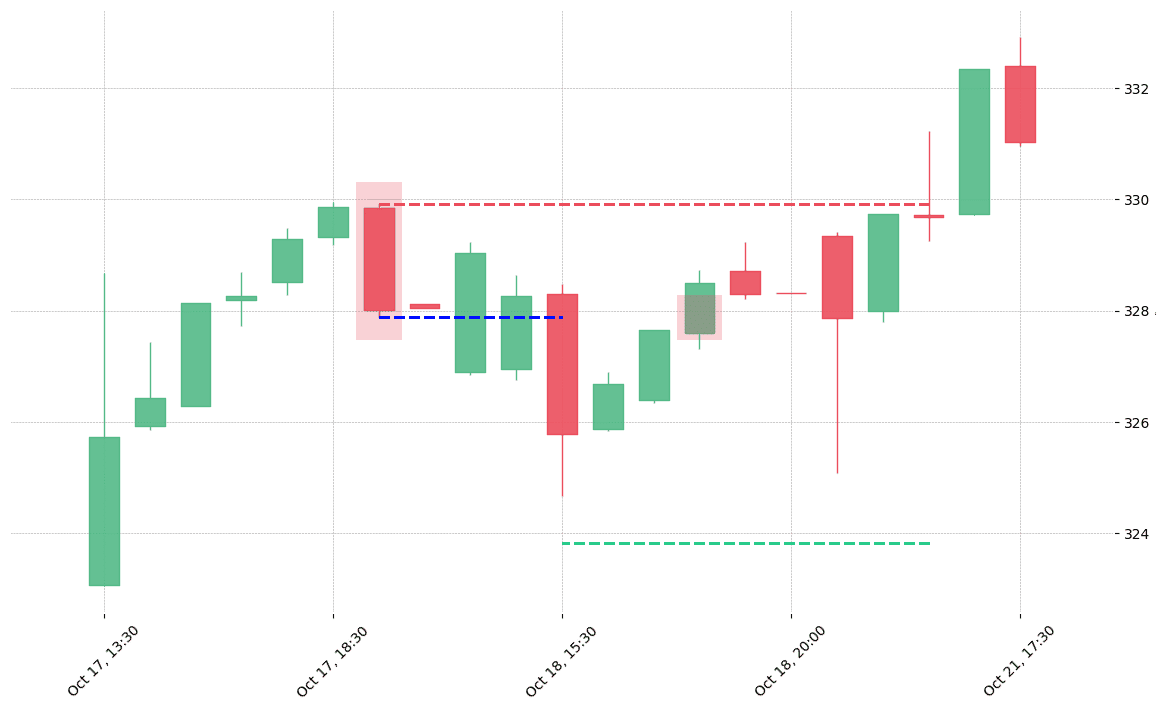
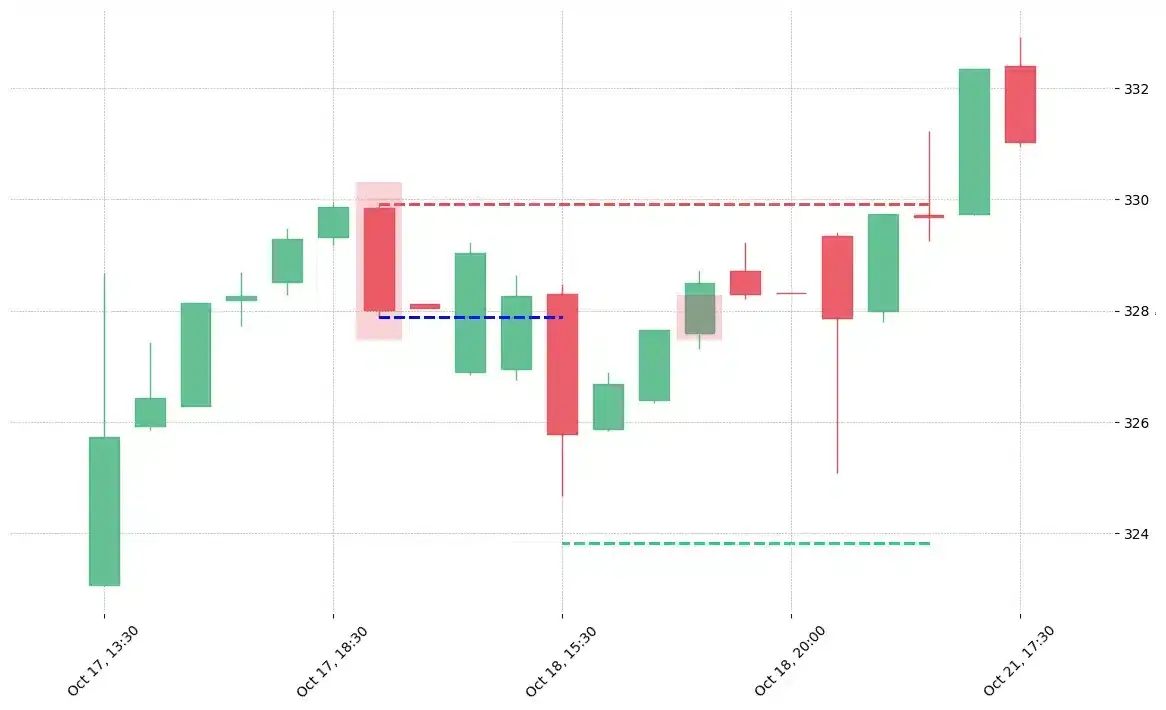
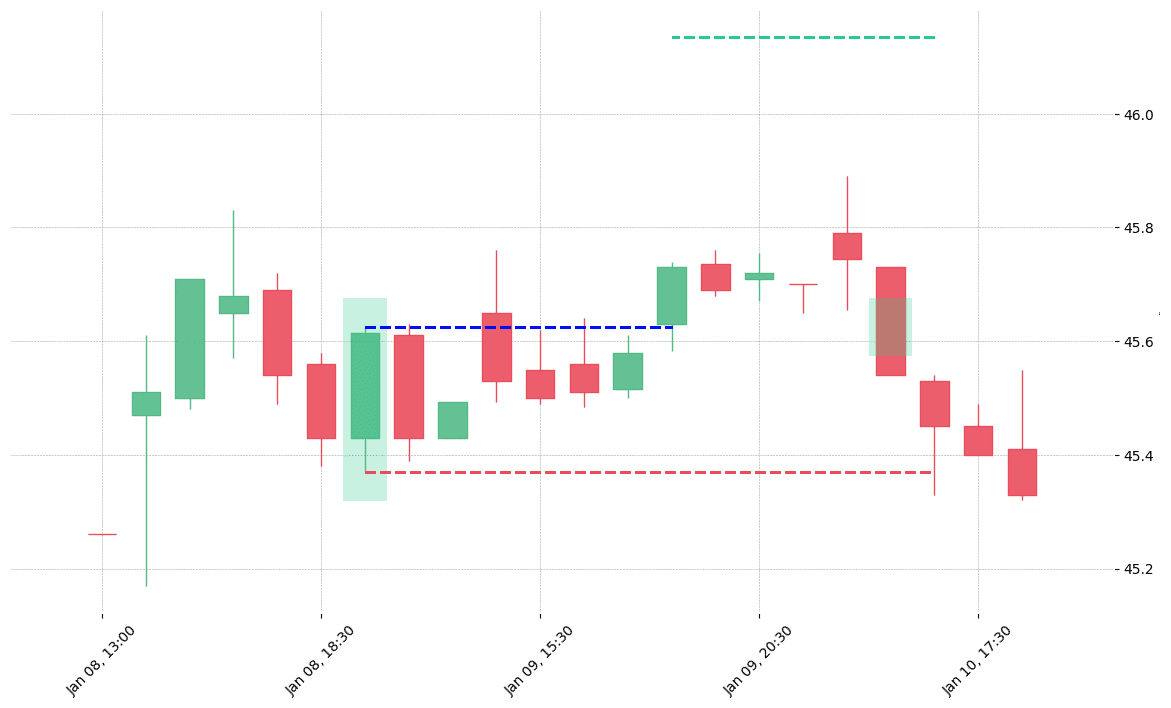
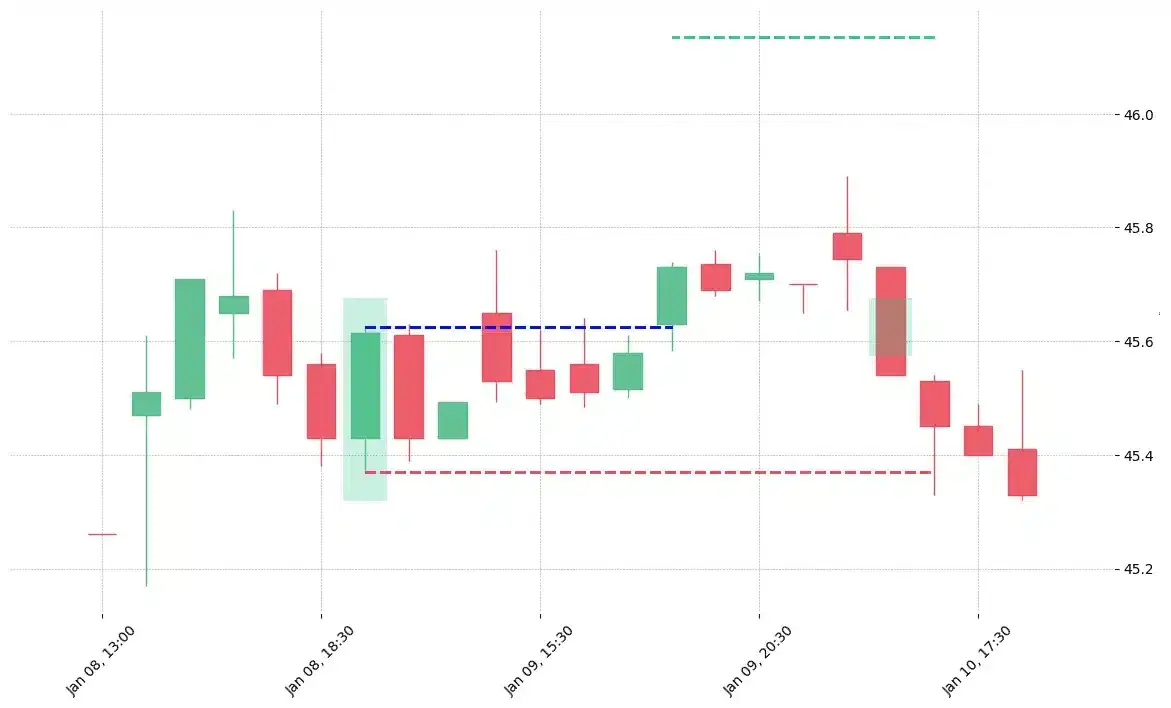
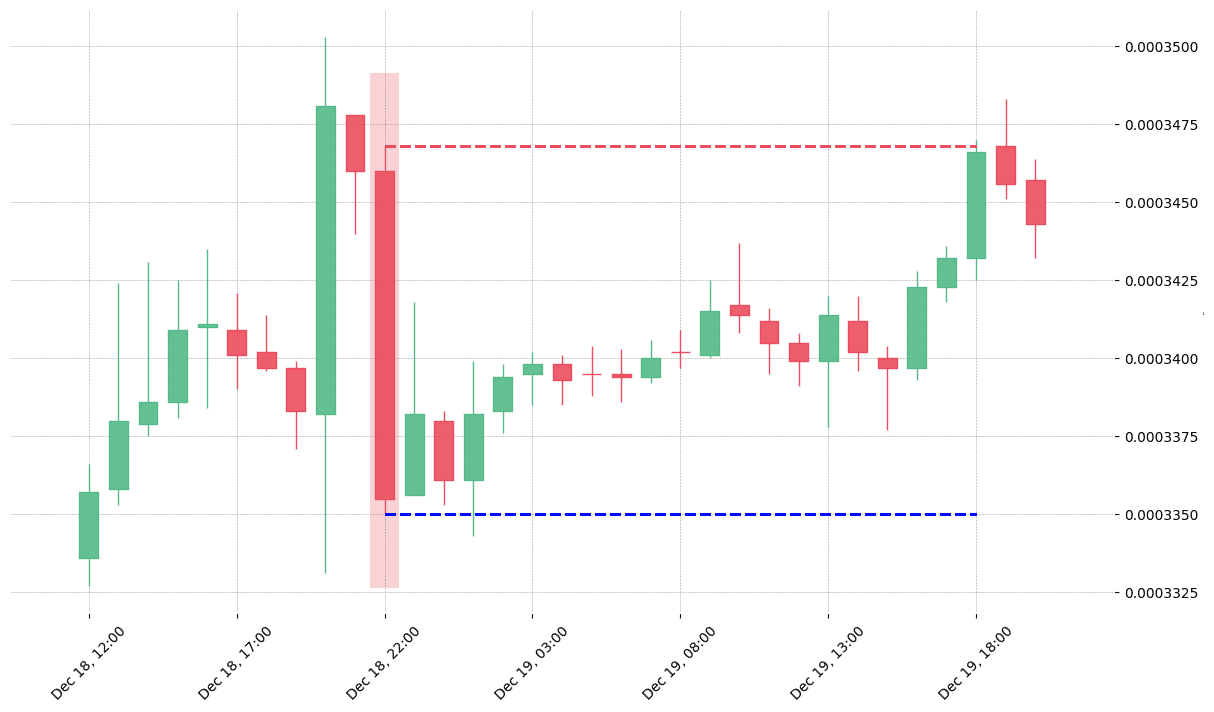
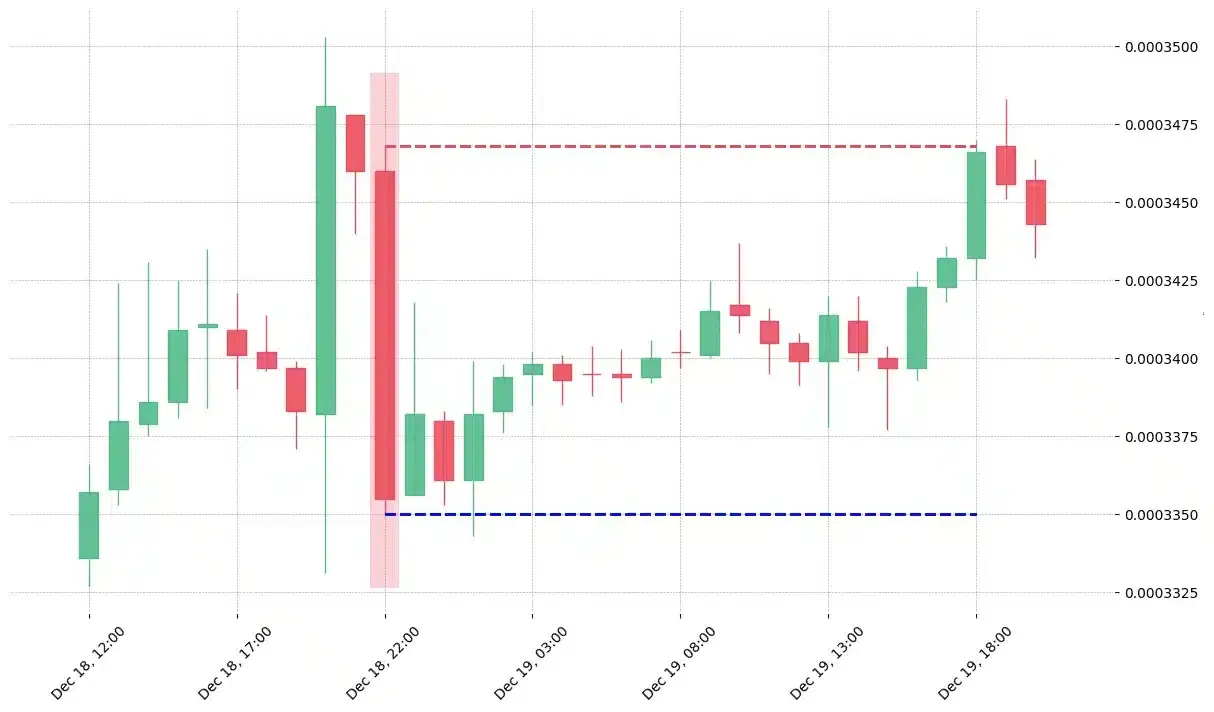
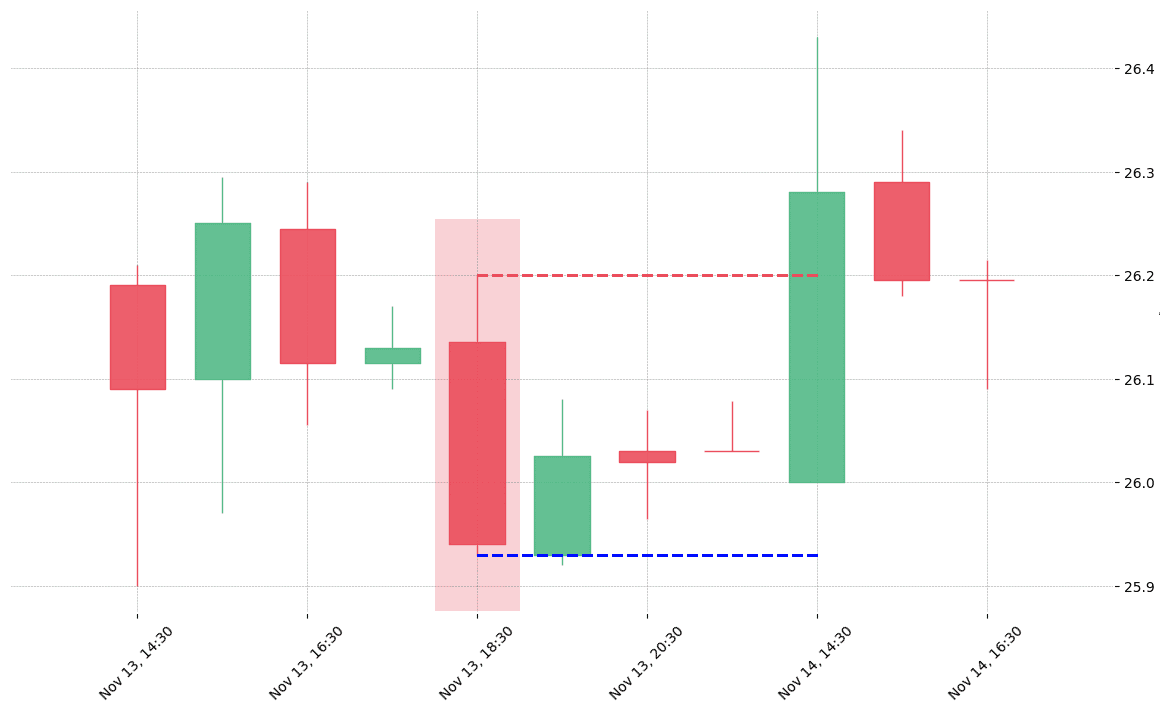
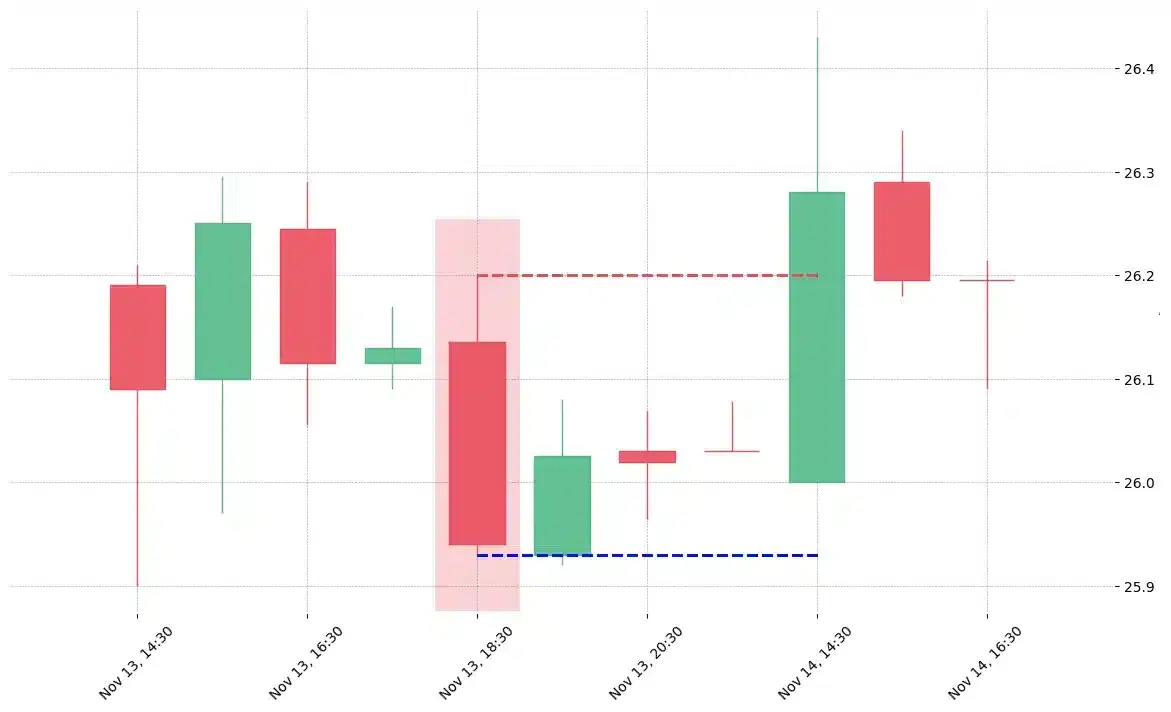
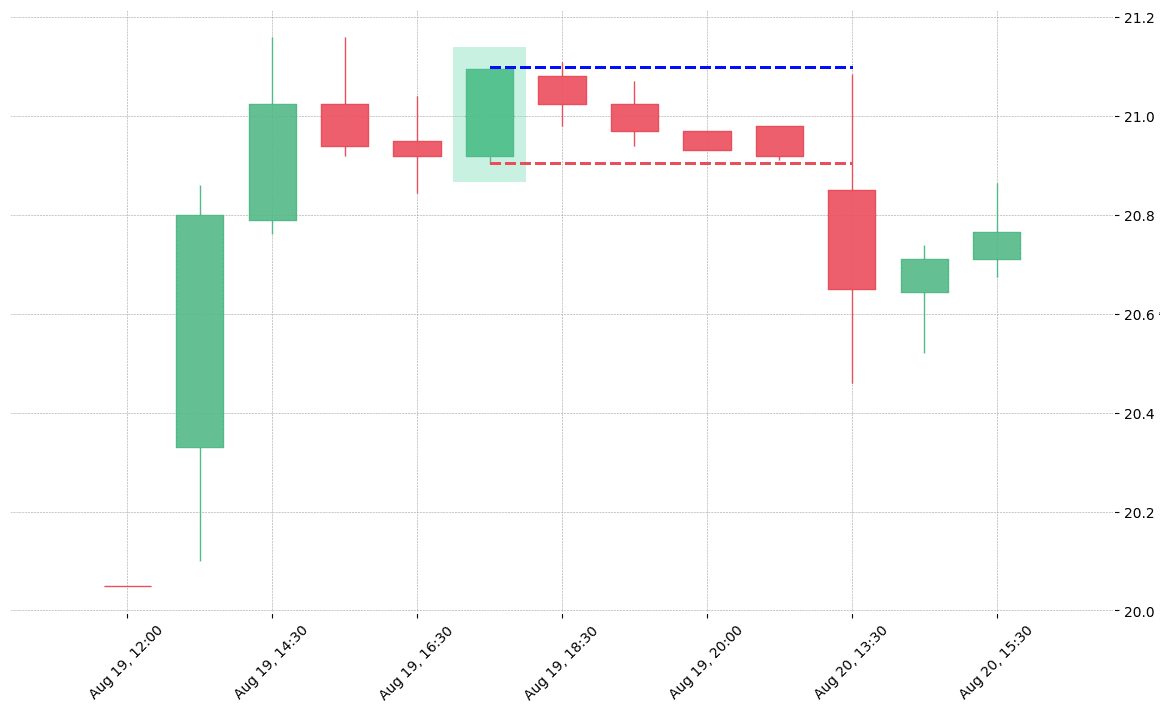
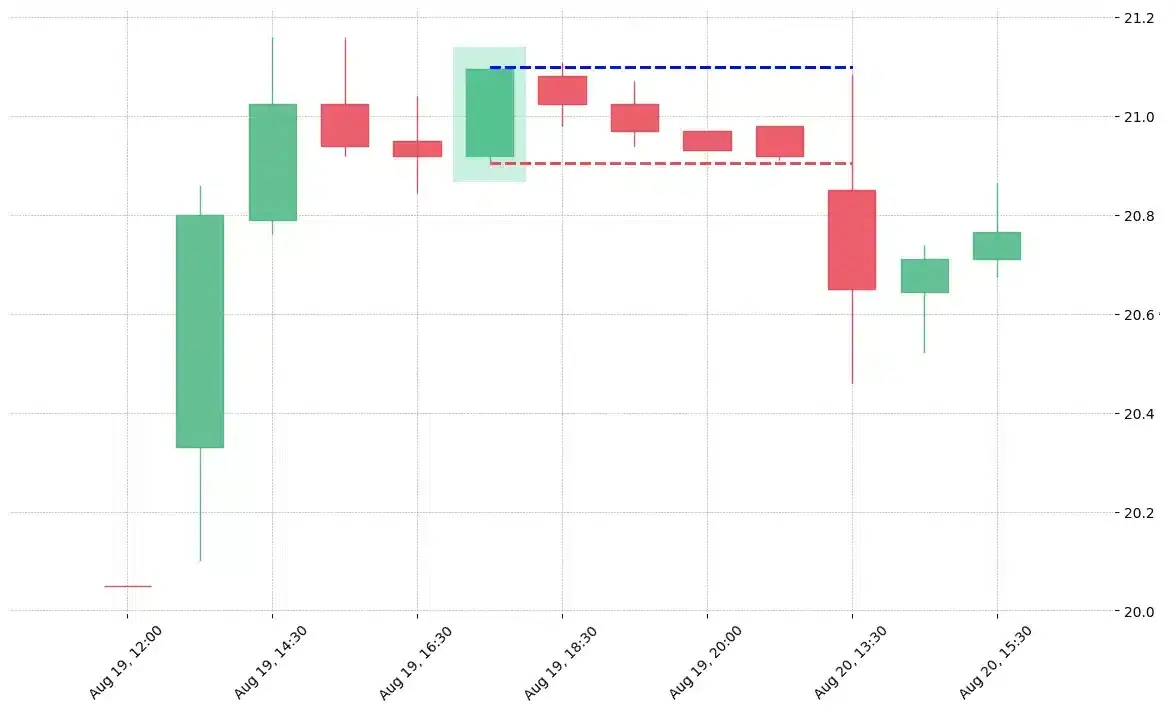
How does the Closing Marubozu pattern look in real life?
Looking to learn more about this pattern?
You should take a look at Joe Marwood's online course. In his course, he backtested the 26 main candlestick patterns before to summarize which one is THE best pattern. I really liked his course and you shouldn't miss it!
Click here to signup to his "Candlestick Analysis For Professional Traders" course now!


 We loved Marwood Research’s course “Candlestick Analysis For Professional Traders“. Do you want to follow a great video course and deep dive into 26 candlestick patterns (and compare their success rates)? Then make sure to check this course!