
 Good Trading requires the Best Charting Tool!
When you decide to trade, the secret to becoming successful is in reading patterns. Harmonic price patterns take geometric price patterns to the next level by applying Fibonacci numbers to define specific turning points. Unlike other more trading processes, this pattern tries to predict future price movements. In this article, we’ll go into details of the Butterfly harmonic pattern.
Harmonic patterns are becoming more popular in the world of trading. They are internal or external patterns. Internal patterns include structures such as the Gartley and bat. External patterns are made up of structures like the butterfly and crab.
Although there are many harmonic patterns, butterfly patterns remain the most prominent. Helping traders get a complete understanding of what they are, how they work, and how to make use of them, the following is a comprehensive breakdown of butterfly patterns.
- The Butterfly pattern is a harmonic reversal pattern.
- It follows specific fibonacci ratios (which you can see in the structure part below)
Interested in learning more about harmonics pattern in general?
You’ll love this two courses I shortlisted for you on Udemy:
- Forex Harmonic Pattern Trading – With Multiple Chart Examples: it’ll teach you step-by-step how to identify most harmonic pattern applied to forex markets.
- Harmonic Trading: The Art Of Trading With Low Risk: it’ll guide you to your first harmonic trades, what are potential reversal zones and it’ll give you practical applications so you can truly understand how to use it and manage your risks.
If you prefer to skip the learning part and are just looking for a harmonic patterns scanner, you might want to check this harmonic patterns screener here. You’ll get a 7-days free trial (+ 50% off your 1st month subscription if you decide to continue).
Or you can just continue reading and learn more with our article below about butterfly patterns.
What is the Butterfly pattern?
The butterfly pattern is a reversal chart pattern that is in the category of harmonic patterns. It shows price consolidation and is mostly noticed at the end of an extended price move.
Traders can apply the butterfly pattern to determine the end of a trending move and position for the start of a correction or new trend phase. You will often see this pattern during the last wave of the impulse sequence in Elliott wave terms.
The harmonic butterfly pattern, like all other harmonic patterns, is a reversal trading pattern that can be universally traded all the time. Some people prefer to trade them on higher time frames.
Some many different structures and variations can be seen as butterfly structures. The butterfly looks similar to the Gartley 222 harmonic pattern, but the main advantage is that traders can buy and sell at new lows or highs because wave D terminates beyond the starting point of wave XA.
The pattern was discovered by Bryce Gilmore and Larry Pesavento, and it usually forms close to the extreme lows and highs of the market and predicts a reversal.
The butterfly pattern is made up of four legs marked X-A, A-B, B-C, and C-D. It helps traders determine when a current price move is probably getting to its end. This means traders can enter the market as the price changes direction.
How to identify the Butterfly pattern?
Just as mentioned earlier, the butterfly pattern resembles the bat and Gartley patterns, with four different legs labeled X-A, A-B, B-C, and C-D. The pattern tells traders when to sell after the pattern has completed.
X-A
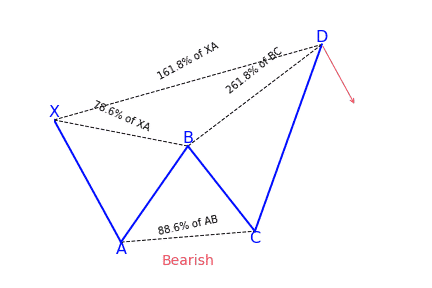
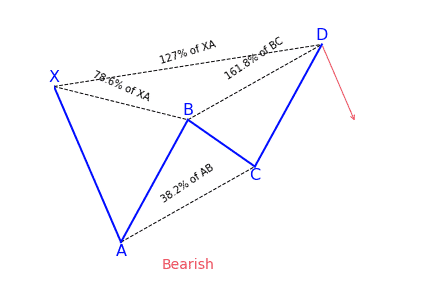
In its bearish version, the first leg is formed when the price sharply falls from point X to A.
A-B
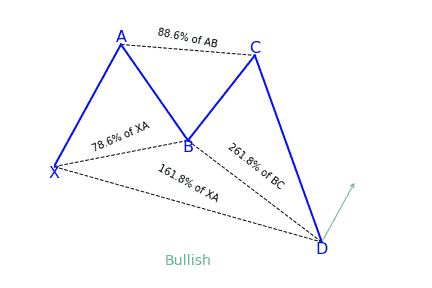
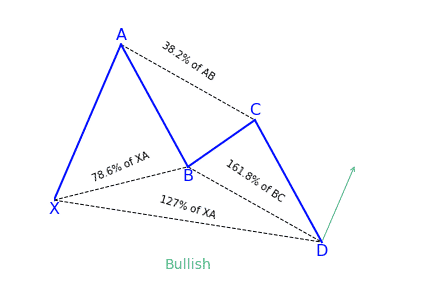
The A-B leg then notices the price switch direction and retraces 78.6 percent of the distance covered by the X-A axis.
B-C
In the B-C leg, the price changes direction for a second time and goes back down, retracing 38.2 to 88.6 percent of the distance covered by the A-B leg.
C-D
The C-D axis is the last and most significant part of this pattern. Just as it is with the Bat and Gartley patterns, you should also have an AB=CD structure to complete the butterfly pattern, but the C-D leg mostly extends to form a 127 or 161.8 percent extension of the A-B leg. Traders would be looking to enter at point D of the pattern.
A big variation with the butterfly pattern over the Bat or Gartley patterns is that traders look to place their trade entry order at the point where the C-D leg has reached a 127 percent Fibonacci extension of the X-A leg. It is the longest leg of the pattern. Generally, point D should also show a 161.8 to 261.8 percent extension of the B-C leg.
The pattern has four price swings, and its presence on the chart looks like the letter ‘M’ in downtrends, and ‘W’ in uptrends. During its formation, it can at times be mistaken for a double bottom or double top pattern.
What does the Butterfly pattern tell traders?
The Butterfly is one of the most important harmonic patterns due to its nature of where it shows up. Both Carney and Pesavento emphasized that this pattern shows the important highs and lows of a trend. In fact, by using various time frame analyses, it is common to see various butterfly patterns show up in different timeframes all at the end of a trend. The pattern is an example of an extension pattern and it generally forms when a Gartley pattern is invalidated by the CD wave going pass X.
There are two versions of this pattern that are bullish, in which traders are advised to buy, and bearish in which traders should sell. Precision is vital when it comes to applying the butterfly pattern because it allows traders to get rid of errors.
How to trade when you see the Butterfly harmonic pattern?
Before trading the butterfly harmonic pattern, confirm from the following checklist that the pattern is real. It should have the following vital elements:
- AB= an ideal target of 78.6 percent of XA leg
- BC= minimum 38.2 percent and maximum 88.6 percent Fibonacci retracement of AB leg
- CD= Is a target between 1.618 to 2.618 percent Fibonacci extension of AB leg between 1.272 to 1.618 of XA leg
Entry point
Determine the place where the pattern will complete at point D – this will be at the 127 percent extension of the X-A leg.
Stop-loss
Put a stop-loss just below the 161.8 percent Fibonacci extension of the X-A leg.
Take profit target
The location for placing a take-profit target with this pattern is very subjective and depends on your trading goals as well as the conditions of the market. To have an aggressive profit target, put it at point A of the pattern. For a more conservative profit target, put it at point B.
Trading a bearish butterfly harmonic pattern
Place the sell order at point D (a 127 percent extension of the XA leg). Position the stop-loss right above an extension of 161.8 percent of the XA leg. And place the profit target at A for an aggressive move at B for a defensive move.
Trading a bullish butterfly harmonic pattern
Determine the end of the pattern at point D, which is an extension of 127 percent of the XA leg. You need to put a buy order at this point. Now, below a Fibonacci extension of 161.8 percent of the XA leg, a stop-loss can be placed. Placing a profit target depends on both market conditions and your trading goals.
Comparisons to the Gartley pattern
The similarities of the butterfly and the Gartley pattern is in their construction — five points and four legs. But there are some vital differences, the most notable being that the butterfly is an extension pattern, not a retracement pattern, meaning that point D of the pattern goes beyond the starting point X. For a Gartley pattern, D represents a retracement back toward X, and not an extension beyond.
Also, statistics reveal that a butterfly pattern gives a higher chance of a successful trade than a Gartley pattern. Another thing to consider is that reversals after the completion of the butterfly are sharper as well.
Conclusion
It doesn’t matter if you are a beginner trader or a professional, you should not ever underestimate the efficiency of chart patterns as trading analysis tools. They are vital when it comes to indicating a reversal or continuation of the current trend and determining entry and exit positions. Butterfly patterns especially can be important in determining the end of price movements.
When effectively used, they can determine future price action with high accuracy. It makes them an important tool among traders in most markets (forex, stock, …).
Looking for a way to automatically find harmonic patterns in your favorite markets?
You definitely need a screener for that! Check out this harmonic patterns scanner here!
If you come from us (simply click the link below), you’ll get a 7-days free trial and 50% off your first month’s subscription fee. Don’t think more, go test it out for free now!
Click here to signup and claim your 7-days free trial to the best harmonic pattern scanner.


 We loved Marwood Research’s course “Candlestick Analysis For Professional Traders“. Do you want to follow a great video course and deep dive into 26 candlestick patterns (and compare their success rates)? Then make sure to check this course!