
- The ascending triangle pattern is a continuation pattern.
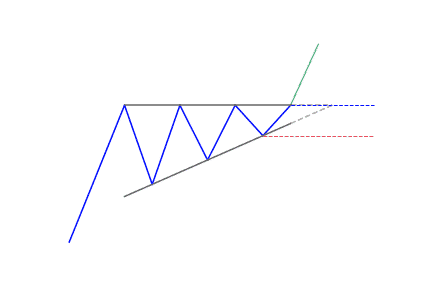
- Price typically breakout in the direction of the prevailing trend.
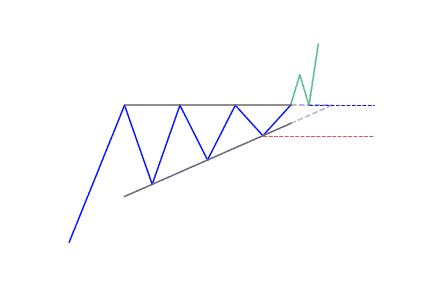
- It forms between a horizontal resistance and an upward slope trendline
- It helps traders frame their trade, giving an entry, stop and target
If you’re wondering where to go to chart your favorite markets and hunt for ascending triangle patterns, the best charting tool is TradingView. Click here to get started for free with TradingView!
What is the Ascending Triangle classical pattern?
This pattern is a continuation pattern
Often referred to as the ‘rising triangle’, the ascending triangle pattern is one of the top continuation classic patterns. It then appears in the middle of a trend. They are usually called continuation patterns because the price will breakout in the same direction as the trend that was in place just prior to the triangle forming. Most traders anticipate the market to go on in the direction of the bigger trend and form trading setups accordingly.
It is a chart pattern created by price moves that allows:
- to draw a horizontal line along the swing highs
- to draw a rising trend line along the swing lows
The pattern is popular in technical analysis. Usually, traders watch for breakouts from triangle patterns. The breakout can happen to the upside or downside. It is “easy” to trade using an ascending triangle because it provides a clear:
- entry point
- profit target
- and stop loss level
The ascending triangle typically is a bullish formation that mostly forms during an uptrend as a continuation pattern. There are times when ascending triangles form as reversal patterns at the end of a downtrend. Ascending triangles are bullish patterns that indicate accumulation regardless of where they form.
Principle and validity of a good Ascending Triangle
Due to its shape, the pattern has a (less popular) other name: a right-angle triangle. Two or more equal highs form a horizontal line at the top. Two or more rising troughs form an ascending trend line that converges as it rises on the horizontal line. If both of the lines extend towards the right, the ascending trend line could act as the hypotenuse of a right triangle.
In most instances, an ascending triangle is valid if it has good oscillation between the two lines. Each of the lines must have been touched at least once to validate the pattern. It’s called a check. It is important to note that before a line is considered valid, it has to touch the resistance or support at least three times. This means that the ascending triangle pattern is considered confirmed if the price touches the support line at least three times and the resistance line twice.
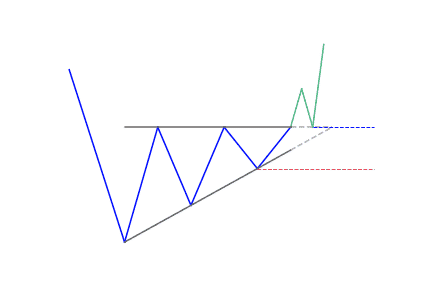
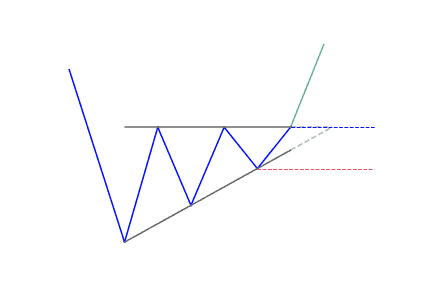
The Ascending Triangle as a bottoming pattern
The location of the ascending triangle in relation to the trend is important. It will determine if there will be a continuation or a reversal in the trend. It is possible for the ascending triangle to appear at the bottom of a downtrend. This means that the downward momentum is fading before it changes direction. Therefore, the pattern’s location is very important.
How to identify an Ascending Triangle
It is fairly easy to identify an ascending triangle on forex charts as long as you know what to look for.
- Uptrend: The market has to be in an uptrend before the ascending triangle will appear. This is crucial. It emphasizes that traders should not just trade the patterns when they notice the appearance of an ascending triangle.
- Consolidation: This occurs when the ascending triangle begins to take its form as the market gets into the consolidation phase.
- Rising lower trend line: As the market consolidates, a rise in trend line can be drawn by connecting the lows. This ascending trend line indicates that buyers are gradually pushing the price upwards. This gives further support for a bullish trading bias.
- Flat upper trend line: The upper trend line acts as resistance. Price mostly approaches this level and bounces off until the breakout happens eventually.
- Trend continuation: After the price posts a strong break above the upper trend line, you should look for a confirmation of the pattern through a continued upward momentum.
What does the Ascending Triangle pattern tell traders?
Generally, most traders consider an ascending triangle to be a continuation pattern, meaning that the pattern is significant if it happens within an uptrend or downtrend. Once the breakout from the triangle occurs, traders usually buy or sell the asset aggressively depending on which direction the price breaks out. Increasing the volume will help to confirm the breakout, as it indicates rising interest as the price moves out of the pattern.
For the purpose of trading, traders can enter when the price breaks out. Buy if the breakout happens to upside, or sell if it happens to the downside. Place a stop-loss just outside the opposite side of the pattern. For instance, if a long trade develops on an upside breakout, place a stop loss just below the lower trend line.
Traders can estimate the profit target based on the height of the triangle added or subtracted from the breakout price. Use the thickest part of the triangle. If the triangle is $10 high for instance, add $10 to the upside breakout point to get the price target. If the price is less than that, the profit target is the breakout point less of $10.
How to trade when you see the pattern
When trading the ascending triangle, traders need to identify the uptrend. Soon afterwards, the ascending triangle appears as the forex candlesticks begin to consolidate. The measuring technique can be applied once the triangle forms, as traders anticipate the breakout.
After noticing a strong break above resistance, traders can enter a long position, setting a stop at the recent swing low and take profit target in line with the measuring technique.
The price objective of an ascending triangle is determined by the high point of the base of the triangle, which is plotted on the break out point above the resistance. Another technique is made up of drawing a line that is parallel to the ascending triangle support line, from the first contact with the resistance.
The pattern of the ascending triangle indicates that the buyers are more aggressive than the sellers as the price continues to make higher lows. The pattern completes itself when the price breaks out of the triangle in the direction of the overall trend.
Difference between an Ascending Triangle and a Descending Triangle
Both of these triangles are continuation patterns, except they look differently. The descending triangle has a horizontal lower line, while the upper trend line is descending. This is the opposite of the ascending triangle which has a rising lower trend line and a horizontal upper trend line.

If you’re still looking for a trusted source to get your price charts, TradingView is the solution! Most of the charts you can see on the website come from there. It’s both user friendly, performant and very affordable. They let you freely chart almost any asset with all indicators you could think about.
Click here to get start on TradingView for free!


 We loved Marwood Research’s course “Candlestick Analysis For Professional Traders“. Do you want to follow a great video course and deep dive into 26 candlestick patterns (and compare their success rates)? Then make sure to check this course!