
 Good Trading requires the Best Charting Tool!
- The abandoned baby pattern is a 3-bar reversal pattern.
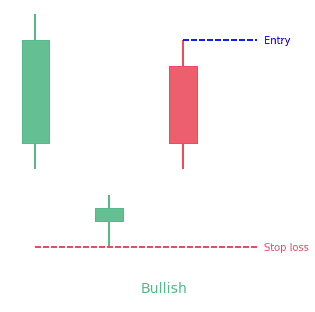
- The bullish abandoned baby follows a downtrend. It has a big red candle, a gapped down doji and then a big green gapped up candle.
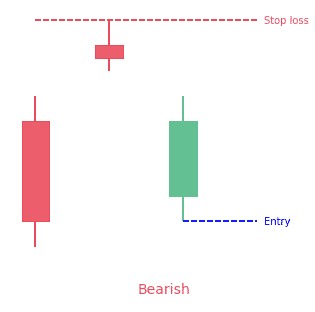
- The bearish abandoned baby follows an uptrend. It has a big green candle, a gapped up doji and then a big red gapped down candle.
Statistics to prove if the Abandoned Baby pattern really works
Are the odds of the Abandoned Baby pattern in your favor?
How does the Abandoned Baby behave with a 2:1 target R/R ratio?
From our research the Abandoned Baby pattern confirms 81.4% of the time on average overall all the 4120 markets we analysed. Historically, this patterns confirmed within 3.5 candles or got invalidated within 13 candles. If confirmed, it reached the 2:1 R/R target 31.8% of the time and it retested it's entry price level 98.9% of the time.
Not accounting for fees, it has an expected outcome of -0.046 $/$.
It means for every $100 you risk on a trade with the Abandoned Baby pattern you lose $4.6 on average.
Want to account for your trading fees? Have the detailled stats for your favorite markets / timeframes? Or get the stats for another R/R than 2:1?
🚀 Join us now and get fine-tuned stats you care about!
How to handle risk with the Abandoned Baby pattern?
We analysed 4120 markets for the last 59 years and we found 817 occurrences of the Abandoned Baby pattern.
On average markets printed 1 Abandoned Baby pattern every 19 097 candles.
For 2:1 R/R trades, the longest winning streak observed was 5 and the longest losing streak was 11. A trading strategy relying solely on this pattern is not advised. Anyway, make sure to use proper risk management.
Keep in mind all these informations are for educational purposes only and are NOT financial advice.
If you want to learn more and deep dive into candlestick patterns performance statistics, I strongly recommend you follow the best available course about it. Joe Marwood (who's a famous trader with more than 45 000 Twitter followers) created an online course called "Candlestick Analysis For Professional Traders" in his Marwood Research University. There he will take you through the extensive backtesting of the 26 main candlestick patterns. He then summarizes which one is THE best pattern. Do you know which one it is?
Remember, don't trade if you don't know your stats. Click here to signup to the course now!
With their eye-catching features, candlestick patterns as some of the most popular means of carrying out technical analysis in trading today. They make it easier to gauge the market action, and could give traders an edge in the market. The abandoned baby candlestick pattern is no exception.
What is an Abandoned Baby candlestick pattern?
An abandoned baby is a startling sight in the real world; it is a very rare reversal signal. At times, the abandoned baby will be a bear (cub), and other times it will be a bull (calf). Either way, it indicates the possible reversal of a current trend. Luckily, the formation of this pattern fits its name quite well — a tiny doji on its own (the baby), the surrounding candles a step higher or lower (the parents) — so it is easy to detect.
The abandoned baby candlestick pattern is a three-bar reversal formation. It is similar to the morning and evening star formations. It is a very dependable reversal signal when it shows up after a sharp rise or drop. Although it is very similar to the morning star and evening star, it has one major difference.
The real bodies and shadows cannot overlap from bar 1-2 and 2-3. This makes it a very rare, unique, and reliable pattern at the same time. Even though the formation has a baby in its name, just as the concealing baby swallow formation, it has more in common with the island reversal pattern.
This candlestick is a rapid shift in momentum from the bulls to the bears or vice versa and typically catches the other side off guard. Rallies off a baby bottom that has been abandoned can be rapid as short sellers will be forced to cover quickly. On the other hand, declines after the abandoned baby top can be just as fast as many traders long to sell their positions, aiming to keep most of their profits.
How to identify the Abandoned Baby candlestick pattern?
It is difficult reacting to this candlestick if you can’t identify it, so let’s start by discussing its formation. This pattern is formed by three candles: one doji and two candles with real bodies, forming the bearish and bullish abandoned baby candlestick patterns.
Bearish Abandoned Baby
A bearish abandoned baby candlestick is a specialized pattern made up of three candles, one with rising prices, a second withholding prices, and a third with prices that are falling. Experts in technical analysis expect that this pattern signals at least a short-term reversal in a currently upward trending price. The appearance of this pattern is very rare, appearing only about 50 times over the past two decades. The signal is usually followed by bearish performance over the short term.
This pattern must first show a big green (or white) candlestick in an uptrend, and then the white candle must be followed by a doji that gaps above the close of the first candle. Finally, the last candle in the trio must be red (or black) and open below the doji.
Identifying a bearish Abandoned Baby candlestick
A candlestick becomes bearish abandoned baby if it meets these qualities:
- The first candlestick is in the direction of the major trend
- The second candlestick is a doji which gaps, also in the direction of the primary trend, not overlapping with the real body or shadow of the previous candle
- The third candlestick is in the opposite direction of the first day and gaps in the opposite direction of the doji
Bullish Abandoned Baby
This is a bullish reversal pattern, which means that it comes up at the end of a downtrend and indicates the reversal of the trend. The bullish abandoned baby is made up of three candles, where the first is bearish and followed by a gap to the downside. The second one becomes a doji, while the last candle gaps up and ends as a positive candle.
This pattern forms when the forces of selling stocks move to buying stocks. This occurs when investors anticipate a trend change as a result of fundamental or psychological reasons.
In the morning or evening star pattern, the second candle covers the first and third candles. In the bullish pattern, an overlap between the first and third candle doesn’t occur. This shows a gap in the opening price. The sellers and buyers are pushing the prices. Due to this, a gap forms.
Identifying a bullish Abandoned Baby candlestick
A candlestick becomes bullish abandoned baby if it meets these criteria:
- The first candle is negative and part of the current downtrend
- The second candle is a doji that gaps down from the initial bar
- The last candle gaps up, and ends up becoming a tall bullish candle
What does the Abandoned Baby candlestick pattern tell traders?
Bearish Abandoned Baby pattern
This pattern can be an indication for a downward reversal trend in the price of a commodity. It is formed when a doji-like candle is followed by a gap between its lowest price and that of the previous candlestick. The previous candlestick is a tall white candlestick with small shadows.
The doji is also followed by a gap between its lowest price and the highest price of the next candle. The next candlestick is a tall red candlestick with small shadows. In this pattern the doji candle becomes a vital signal for traders and technical analysts looking to discover a bearish reversal of a bullish trend.
When this pattern forms, price trends decrease over the next 3 weeks, about 65 percent of the time, while the return for the benchmark was positive for the same days for another kind of index.
Bullish Abandoned Baby pattern
Some traders will allow slight variations to occur. For instance, the doji may not gap below the close of the first candle; rather, it appears close to the previous close and remains there.
At times, there are two or three dojis before the price moves upwards. Some traders would accept this since the pattern is still exhibiting a decline, a leveling off, and then a sharp rise.
The psychology behind the pattern is that the price has been aggressively dropping and just had a big sell-off again. The price then forms a doji, which indicates that selling is leveling off as the open and close prices of the doji are almost the same. Dojis are commonly linked with indecision.
In this instance, the doji means that sellers may be losing strength and buyers are starting to step in. The dojis are followed by a strong advancing candle that gaps higher from the doji. This indicates that buyers have regained control and that the selling has at least temporarily been exhausted.
Traders may search manually for the bullish abandoned baby, or trade it when it appears; they can also scan for the pattern by making use of any trading software.
How to trade when you see the Abandoned Baby pattern?
The good thing about the abandoned baby pattern is that if it appears on the chart, traders can trade it right away, without necessarily using additional trading indicators to confirm the signal, because the pattern is pretty dependable.
Stop-loss order
When you trade the pattern you should always protect your trade by placing a stop-loss order. The right location of the stop should be lower than the wick of the middle candle of the formation. Also, feel free to put the stop as tight as possible.
Profit target
You can always use an oscillator or a moving average to leave a trade. The other option is to depend on basic price action rules to close your profitable position.
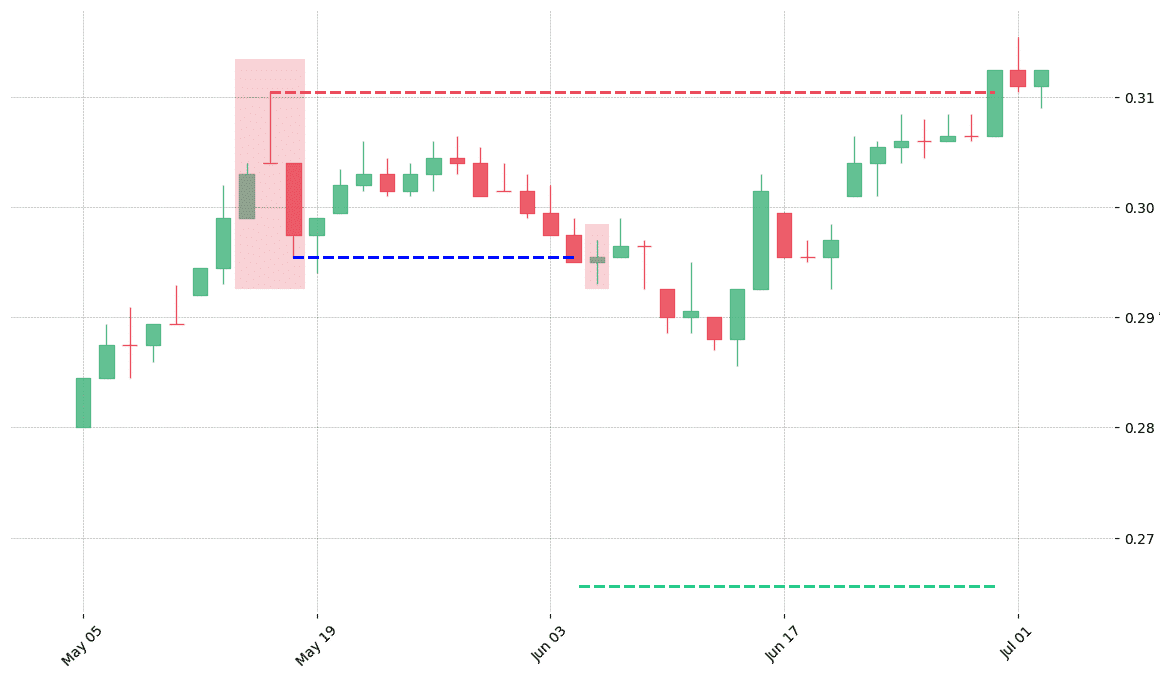
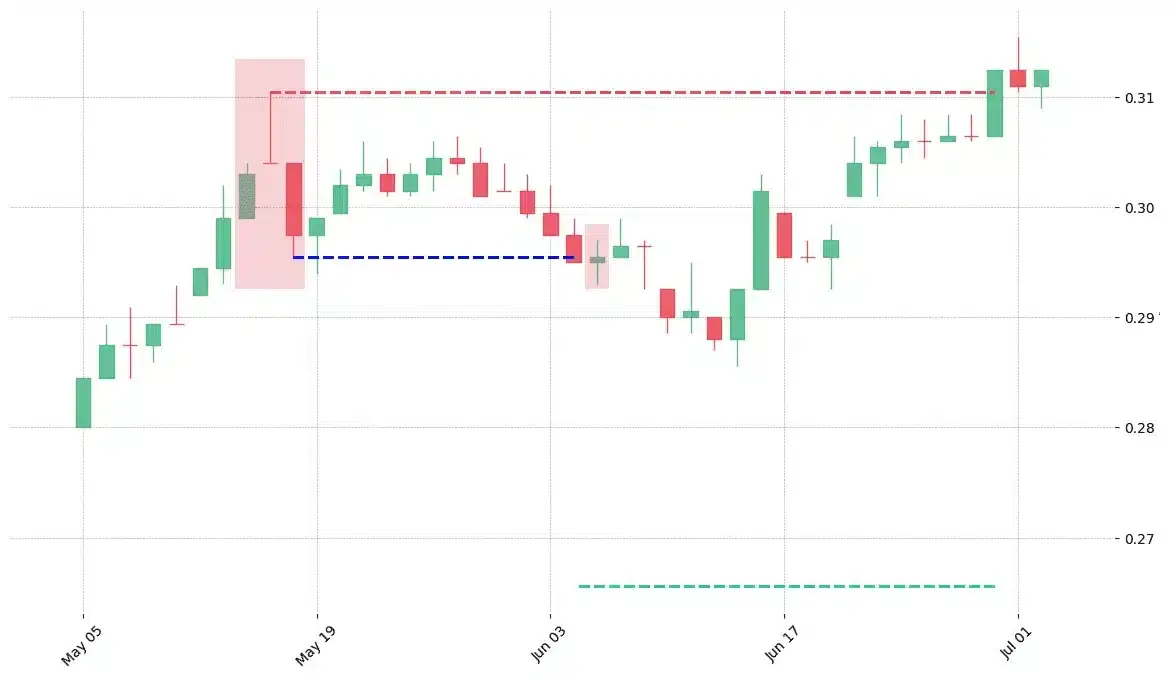
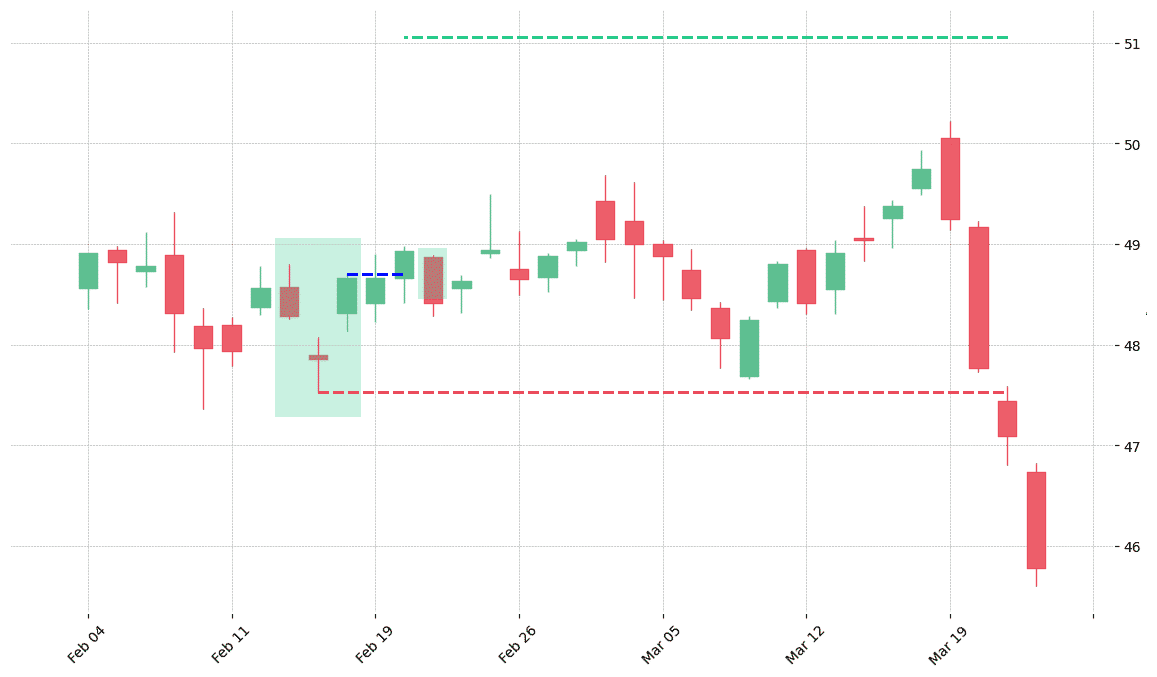
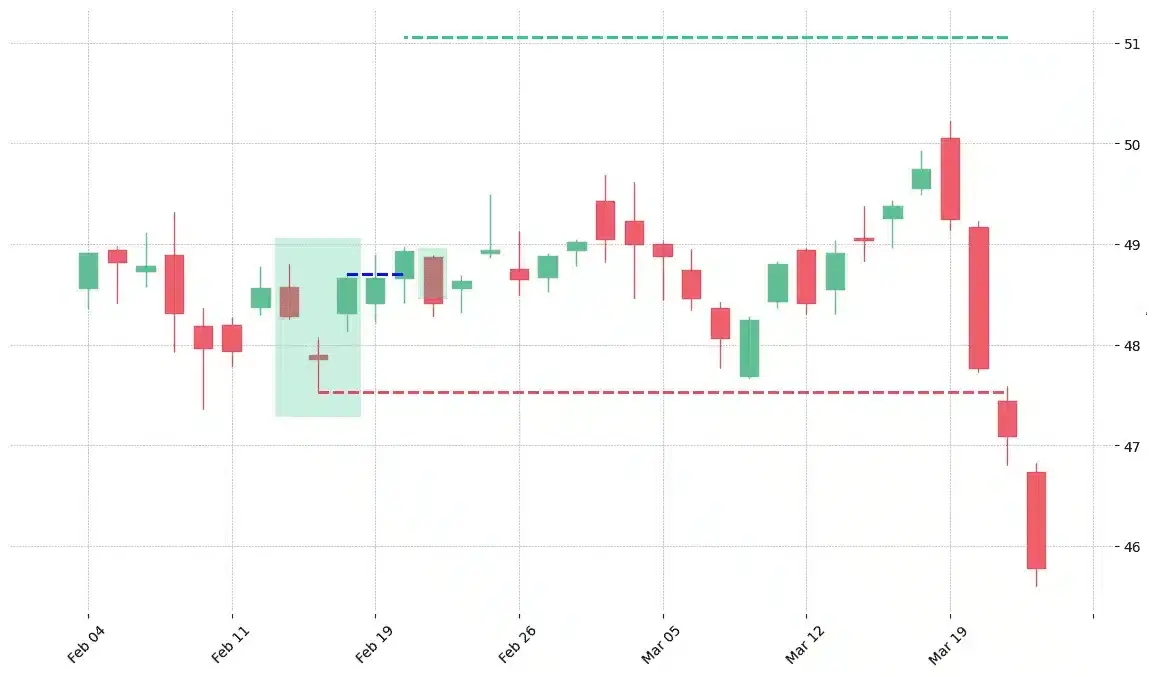
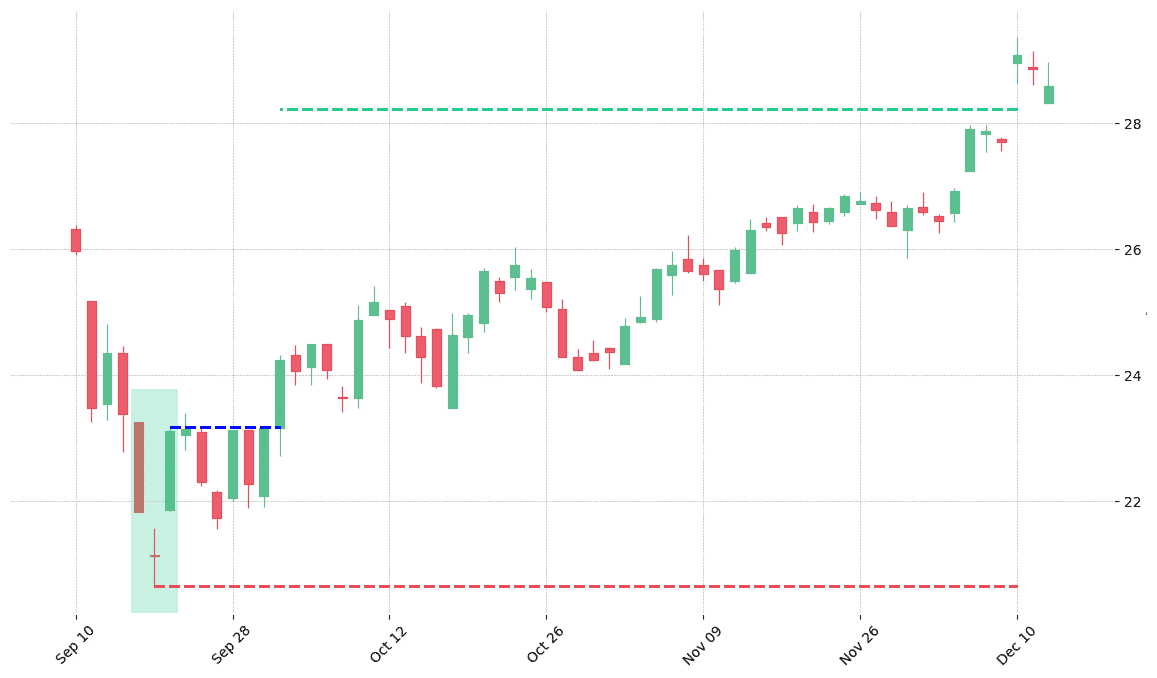
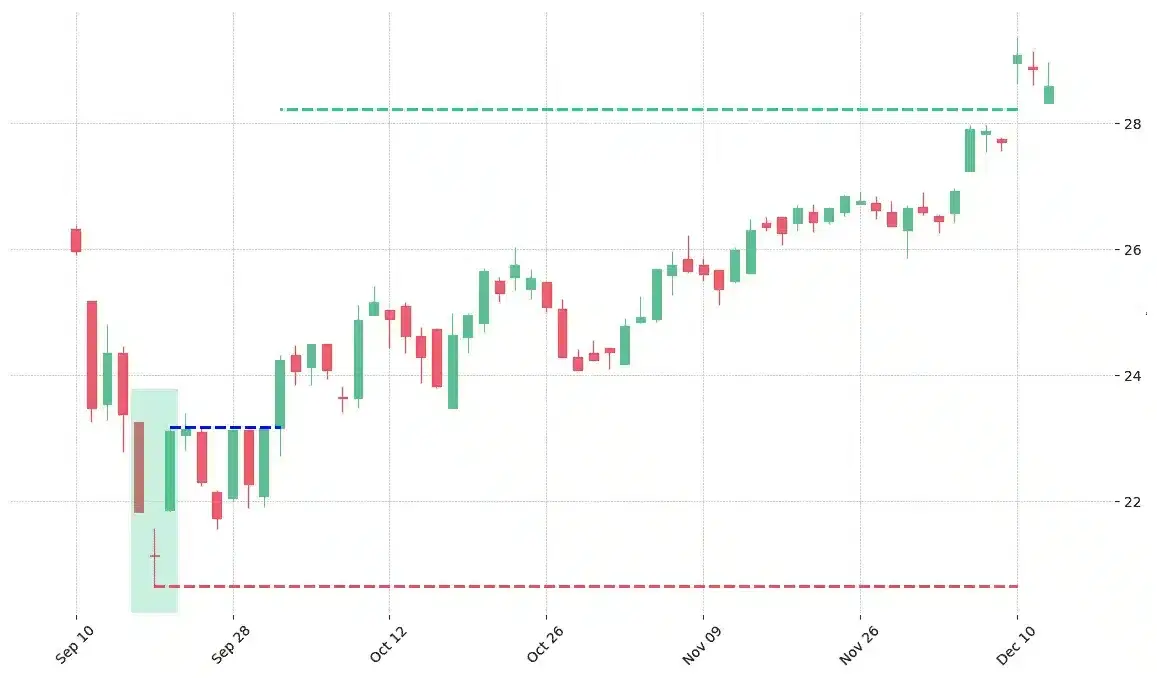
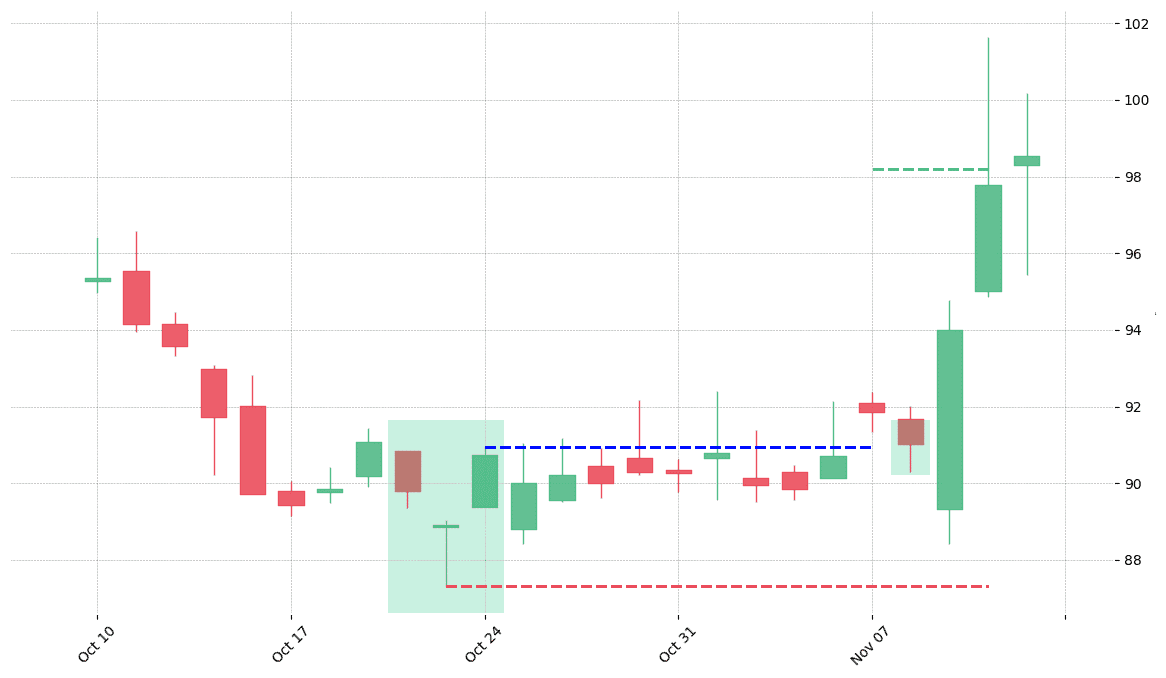
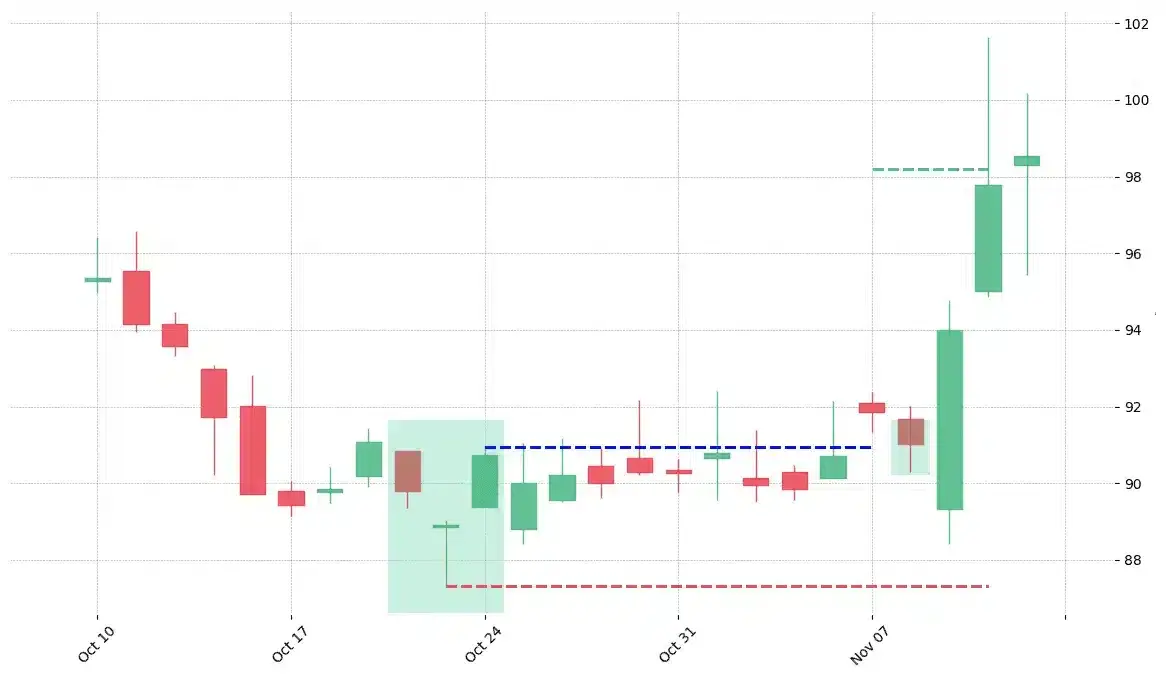
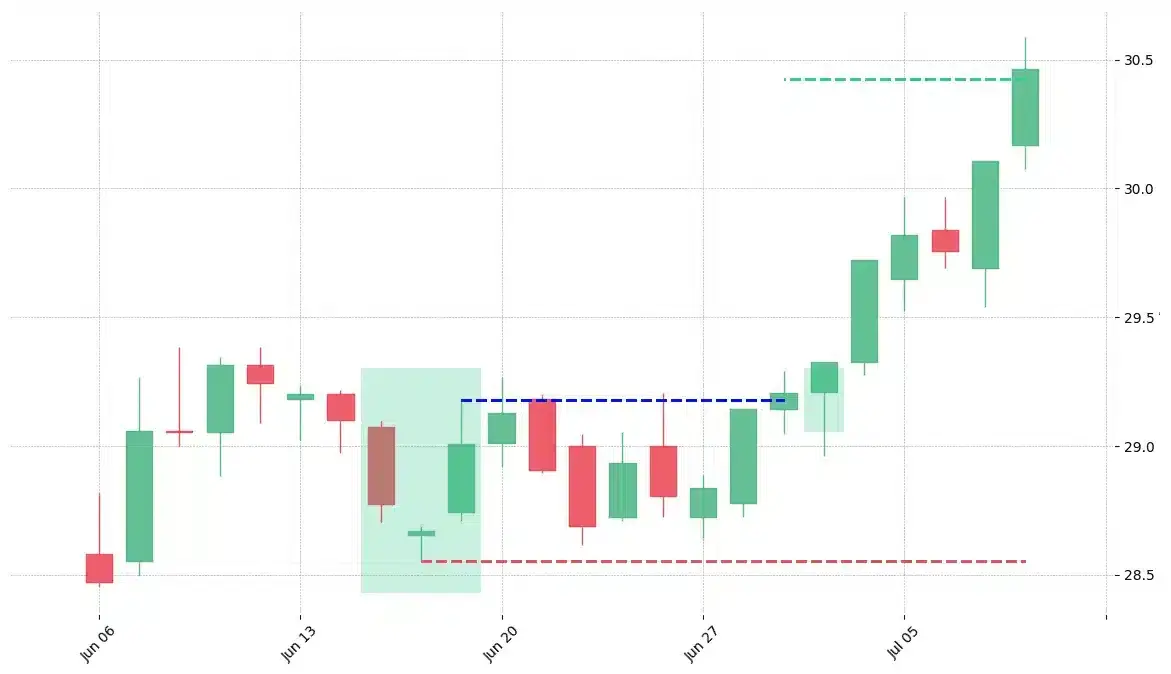
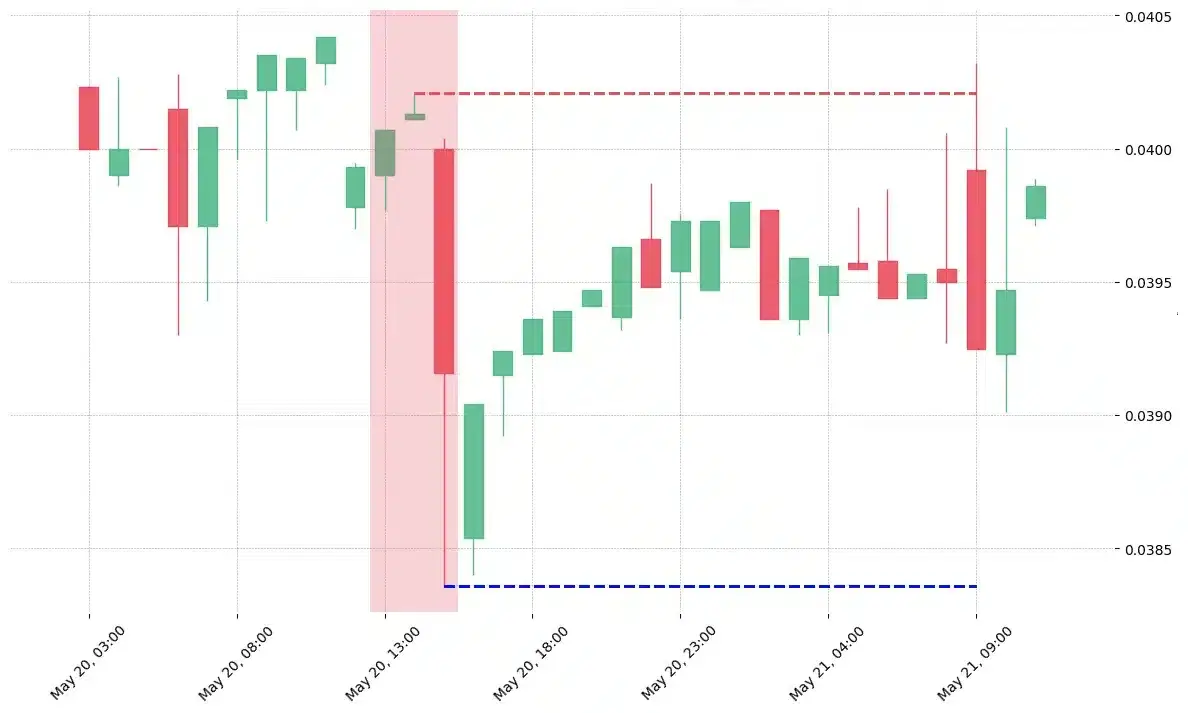
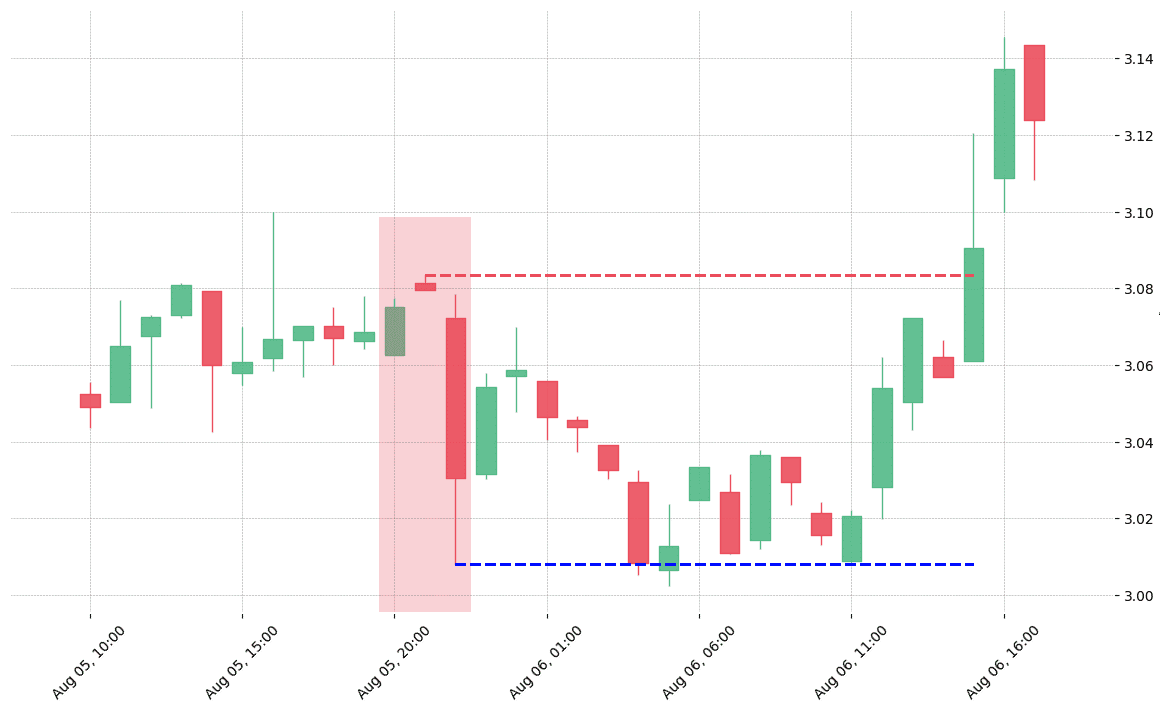
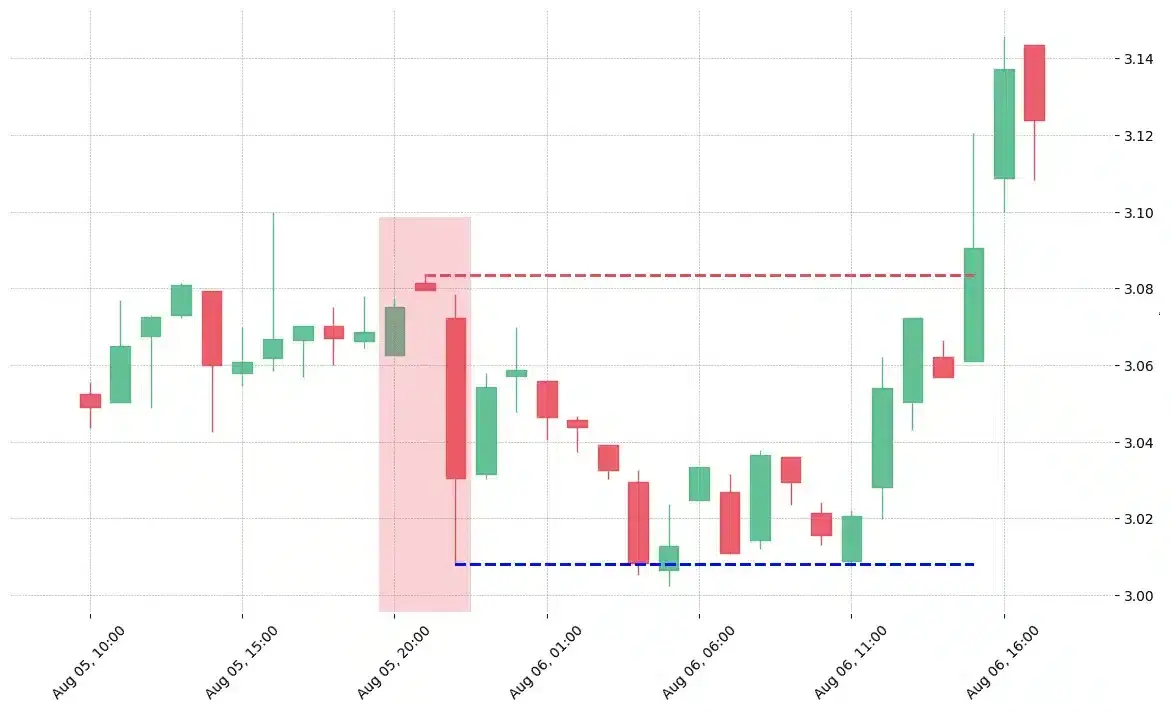
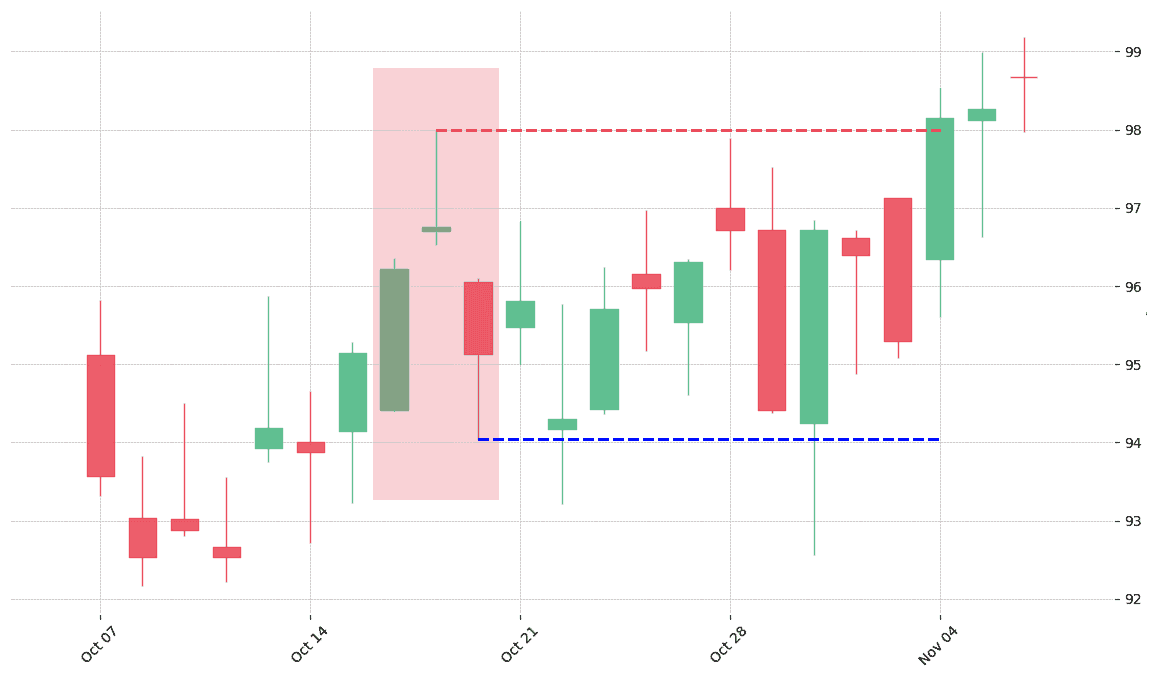
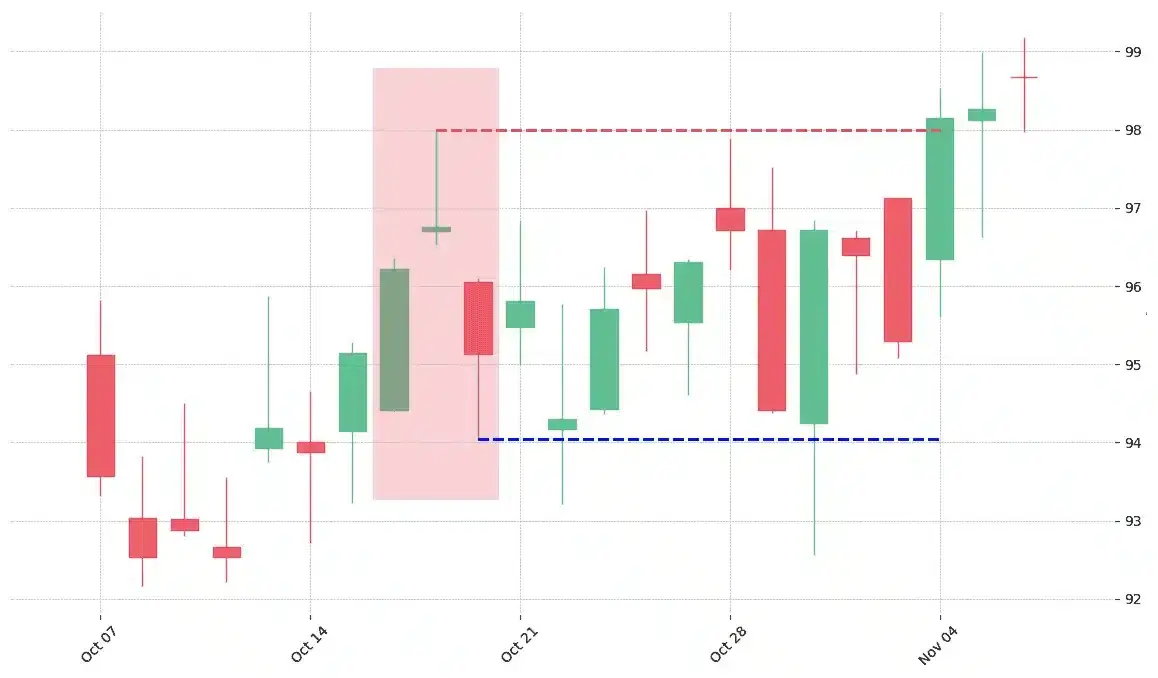
How does the Abandoned Baby pattern look in real life?


Looking to learn more about this pattern?
You should take a look at Joe Marwood's online course. In his course, he backtested the 26 main candlestick patterns before to summarize which one is THE best pattern. I really liked his course and you shouldn't miss it!
Click here to signup to his "Candlestick Analysis For Professional Traders" course now!


 We loved Marwood Research’s course “Candlestick Analysis For Professional Traders“. Do you want to follow a great video course and deep dive into 26 candlestick patterns (and compare their success rates)? Then make sure to check this course!